Projects – Spring 2021
Click on a project to read its description.
About Bandwidth, Inc.
Bandwidth is a software company focused on communications. Bandwidth’s platform is behind many of the communications you interact with every day. Calling mom on the way into work? Hopping on a conference call with your team from the beach? Booking a hair appointment via text? Our APIs, built on top of our nationwide network make it easy for our innovative customers to serve up the technology that powers your life.
Background and Problem Statement
Kari’s Law:
https://www.bandwidth.com/blog/karis-law-compliance-mlts-911-and-what-that-means-for-your-business/
Kari’s Law requires businesses using multi-line telephone systems (MLTS) to implement notifications to designated personnel when a 911 call has been made. These notifications can take the form of a phone call, email, SMS/text message, or conspicuous on-screen message.
Bandwidth currently has a solution for voice, email, and sms, but we don’t have a mobile-push-notification solution.
Project Description
We really need a Proof-of-Concept. We want to see if this is feasible to generate a mobile push notification with our API’s.
Adequate notification necessitates an awareness of end-point location. A simple notification without the location of the 9-1-1 call is rendered useless when the emergency takes place in a multi-floor building, large campus environment, warehouse, etc.
This means that your communication system will need to provide both notification of a 9-1-1 call, as well as alert someone as to where that call is coming from within your enterprise.
Possible Personas:
Hotel staff: Medical emergency happens on Hotel grounds and you need to direct staff to the location of the emergency.
Campus Security: Emergency happens and you need to direct campus security to an area of the campus that requires security keys.
On the Emergency-Voice-Services team, we save lives for a living. With larger organizations, like school campuses and giant hotels, you can’t expect emergency services to show up at the front desk and wait to figure out where a 911 call came from.
This feature/POC will assist organizations and emergency services with rendering help faster and directly to the location.
Technologies and Other Constraints
Super Flexible here.
Would encourage cloud technologies like AWS Amplify, Microsoft Azure Notifications Hub, or Google Firebase.
Super Flexible here. We would prefer Bandwidth API's to trigger the notification. We would expect at least 1 type of phone vendor as the end notification. This could also be a mobile simulator.
The cheaper the better.
About BCBSNC
BCBSNC is a healthcare insurance provider that needs to exchange data consistently and quickly with many other organizations.
Background and Problem Statement
BCBSNC is looking to expand use of private blockchain technology for sharing data with outside organizations. Configuration of the blockchain technology is very manual and we are looking for a way to simplify the administration.
Project Description
This project is a deep dive into the Hyperledger Fabric Blockchain technology and building graphical user interfaces to administrative command line tools. It will create a project that simplifies setting up a peer node and managing it using AWS ECS deployments.
Much of Hyperledger Fabric technologies are managed through cumbersome command line utilities and JSON / Yaml configuration files. This project aims to simplify the administration and reduce potential errors.
Technologies and Other Constraints
Required:
- Docker and AWS ECS
- Hyperledger Fabric
- YAML, JSON and Protocol Buffers
- Node.js and React
Flexible:
- Electron based client installed application
Desktop (preferred) or web-based
Background
Every semester, the Computer Science Department has to schedule all of the courses that will be offered in the next semester. Typically, this means finding an appropriate time for around 200 separate sections (lectures and labs).
The faculty members who teach these courses are available only on certain days and times, and classrooms are often in short supply. Furthermore, there are courses that should not be scheduled at the same time, because they are likely to be taken in the same semester by the same set of students.
Today, the course scheduling is done mostly manually, using Google Forms to collect faculty availability and (many) Google Sheets as simulated calendars into which courses can be placed and then moved around as needed.
Project Description
In this project, you will design and implement a web-based scheduling utility with a drag-and-drop calendar interface and the ability to enforce a configurable set of rules. The key features are as follows.
- The GUI will provide separate calendar-like views for scheduling tasks (e.g. one view will be "Monday-Wednesday courses on Centennial Campus"). One view will contain all the classes that have not yet been scheduled. This GUI will replace the current use of spreadsheets for placing courses and moving them around.
- The scheduling utility requires a database to store the contents of the scheduling views, the rules, and a few other tables of useful information, such as a list of the CSC faculty and a list of courses. In order to populate the database at the start of each semester, the utility shall read an input file (e.g. CSV or JSON) for each table. And to archive the data at the end of each semester, the utility shall be able to write its data to a set of files in the same format.
- A configurable set of simple rules will help the users to avoid scheduling mistakes. Some rules are generic, such as "an instructor can be in only one place at a time". Other rules are very specific, such as "CSC 316 and CSC 326 should not be scheduled at the same time". A key design challenge is to design the representation for rules and their user experience. (How are the rules viewed and edited? What happens when the user tries to schedule a course that would break a rule?)
Technologies
The scheduling utility should use Shibboleth authentication, and authorization can simply be part of the application configuration.
No other specific technologies are required. The platform, implementation language, front-end framework, and database choices should be made with two constraints in mind. First, the CSC IT staff will be hosting the scheduling utility when it is done. Second, we hope to use the scheduling utility for many years, so we value stable technologies that rarely introduce breaking changes.
About Laboratory for Analytic Sciences
The LAS is a mission-oriented translational research lab focused on the development of new analytic technology and intelligence analysis tradecraft. Researchers, technologists, and operations personnel from across government, academia and industry work in collaboration to develop innovations which transform analysis workflows.
Background and Problem Statement
Big data is complicated and hard to monitor. To adjust to large volumes of data from multiple sources, companies have built data pipelines to normalize and standardize data before ingesting into corporate data repositories (CDR). To speed up processing, each pipeline typically executes tasks on batches of files. Some examples of processing include:
- Transforming the data into a new format (e.g. JSON to csv)
- Removing duplicate data within a batch (e.g. after removing a column or two you may have the same information repeated)
- Data validation - confirming field values are non-empty and conform to standards
To monitor the data pipeline, CDR managers are often interested in summarized information such as:
- Total amount of data / batches processed
- Specific data batches that have errored during processing
- Validation of data distributions for a longer time period than a batch (e.g. daily, weekly, monthly, yearly, etc)
- Data throughput (e.g. are we processing at the same rate as last week?)
In large repositories fed by numerous pipelines of inhomogeneous data, CDR managers have need for even more complex metrics:
- Overall distribution of data, to align with corporate priorities (e.g. keeping a ton of log data when it’s not being used / low return on investment)
- Overall data rates - where do you experience processing bottlenecks?
Can a user-friendly UI be developed to enable pipeline owners/CDR managers to centrally manage monitoring and data quality information?
Project Description
The student team will need to create a web application with an API, database, and UI, having the following functionalities:
- Ingest, process, store, and export data collected from a hosted data pipeline. The data will mainly be used to monitor the system health of data pipelines.
- Control access to information associated with individual data pipelines (e.g. very simple database table that has users and permissions -- no need to create a complex user management features)
- Minimal effort: SQL scripts to update a database table
- A little effort: Python CLI to update the tables
- More effort: UI to manage
- Display the ingested data within a tabular grid (e.g. ag-grid)
- Create an API endpoint with associated script
- The owner should be able to copy & paste and save the script in the UI (e.g. ace editor)
- Sending data to this particular API endpoint will run the script with the data as input and return the result as the response. Example usage include:
- Have we seen this particular piece of data before? (hashed info) Run this data through a machine learning algorithm
- View/log the last N number of requests and the responses
- Create monitoring scripts for an associated data pipeline
- Ability to copy & paste and save the script in the UI (see above). Notification API used within the script will allow emails sent to the user
- Set scheduled times for the script to run
- For specifically generated output, allow the data pipeline owner to view the information in an interactive graph (e.g. plot.ly)
The UI/API developed will enable CDR managers and data pipeline owners to monitor and manage their systems with greater effectiveness. Specific examples include:
- Automatically detect processing errors within a data pipeline
- Automatically get notified when data quality has changed
- Capability to add machine learning and custom API responses to dataflowse.g. De-duplicate data across batch processing
Technologies and Other Constraints
Below are acceptable options for various components.
- Database - SQL based (e.g. MariaDB, Postgres, MySQL)
- Backend - Python (Flask or Django), Node.js (Adonis), or PHP (Laravel)
- Frontend - Vue.js, Angular.js, Angular, or React
- End result should be using Docker
- To bundle frontend - webpack (suggested not required)
Web application targeting the latest Chrome or Firefox version.
Public distributions of research performed in conjunction with USG persons or groups are subject to pre-publication review by the USG. In the case of the LAS, typically this review process is performed with great expediency, is transparent to research partners, and is of little to no consequence to the students.
About Laboratory for Analytic Sciences
The LAS is a mission-oriented translational research lab focused on the development of new analytic technology and intelligence analysis tradecraft. Researchers, technologists, and operations personnel from across government, academia and industry work in collaboration to develop innovations which transform analysis workflows.
Problem Statement
Imagine overhearing the following conversation:
GEORGE: Jerry! Jerry, my hair-dryer ruined the picture! And I need another one or I can't get back into the forbidden city!
JERRY: Who is this…
GEORGE: Jerry! I need you to get another picture of Man-Hands. I'm begging you!
JERRY: If I get it for you, will you take me to that club and show me a good time?
GEORGE: Yes! Yes, all right--anything!
Now, imagine being asked to explain what they are talking about.
Finally, imagine that this conversation is not taking place in your native language.
Language Analysts frequently encounter this situation in their work. Trying to understand verbal communication is like trying to understand a random scene from a random season of a never-before-seen TV show--in a foreign language. Not only does a language analyst have to translate the foreign language into English, they need to add meaningful context to their transcripts so others will understand what is happening. Who is related to whom? What is the overall context? What code words do they use? Who lies to whom? Etc Depending on an analyst's level of expertise and the obscurity of the relevant information, adding this type of contextual information to transcripts can be very time-consuming, requiring research across various tools and resources.
By automatically extracting and organizing important contextual information from previous conversations or communications, relevant information can be suggested to analysts as they do their work. Ideally, this complex, interrelated data will be stored as a Knowledge Graph rather than a more traditional, relational database. Knowledge Graphs are a collection of interlinked relationships of entities, such as people, events, products, facilities, and religious or political groups. Most of the current open-source packages and models in the space of Natural Language Processing (NLP) and Knowledge Graph formation focus on extracting structured knowledge from narrative text such as news articles or Wikipedia. Extracting knowledge from dialogue is a more challenging problem, and the proposed senior design project addresses one challenge in this space.
Project Description
Typically, a Knowledge Graph dataset is comprised of sets of triplets consisting of subject, predicate, and object parts of speech. For example, such triplets might include (Elaine, works at, Pendent Publishing) or (Jerry, is neighbors with, Kramer). Visually, you could represent this knowledge and these relationships with a graph, where the subject and object of triplets are nodes and the predicate is the edge connecting the nodes.
Automatically collecting all subject-predicate-object triplets using NLP techniques in dialogue yields many "uninteresting" triplets. This process is relatively successful on wiki articles or news stories since most sentences in such sources contain important long-term knowledge--not a lot of filler. In dialogue, however, many triplets such as (George, ran into, Tim) have only short-term relevance; this triplet might be important in that moment, but is likely not something we need/want to store long-term in a Knowledge Graph.
Students working on this project are asked to develop techniques using rule-based or AI models to extract only the triplets with long-term relevance from dialogue data. Sponsors will provide some basic suggestions regarding how to assign values to triplets, though students will be encouraged to follow their intuitions to design their own method(s). Students will be given access to a complete set of Seinfeld episode transcripts with which to work. The prevalence of inside jokes and nicknames in the show is a common feature of dialogue; understanding these types of references is one of the key challenges for language analysts.
Students working on this project will likely want to begin by learning how to use some of the popular, open-source NLP packages currently available. By executing these state-of-the-art models and techniques on both narrative text such as news articles as well as on Seinfeld dialogue, students will be exposed to the current NLP capabilities as well as limitations.
Processing the text in order to automatically extract subject-predicate-object triplets will likely require named entity recognition as well as some coreference resolution, both of which are non-trivial tasks especially when dealing with dialogue data. If time permits and there is interest, students are encouraged to explore these topics as well. To facilitate this project, however, students can be provided with a NER model that has been specifically trained to perform well on dialogue data and works with the Python spaCy NLP package.
Students will need to develop criteria to determine which triplets are worth storing in a knowledge graph, and which are not. As mentioned above, sponsors will suggest several basic rule-based approaches but students will be encouraged to formulate their own methodology if intuition strikes. If the team desires, and time-permitting, the sponsors can request that language analysts label a set of triplets created by the students to enable more complex supervised ML approaches for triplet filtration, perhaps employing word embedding techniques to determine semantic similarity.
If time remains, stretch goals are plentiful for this project. Application of graph/network algorithms (clustering, community detection, centrality, distance, etc) could be used to enable a variety of features and to help measure the performance of the graph filtration methods developed by the students. Creating data visualizations to display results of this work would also be desirable, though development of a UI is not a current goal.
To test KG triplet filtration techniques, we will be using transcripts from the television show Seinfeld. The data set includes:
- 9 seasons (180 episodes) of dialogue from Seinfeld, most of which have been manually cleaned to ensure consistent formatting
- 4 of these seasons have also been broken into scenes (455 scenes) and manually annotated with contextual comments of the type that an analyst might be required to insert into a transcript
- episode synopses scraped from Wikipedia, with information about the "real world" (ie, actors who played characters) removed, so that the synopses focus only on the Seinfeld Universe
Benefits to End Users
The capability to automatically generate a relevant knowledge graph from transcription data could support any number of subsequent applications. The application focus of this project is to enable language analysts to efficiently annotate transcriptions with supplementary contextual information that may be critical to a reader in understanding the true meaning of the dialogue.
Technologies & Other Constraints
- General Development – Prefer Python, but others are fine (C/C++/Java/etc)
- KG Database – Many options exist (Grakn, Neo4j, GraphDB, KGTK, even a basic triple store, etc). We anticipate exploring and discussing the pros/cons of these options
- Containerization – Docker - requirement
- Cloud storage – Not a requirement, but an option if students desire
- Interface – Linux command-line interface is acceptable though an extremely elementary GUI could be developed for demonstrative purposes
- Preferred paradigm: Desktop, command-line interface is acceptable.
Public distributions of research performed in conjunction with USG persons or groups are subject to pre-publication review by the USG. In the case of the LAS, typically this review process is performed with great expediency, is transparent to research partners, and is of little consequence to the students.
Background
Surprisingly, perhaps, the most common format for data sharing among scientists, economists, and others may be the lowly CSV (Comma Separated Values) file format. And the most commonly used tool for basic data science seems to be the spreadsheet, despite the fact that Microsoft Excel is known to misinterpret certain kinds of data read from CSV files. Even worse, the data is mangled silently by Excel, which often results in the corrupted data being saved by person A, who then exports a CSV file with some bad data to share with person B. The genetics community has been hit hard by this, with many data files shared online, e.g. through conference web sites, containing bad data.
Some of the most common issues when spreadsheet users import CSV files are:
- Gene names are misinterpreted as dates by Excel. (Source: https://www.biostat.wisc.edu/~kbroman/publications/dataorg.pdf)
- Large integers can cause a variety of problems, such as automatic conversion to floating point with a loss of precision. Also, many long integers are actually identifiers (e.g. serial numbers, product codes, account numbers) in which leading zeros are important. Excel will remove leading zeros, resulting in data loss. (Source: https://www.onlinesurveys.ac.uk/help-support/common-csv-problems/)
- Different locales having different formats (e.g. for dates and currency) and separators (e.g. the "thousands separator" may not be a comma), which can confuse Excel. (Source: https://news.ycombinator.com/item?id=12041655)
- IT security is also an issue when spreadsheets like Excel read data from CSV files. A "CSV Injection Attack" occurs when an Excel formula is present in the data file. (Source: http://georgemauer.net/2017/10/07/csv-injection.html)
You would think that anyone working with data would simply avoid Excel. However, most other spreadsheets have reproduced the same bad behavior in order to work the way people expect a spreadsheet to work, which is the way the Excel works.
We can help economists, scientists, and many other people avoid spreadsheet-induced data corruption by building a tool that processes a CSV file to change the way data is represented such that it can be safely imported into Excel and other spreadsheets, like Google Sheets. We can also detect and mitigate CSV Injection Attacks.
A prototype of such a data pre-processing tool has been written in Python (by a former NCSU student) using the Rosie Pattern Language to detect a variety of data formats. This project can leverage that prototype to whatever degree it proves useful.
Project Description
In this project, you will design and build a solution for the pre-processing of CSV files for data science. Your solution will handle the problems listed above and others, as demonstrated by the prototype that you will be provided. The functionality should surpass that of the prototype in several ways. First, it must be transparent and configurable, meaning that statistical inferences and thresholds will be visible and changeable. Second, it should be extensible (by a sufficiently knowledgeable user). Third, the functionality should be accessible from the command line, from an Excel plug-in, and via a web page where users can upload files for analysis and processing, with a cleaned-up file available for visual inspection or download.
Technologies
The only required programming technology is the Rosie Pattern Language (https://rosie-lang.org), which has a library of patterns to recognize common date and time formats, as well as many others. You may need to write new patterns (which are similar to regular expressions) in your work.
Both Excel and Google Sheets should be used for testing.
Python is a candidate implementation language, due to its ubiquity and popularity in the data science community, although this is not a hard requirement.
About Siemens Healthineers
Siemens Healthineers develops innovations that support better patient outcomes with greater efficiencies, giving providers the confidence they need to meet the clinical, operational and financial challenges of a changing healthcare landscape. As a global leader in medical imaging, laboratory diagnostics, and healthcare information technology, we have a keen understanding of the entire patient care continuum—from prevention and early detection to diagnosis and treatment.
At Siemens Healthineers, our purpose is to enable healthcare providers to increase value by empowering them on their journey towards expanding precision medicine, transforming care delivery, and improving patient experience, all enabled by digitalizing healthcare.
Background and Problem Statement
Our service engineers perform planned and unplanned maintenance on our imaging and diagnostic machines at hospitals and other facilities around the world. Frequently, the engineers order replacement parts. The job of our department, Managed Logistics, is to make the process of sending these parts to the engineer as efficient as possible. We help to deliver confidence by getting the right part to the right place at the right time.
In order to provide the quickest and best service possible, we have a network of smaller warehouses around the country, keeping frequently needed parts closer to our customers than they would be in one central warehouse. Our goals are to verify whether our current warehouses are in a location that minimizes wait for our customers and to determine the best possible locations for additional warehouses.
Project Description
We are looking for software that can make use of our recent order history along with traffic data in the contiguous 48 states to show optimal depot locations. The software will have a user interface that allows users to input constraints and variables, and displays potential locations on a map.
One great way this will help us is to solve the problem mentioned in the problem statement. The more efficiently we can deliver spare parts, the quicker our engineers can have medical machines back online for hospitals.
Technologies and Other Constraints
We hope the students will be able to determine the right technologies to use.
Web-based using a maps/traffic API
Non-disclosure Agreement will be provided
Skyward Federal
Skyward Federal leads development of secure cloud-fusion technologies supporting sensitive data processing. We develop modern & secure infrastructure along with privacy-centric applications to help our clients operate securely and efficiently.
The NCSU team project will focus on developing and enhancing the next generation of secure multi-tenant cloud compute. In particular, the NCSU team will help develop a platform and pipeline to facilitate rapid application development and deployment for security-minded clients and facilitate secure data transportation and separation.
Problem Statement
SELinux is used to provide secure mandatory access control (MAC) in industries that rely heavily on confidentiality and integrity of data. SELinux assumes that multiple nodes use the same security policy when transferring data from one node to another. There is no mechanism in SELinux to coordinate security policies between multiple machines. This lack of coordination presents a challenge to both security and performance of any horizontally scalable system using SELinux; thus there must be a method to ensure SELinux security policies are applied uniformly across all nodes in a system.
Project Overview
To coordinate across multiple nodes, the development of an SELinux policy server with the Linux kernel module is needed. This policy server will operate similar to the Windows Network Policy Server such that security policies are immutably enforced across nodes.
NCSU students will first familiarize themselves with the process of developing Linux kernel modules as well as developing SELinux security policy modules. Skyward will provide resources to assist in this process.
The Policy Server will consist of two components: a server and client. The server will be deployed on a single machine which will also contain the source code for an SELinux policy module. The server will have the capability to compile and push a .pp file (SELinux policy package) to multiple machines running the client. The client will be notified of this change and build the policy module to the local node.
Project Benefit and Utility
The successful project will serve as a prototype for further policy server development with production multi-node applications that rely on mandatory access control to enforce data separation among multiple types of users through SELinux. The knowledge and experience during development will be invaluable as students continue in the field of secure software development.
Constraints
- The senior design team shall develop the SELinux policy server and clients as Linux kernel modules on virtual machines running either CentOS 7 or CentOS 8 unless another OS is agreed upon.
- The policy server and client shall be developed as Linux kernel modules. C or Rust is recommended as the language to use for writing these modules.
- SELinux policy modules shall be written using the SELinux Kernel Policy Language.
Background
Bank of America provides banking services to millions of customers. Within the security division, we are responsible for protecting the assets for those customers against all possible forms of cyberattack.
Problem Statement
Search the GitHub repository on a regular cadence for code that can potentially harm the bank.
Project
Products exist to analyse code downloaded from GitHub for malicious content. What we are interested in is going a step further while also being more specific to interests of the bank. We would like to search GitHub for code that contains content that might be harmful to the bank. Examples of this include: the development of an app that looks similar to Bank of America’s app, the use of BofA’s logo or name in any code, the use of credentials related to BofA (e.g., hardcoded username/passwords that are used to access bank assets, or that could belong to BofA employees or clients), or any code that looks like it is intended to access bank assets or attack the bank.
Basic functionality:
- Code will need to be developed that searches through GitHub for possible bank references, and so will need to operate at this scale
- Students will need to develop code that can alert (via screen and/or email) when questionable code has been identified. Alert should indicate why the code has triggered an alert.
- Needs to be able to run continuously.
- Initial target: identification via regular expression of bank references (e.g., BofA, Bank of America, etc.) in code comments or even code (e.g., BofA as a variable name, or references to bankofamerica.com)
- Code that might not reference BofA directly, but might contain comments that demonstrate that they are generic to attacking banks, or might be aimed initially at other banks but could also be turned against BofA
- Needs to be modular so that it can be extended easily with other types of code analysis
Front-end interface:
- Display as a web page that accesses historical data
- Provide a dashboard showing the types of trigger code that has been identified, the numbers of repositories in each category, the date for the most recent addition to that category, etc.
- Provide ability to drill down into the details for any individual repository that has been identified
Testing:
- Testing can be performed against, for example, a generic GitHub repository set up by the students with different types of trigger code, and against a subset of the GitHub repository
Stretch Goals/Functionality:
- Code that includes the bank’s logo
- Code for mobile apps that look like it might be emulating BofA’s mobile app
- Code that is being directed towards the bank (e.g., password guessing tools developed to specifically target the bank)
Technologies and Other Constraints
- Technologies: Python, GitHub API, potentially others as recommended by students.
- Constraints: results are easier to import into the bank if they are not containerized.
- Other limitations: the students will need to sign an NDA and assign IP rights to the bank.
Problem Statement
Timely, meaningful assignment feedback is critical for students enrolled in introductory programming courses. At NCSU, some CSC116 instructors have begun incorporating automated feedback for students through NCSU GitHub repositories. Feedback often includes descriptions of Checkstyle issues, messages that indicate whether the correct project structure is being used, and whether the student code meets the teaching staff design. A Jenkins continuous integration server is used behind-the-scenes (students know there is automation, but are not aware of the continuous integration server) to help facilitate the generation of feedback. Feedback is currently provided in plaintext format through a ‘feedback’ branch of each student repository, but more structured/detailed feedback reports could be beneficial for both students and teaching staff members.
Project
For this project, the senior design team should create a web application to facilitate automated, meaningful feedback for students in introductory programming courses. The system should allow teaching staff members to:
- Upload a course roster
- Create and configure assignment details
- View reports of student performance/progress
The system should allow students to:
- Review feedback about any compiler errors
- Review feedback about GitHub directory structure/contents
- Review JUnit test case statistics
- Review Checkstyle violations
Technologies
For this project, Java is the required primary language.
Problem Statement
Continuous integration tools are often used in industry to facilitate software development. At NCSU, several undergraduate courses incorporate the use of version control, continuous integration, and various other tools to promote software engineering best practices. However, adapting these tools for use in academia and configuring the tools for different courses can be time consuming and challenging. For example, in a course with 250 students, each coding assignment might require using multiple scripts to manage tasks such as creating 250 different repositories, creating 250 unique Jenkins jobs, closing repositories after a deadline, extracting information necessary for grading, and generating feedback PDF files for students. If any student requires individual extensions on an assignment, a member of the teaching staff must manually execute the steps required to reopen/close repositories, retrieve grading information, and generate PDF feedback files.
Project
For this project, the senior design team should create a web application to facilitate assignment management for courses that use GitHub version control and Jenkins continuous integration servers. In particular, the software should allow teaching staff members to:
- Upload a course roster
- Create repositories in NCSU GitHub for each student
- Close repositories after deadlines pass
- Create Jenkins jobs for each student repository
- Enable individual student extensions
- Retrieve data necessary for evaluation, grading, and similarity detection
Technologies
For this project, Java is the required primary language.
About EcoPRT @ NCSU
Autonomous vehicles technology is maturing and could offer an alternative to traditional transit systems like bus and rail. EcoPRT (economical Personal Rapid Transit) is an ultra-light-weight and low-cost transit system with autonomous vehicles that carry one or two passengers at a time. The system can have dedicated guideways or alternatively navigate on existing roadways where the vehicles are routed directly to their destination without stops. The advantages include:
- Dual mode – existing roadways and pathways can be used for low install cost in addition to elevated roadways at a lower infrastructure cost than existing transit solutions
- A smaller overall footprint and less impact on the surrounding environment so guideway can go almost anywhere.
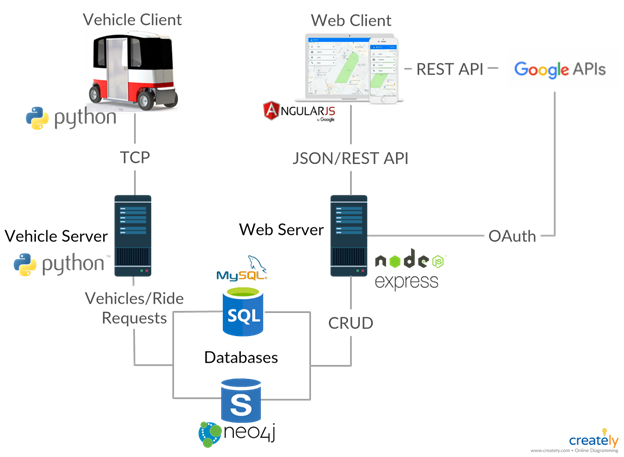
The research endeavor, EcoPRT, is investigating the use of small, ultra-light-weight, automated vehicles as a low-cost, energy-efficient system for moving people around a city. To date, a full-sized prototype vehicle and associated test track have been built. For a demonstration project, we are aiming to run a fleet of 5 or more vehicles on a section of Centennial campus. The Vehicle Network server will serve as the centralized communications and vehicle routing solution for all the vehicles.
Background and Problem Statement
With the aim of running a multi-vehicle live pilot test on Centennial Campus, the overarching goal is to create a Vehicle Network Controller (VNC) and the associated Robot Operating System (ROS) vehicle client software to guide the vehicles and provide interaction to users. Please refer to the architectural diagram below showing the server architecture of the solution. The VNC will manage a fleet of cars, dispatching them as needed for ride requests and to recharge when necessary. It will also provide interaction to users to both make these requests and manage the network itself.
The work on the VNC would be a continuation of the work from another senior design team from Spring 2020. The current VNC solution provides a means for administrators/users and vehicle clients to interact with the server in different ways. Though still considered an alpha stage at this point, there is a need to further develop the VNC to make it ready to be used with physical vehicles.
Project Description
The goals of the project involve further enhancing, improving, and testing the system as a whole. Specific goals are outlined below:
- build out logic to assign vehicles upon demand.
- build out database to keep updated vehicle status current
- build instances of emulated vehicles. Consider how this can be done either through either a docker, a virtual OS, or running multiple instances on Linux
- simulate multiple vehicles on network. There are a number of smaller details that need to be worked out to full simulate:
- emulate ride requests
- generate multiple vehicle instances
- develop KPI’s for success (i.e. dwell time, ride time)
- explore the vehicle routing algorithm
Much like a smaller version of an autonomous Uber network, the vehicles are confined to a certain area or fixed route and need to be routed according to rider requests. Further building out and simulating the solution would be the next step with an overall goal of doing a pilot of multiple EcoPRT vehicles on campus.
Technologies and other constraints
NodeJS, Python, NPM, MySQL, Neo4j, Bootstrap, AngularJS, Express, HTML5, REST, Socket.io ,CasperJS, Mocha, C++, ROS
Linux server, web-based mobile, virtualization
Background
LexisNexis® InterAction® is a flexible and uniquely designed CRM platform that drives business development, marketing, and increased client satisfaction for legal and professional services firms. InterAction provides features and functionality that dramatically improve the tracking and mapping of the firm’s key relationships – who knows whom, areas of expertise, up-to-date case work and litigation – and makes this information actionable through marketing automation, opportunity management, client meeting and activity management, matter and engagement tracking, referral management, and relationship-based business development.
The key to successful business development is the strength of your engagements with prospective clients and how that changes over time.
LexisNexis InterAction® has an algorithm that, on the basis of meetings, phone calls and email exchange, calculates the strength of an engagement between two individuals.
Whilst working at a large law firm, however, what is more significant in the overall health of the engagement (for example: robust, fragile, etc.) between all members of the firm and all employees of a company.
There may be gaps in the engagement between different legal practice teams, or excessive dependency upon the engagement of a few key players.
Project
After taking an anonymized set of engagement data from a large law firm and showing the individual connections with employees at different companies, a solution would then identify and classify repeating patterns in the engagement graphs between the firm and a company, looking for risks (e.g. should a key node be removed) or opportunities (e.g. where the engagement or experience in one area could be used to strengthen another). An existing system visualizes small networks of relationships, which could be reused for the current project.
It is anticipated that some element of Machine Learning may be necessary as part of this project.
Support will be provided by Product Development and Data Science teams at LexisNexis.
Data Sources
An anonymized engagement data set will be provided, together with metadata to identify practice area and company.
Technology
The team may choose their technology stack with any mix of Javascript, Python, and C#.
Angular 9 should be used for any web-based front end.
Ngx-charts and D3 should be used for any visualizations necessary.
About Merck
Merck's Vision is to discover, develop and provide innovative products and services that save and improve lives around the world. Merck's IT cyber organization is charged with protecting Merck's resources, processes, and patients by ensuring our technology is protected from unauthorized outside entities.
Project
Merck would like to investigate developing a web based application for entitlement management (managing access to software, tools, resources, etc.). The senior design team will create a component architecture for the entitlement management system, then begin implementing the components in collaboration with the sponsor.
The idea is based on a few basic premises.
- Both business users and partner delegates must be able to manage the provisioning of users to entitlements
- The entitlement management system must be able to identify who is provisioned to what resource at any point in time, at any point in time.
- Rules for the engagement determine if changes to the metadata about provisioning events have downstream implications to historical provisioning (for example, a resource upgrade might restrict access to the resource until training requirements have been met)
- Provisioning events live within an active workflow, and that workflow remains open until the deprovision of the entitlement is closed (for example, a chemist’s access/entitlement to specific resources is removed at the end of the chemist’s scheduled 6 month engagement with Merck)
- The system must be able to handle user-initiated provisioning (e.g., a user requests access to a particular system) as well as event based provisioning (e.g., a new employee or company is contracted and automatically given access to the relevant system resources).
The Building Blocks
More detailed examples will be provided during the initial sponsor meeting about the following components of an entitlement management system:
- Kit – The kit is the layer of the architecture that executes the actual provisioning to the entitlement.
- Enterprise – enterprise business rules to provision to this entitlement (for example, a user cannot be provisioned to a system resource until a related training course is completed; a user cannot be provisioned to any system resource until a non-disclosure agreement is signed by their company)
- Application – application business rules to provision to this entitlement
- API – API or workflow to provision to this entitlement
- Package – The package is a collection of kits created by a business user for a specific role on an engagement. The package becomes the assignment to a given role on a project (for example: project manager, bench chemist, biologist, manager, etc.). The Package becomes the container for the metadata necessary to provision to the kits.
- Business Engagement – The Business engagement is the collection of the packages and metadata about the engagement pertinent to both provisioning and compliance.
- Engagement details (Business Area, Business Owner, Authorized provisioners both employee and delegate, duration, etc..)
- Engagement roles (roles are assigned to package templates and adjusted based on need)
- Engagement rules (things like do not adjust history, or adjust going forward, or do not adjust provisioning based on metadata changes. Or a flag for don’t provision until engagement start date, what to do on engagement end date)
- Entitlements data lake – This is the authoritative source of all provision activity
- Workflow engine – This is a comprehensive workflow engine that will manage entitlement events to their conclusion.
- Rules engine – a way to easily build rules that can be executed as code
We envision a few interfaces to this application:
- Application Owners would build the kits for their entitlements
- Enterprise governance would own the enterprise rules creation for the kits
- Engagement leads would assemble the kits into packages as the role of the engagement became clear
- Engagement Owners would build the engagements
- Provisioning Delegates would provision users to the engagement and assign them to
Background and Problem Statement
Have you been finding yourself putting together lots of jigsaw puzzles lately?
A common strategy applied to put together jigsaw puzzles is to form the edges of the puzzle first. Finding all the 'straight edge' pieces just to create the border can be challenging! They can really get lost in those large 1000+ puzzles. Even after touching every piece, it’s easy to struggle to find edge pieces.
Project Description
We would like students to create an augmented reality mobile app that can help users find straight edges in puzzle pieces through the mobile device’s camera. Once a straight edge piece is found, the camera view can highlight identified pieces with some visual indication, such as by lighting up the pieces’ outline.
Beyond finding edge pieces, perhaps this app could also capture a scan of an open piece on the board that has all four sides in place (easy to find) to maybe just one open side (difficult). These open slots could be scanned and locked in and then compared to the available pieces to find possible fits. This could be based on the unique outline of the piece, but might also include visual features to increase the probability of a match.
Technologies and Other Constraints
Students are welcomed and encouraged to find and use the appropriate technologies to solve this problem!
STUDENTS WILL BE REQUIRED TO SIGN OVER IP TO SPONSOR WHEN THE TEAM IS FORMED.
Background
XVIII Airborne Corps rapidly deploys ready Army forces in response to crisis (manmade or natural) or contingency operations anywhere in the world by air, land or sea, entering forcibly if necessary, to shape, deter, fight, win, and successfully resolve crisis. The Corps headquarters provides mission command as an Army, Joint or Combined Task Force headquarters.
The XVIII Airborne Corps is “America’s Contingency Corps” and Fort Bragg is the home of the Army’s Airborne and Special Operations Forces. When America needs her armed forces in a hurry, the first phone calls come to us. The Corps, the Army’s strategic response force, is skilled, tough and ready around the clock to deploy, fight, win and successfully resolve crisis. Fort Bragg is the Army’s flagship power projection platform that provides world-class support to America’s Airborne and Special Operations warriors and their Families.
Problem Statement
How does the XVIII Airborne Corps deploy at a moment’s notice anywhere in the world with enough relevant social context to rapidly gain and maintain positive and effective influence that shapes perceptions on the ground and ensures mission success?
The XVIII Airborne Corps’ mission is to deploy troops to unstable and hazardous areas within hours of notice. Because of the quick response nature of this mission, it is critically important for the division to be able to have as in-depth of an understanding of the deployment zones. Such understanding is multifaceted including: weather and climate, geographical, political, economic, and social considerations. While well-established systems abound for most of these issue areas, determining the social climate is increasingly complex in a world dominated by the relentless pace of social media. For small conflicts, this can even break down to the microscopic level of determining the beliefs, positions, and attitudes toward certain topics in specific social circles. Additionally, unlike the geography of the area which mostly changes at a glacial cadence, social mood and structures are extremely dynamic. Capturing this social climate is incredibly powerful information for administrators and soldiers to have as they respond to crisis.
Project
Develop a web-based application to provide both a list-based and geographical view of prevailing social sentiment/concerns, influencers, conduits, and mediums (i.e. social media posts) within a given geographic region. Such tweets and markers should be annotated with emotional and sentiment text analysis. Initially, the project shall take in a list of accounts to follow, the system should search for additional accounts based upon social networks and geographic regions. The system should utilize automated text translation services to convert foreign languages into English.
Requirements:
- Sentiment analysis
- Local concerns
- Key influencers (these may shift from peacetime to crisis)
- government and non-government
- segmented by topic/issue
- segmented by demographic
- Conduits
- Mediums (Apps, etc)
About ISE
Our current project which is in collaboration with Intel, and sponsored by the National Science Foundation, seeks to develop tools to support the management of new product introduction in high-tech industries. This involves the collaboration of multiple autonomous engineering and manufacturing groups. The project seeks to construct a role-playing game environment to help both researchers and practitioners understand the complexities of the problem, and the importance of collaboration to an effective solution.
Background and Problem Statement
The two principal organizational units involved in new product introductions in high tech firms, such as semiconductor manufacturers, are the Manufacturing (MFG) unit and a number of Product Engineering (ENG) units. Each Product Engineering unit is charged with developing new products for a different market segment, such as microprocessors, memory, mobile etc. The Manufacturing unit receives demand forecasts from the Sales organization, and is charged with producing devices to meet demand in a timely manner. The primary constraint on the Manufacturing unit is limited production capacity; no more than a specified number of devices of all sorts can be manufactured in a given month. The Product Engineering units have limited development resources in the form of computing capability (for circuit simulation) and number of skilled engineers to carry out design work. Each of these constraints can, to a first approximation, be expressed as a limited number of hours of each resource available in a given month.
The Product Engineering groups design new products based on requests from their Sales group. The first phase of this process takes place in design space, beginning with transistor layout and culminating in full product simulation. The second phase, post-silicon validation, is initiated by a request to Manufacturing to build a number of hardware prototypes. Once Manufacturing delivers these prototypes, the Engineering group can begin testing. This usually results in bug detection and design repair, followed by a second request to Manufacturing for prototypes of the improved design. Two cycles of prototype testing, bug detection and design repair are usually enough to initiate high-volume production of the new product. Especially complex products or those containing new technology may require more than two cycles.
The Manufacturing and Product Engineering groups are thus mutually dependent. capacity allocated by Manufacturing to prototypes for the Product Engineering groups consumes capacity that could be used for revenue-generating products, reducing short-term revenue. On the other hand, if the development of new products is delayed by lack of access to capacity for prototype fabrication, new products will not complete development on time, leaving the firm without saleable products and vulnerable to competition.
Project Description
We seek the development of an educational computer game where students assume the roles of MFG or ENG managers to make resource allocation decisions. The initial module of the game would focus on a single MFG and ENG units. Resource allocation decisions will be made manually, giving the players of the game a feel for the unanticipated effects of seemingly obvious decisions.
The game will have one MFG player, and can have multiple ENG players, with each player trying to maximize their own objective function. We shall assume for sake of exposition one player of each type, and a given number of time periods T in which each player must make its resource allocation decisions.
Lots of variations are possible, and we would like to leave the maximum flexibility to enhance the game by adding more sophisticated procedures. Our NSF research is looking at auction procedures that use resource prices obtained from approximate solutions to optimization models by each player - a price-based coordination solution. So, we would ideally like to be able to use this game engine to simulate the solutions we get from our auction procedures and compare them to the solutions obtained by players making decisions manually.
Technologies and other constraints
We have had two previous groups working on this, and they have both elected to use web-based platforms which is fine with us; we would prefer the current group build on what the previous groups have done so the base product can be enhanced and developed to add new functionality, especially unpredictable events such as unforeseen development or manufacturing problems.
Web-based to build on previous work, and provide maximum flexibility to users.
About Katabasis
Katabasis, Inc. is a non-profit organization that specializes in developing educational software for children ages 8-15. Our mission is to facilitate learning, inspire curiosity, and catalyze growth in every member of our community by building a digital learning ecosystem that adapts to the individual, fosters collaboration, and cultivates a mindset of growth and reflection.
Background and Problem Statement
The modern education system trains us to break down problems into small pieces and form cause and effect relationships. If we rely exclusively on this approach we risk losing the insights from considering the whole system (an approach called systems thinking). The focus of system thinking is that “the whole is greater than the sum of its parts” and that a system’s structure can provide additional insights about its behavior over time.
Katabasis would like to introduce middle school-aged students to concepts in systems thinking via an educational game that simulates the spread of an infectious disease through a population. By exploring a topic that’s relevant to the students' lives, we hope to increase engagement with the material and promote healthy behaviors.
Last semester, an initial version of this game was created using the Unity game engine. It includes a basic city layout, a government policy system, and intricate citizen behaviour (responding to personal needs and deciding on tasks). While these systems have laid the foundation of the game, it is still missing a few core features we would like to see added this semester by Senior Design. In particular, we would like to see logging of player actions and the game state, and the ability for players and potential modders to create their own city layouts. Additionally, we would like to have the ability to generate new levels in the game using procedural content generation, giving students more cities to reflect over and deepen their understanding of the complex systems at play.
The game, though it deals with infectious diseases, is most similar to turn based and real-time strategy games that have a heavy emphasis on managing large groups of people. The Civilization game series and the Tycoon game series are well-known series that have similar mechanics. Building off of work completed by the fall 2020 Senior Design team, this project will be focused on the refinement of the existing game and the addition of a logging system, a city builder function, and procedural generation of levels.
This product will be serving many audiences, in particular, middle school students and education researchers. For the middle schoolers, it will provide them with an engaging learning opportunity and promote healthy behaviors. They will be able to use trial and error to experiment with the learning concepts and see for themselves what does and does not slow the spread of the disease. This will help them understand all the factors that create the complexities of the system of public health, and apply it to their lives.
For education researchers, this system will serve as a platform to create levels which can help them verify hypotheses which could be answered using this simulation. One such hypothesis could be that students will use personal protective equipment (PPE, like masks) more readily in their lives if they first see the effects of quarantining and then do levels that allow less drastic protective measures (like using PPE).
Project Description
This semester, the project team will focus on creating an action logging system and a city building feature to allow for students and academic researchers to create custom scenarios within the game. The action logging system would keep track of all the actions players take during the course of the game, to better facilitate the learning process after the fact, as well as provide some useful post-play data to the player and any other interested parties (teacher, researcher, etc.). The city building feature will allow users to add or remove various buildings on an isometric grid.
To enhance the replayability of the game, the Senior Design team will also be asked to create procedurally generated cities so that middle schoolers have virtually unlimited environments to test their containment strategies. It would also be desirable that new levels attempt to elicit new strategies from the students, to help students experiment with new policies and think more deeply about how different cities necessitate different approaches. We would want this to be the last feature worked on (after logging and city building) to make sure that the project stays within scope and time constraints.
User Experience Focus. We would like students on this team to conduct two think-aloud sessions online with middle school students. Katabasis will supply the middle school testers. The first think-aloud session would ideally be the midpoint of the course (upon completion of the logging and city building features), with the second think-aloud session happening towards the end of the course (once procedural content generation has been implemented). The think-aloud session is intended to solicit player feedback that will be used to inform improvements to the game, UI, and generate ideas for policies and buildings. We value this feedback very highly, and as such would like to see that the team takes it into account in their development of the game. Senior Design students will work with Katabasis team members to select additional features to incorporate over the second half of the project, in response to personal impressions and feedback from the sessions. The second user feedback event will be held at the end of the project (same format as first event) and the Senior Design team will include, as part of their final deliverables, documentation of suggested next steps in the development of the game.
Accuracy to real life data is not the goal but high level trends over time should be representative of what infectious diseases could do in the simulated environment. Our goal is to keep it similar enough to real-life to be identifiable and relatable, but dissimilar enough when needed to facilitate the gameplay or learning experience. Katabasis welcomes any input from the Senior Design students in the development of educational content, user feedback surveys, user agreement forms, etc. but to keep the project within scope we will head up this work ourselves.
Technologies and other constraints
The game is implemented using the Unity Game Engine in C#. The target platform is the web browser (using Unity’s WebGL Export), but would like to make it mobile-accessible if time permits. We will likely be asking our team to conform to a premade testing environment and to develop some robust tests for the new features they add.
Upon the completion of the project, the system will be hosted on Katabasis.org, and accessible to middle school students and education researchers. The associated Senior Design students' efforts will be acknowledged in the game credits, if desired.
STUDENTS WILL BE REQUIRED TO SIGN OVER IP TO SPONSOR WHEN THE TEAM IS FORMED.
LexisNexis® InterAction® is a flexible and uniquely designed CRM platform that drives business development, marketing, and increased client satisfaction for legal and professional services firms. InterAction provides features and functionality that dramatically improve the tracking and mapping of the firm’s key relationships – who knows whom, areas of expertise, up-to-date case work and litigation – and makes this information actionable through marketing automation, opportunity management, client meeting and activity management, matter and engagement tracking, referral management, and relationship-based business development.
One of the main value proposition of Customer Relationship Management (CRM) systems is giving insights into relationships a company has with its customers. Often, when employees are looking to make new inroads with a customer, they need to know anyone at their company that knows anyone at the customer's company. There are also other constraints in play, like looking for the strongest relationship or relationships to specific personnel. If no one is known at the customer's company then the query may expand to include alumni of the customer who could make introductions.
InterAction is currently built on a relational database which is not well suited to queries that more akin to graph queries in nature. As such, we are looking to investigate embedding a graph database (or something similar) into one of our components. We would vet the feasibility by testing the performance of queries, such as the who knows whom query mentioned above.
About Outer Banks Blue Realty Services
Outer Banks Blue is a vacation rental management company representing approximately 300 properties located on the northern outer banks of North Carolina that has been in business since 2005. Sandbridge Blue, established in 2010, manages the rentals for approximately 80 properties in the Sandbridge, Virginia area.
Background and Problem Statement
In 2018, a laundry operation was started in Elizabeth City, NC to wash the sheets and towels that are provided with each rental property. The laundry plant puts together packout bags, which contain clean sets of sheets and towels customized for each property’s needs, to be delivered to each property every time there is a departure. Each bag typically contains a mix of sheet sets and towels such that the weight of a single bag is no more than 40 lbs. Properties may require anywhere from 2 to 8 bags depending on the size of the property. Different towel types included are bath towels, hand towels, bathmats, and washcloths.
Packout bags are put together at the laundry plant based on the information provided by each of the delivery locations (Sandbridge and Kitty Hawk) in sticker sheets. Employees in the laundry plant print out these stickers (Avery 5160 size) to label each packout bag indicating its contents and the property to which it should be delivered. During the summer, one delivery day may involve 400+ packout bags. To organize these, a set of tags is created to label laundry bins (5x7 cardstock), where bags are grouped by cleaner (cleaning crews that have less than 10 bags are grouped together). The laundry bin stickers include information about all the properties that packout bags in it are for.
Currently, sticker sheets are created weekly through a manual and error-prone process that involves pulling information from several places (spreadsheets, our reservation system, emails, and others) into a Word document. If any last minute arrivals are scheduled, an email or text is sent to the laundry facility and stickers are manually made up. Another large opportunity for error comes by property owners changing their bedding configuration (for example, changing out a queen bed for bunk beds) and sticker sheets not being updated accordingly. When mistakes are made, packout bags may be delivered with the wrong contents, causing delays and extra work for our employees.
In addition, if any ancillary materials are needed (welcome bags, paper towels, soap, etc.) the individual delivery locations (Sandbridge and Kitty Hawk) would request these be added to packout bag delivery via email to the laundry plant, which makes it hard to track inventory and do proper billing.
Project Description
We have a property management system that we use to manage reservations. For this project, we would like to create a new and separate system for personnel of the laundry operation and the housekeeping teams in Kitty Hawk and Sandbridge to manage the creation of packout bags and their corresponding bag and bin labels. This includes the ability to configure the items in packouts (sheet sets and towels) for each property as well as the list of ancillary items. The system should allow employees of the laundry operation to print out labels for bags and bins.
To support this process, the system should also keep track of the properties at each location and their needs (types of sheets and towels used). More specifically, we are requesting the following features:
- Support for multiple locations (Outer Banks and Sandbridge) containing different properties
- Support for different types of users: overall administrators, employees of the laundry plant, and employees of the housekeeping teams at each location. This includes having different levels of access to the features described here.
- Ability for housekeeping staff to order packout bags on a particular delivery date for a property
- Ability to update properties by importing a file out of our property management system and/or manually.
- Ability to configure a property to specify the number of floors/levels and sheet and towel requirements for each floor in the property.
- Ability to add on extra items (Bath Towels, Hand Towels, or Pool Towels) to individual properties on a specific delivery without altering the configured sets of items for that property.
- Ability for the locations to order ancillary items (with quantities).
- Ability to configure the types of sheets and towels available from the laundry facility, including the expected weight of each item.
- Ability for the laundry facility to keep track of an inventory of ancillary items available
- Ability to assign a local cleaner to a property
- Ability to produce the packout and bin stickers into an easily understood format (Avery labels 5160) grouped by cleaner assigned. Target weight of each bag is 30 lbs, so if a property’s configuration exceeds this weight multiple bags should be created. Separate bags, and their corresponding stickers, should be created for different floors on a property.
- Email notification/confirmation to appropriate personnel (with the ability to change who those are) when ancillary items are ordered for a property.
Although this should be a standalone system, we invite students to explore the APIs exposed by our property management system to see if there are opportunities for automation, such as triggering an update of a property when it is modified in the property management system, or placing an order for a packout on a property based on a reservation being made.
Technologies and other constraints
The system should be web-based so that it can be accessible from multiple locations simultaneously with a centralized database.
We are flexible on the specific technology stack used for this project as long as it’s compatible with our infrastructure.
STUDENTS WILL BE REQUIRED TO SIGN OVER IP TO SPONSOR WHEN THE TEAM IS FORMED.
About PRA Health Sciences
PRA Health Sciences provides innovative drug development solutions across all phases and therapeutic areas. PRA Health Sciences Cybersecurity Team is a small group of professionals that share a passion for the topic. Our team is excited to cooperate with NCSU students on the fourth project to further develop the RePlay Honeypots.
Background and Problem Statement
Honeypots are systems that behave like production systems but have less attack surface, less resource requirements, and are designed to capture information about how potential attackers interact with it. Their intent is to trick an adversary with network access to believe that they are a real system with potentially valuable information on it. The adversary’s effort to break into the honeypot can reveal a lot of information about the adversary and enable defenders to detect and gain an advantage on this threat, so the honeypot will log the attacker’s behavior.
Previous Senior Design teams have developed Replay Honeypots--a low-interaction production honeypot system that can be configured and deployed easily, remaining cost effective in large numbers. The system is architected around three main components: 1) a central management system that provides a way to monitor and control honeypots and serves as a central repository of data collected by each honeypot it controls; 2) a series of lightweight, secured honeypot that supports various methods of deployment and will simulate network behavior of other systems; 3) a configuration generation tool that will ingest packet capture (PCAP) and Nmap scan outputs, and generates configuration files that honeypots use to determine how they should behave. The Project has recently been released as an Open Source Project on GitHub and the team will actively contribute.
While this system has come a long way, there are still some areas for improvement:
- The current implementation of the Config Generations Tool requires the user to copy the output JSON and paste it into a frontend page. This process would be more streamlined if tools could connect and insert into a database directly.
- The current implementation of the honeypots gets a request, checks it against the request in the configuration and determines if it passes the similarity threshold, and if it does, it then responds with a predetermined byte sequence from the config. However, some packets might contain information such as timestamps or random values that would give the honeypot away on closer inspection.
- The current system doesn’t have the ability to mimic Telnet, SSH, SMTP and RDP
Project Description
For this project, we would like the following enhancements to be implemented.
Central Management System
Here is where users create, view/monitor, and modify honeypot configurations. In Phase 4 the following features are requested:
Device Management / Monitoring:
- Remediate Vulnerability: A recent Server-Side Request Forgery vulnerability was released regarding the Axios package (CVE-2020-28168). In order to remediate this vulnerability, the system shall upgrade the axios package to a version >= 0.21.1.
- Device Grouping: The system shall allow for the “summary & details” views to only present data from a given device group
- Health Metrics: The system shall allow for displaying supported health metrics on the frontend for each device & device groups.
Honeypots
The initial configuration of a honeypot is based on an Nmap scan of another system that the honeypot must attempt to replicate. With this input, the honeypot configures its simulated services so that an Nmap scan to the honeypot produces no detectable differences from the original system, while having as little attack surfaces as possible. In Phase 4 we would like to make our honeypots more believable as follows:
- The system shall provide functionalities to mimic popular communications protocols if enabled in the configuration (Telnet, SSH, SMTP, RDP).
- The system shall have the ability to use a conventional device fingerprint to completely copy the network/interface of a target
- The system shall provide the ability to use the captured data to modify the way the device builds packets, calculate fields in headers, and responds to specific traffic.
- Fix any issues/bugs that are found
- STRETCH GOAL: The system shall provide full SSH honeypot functionality
- The system shall provide the ability to harvest credentials
- The new functionality shall integrate with current Replay functionality
- The system shall fake SSH and telnet connection to another system
- The system shall log sessions and store in a UML compatible format for easy replay
- The system shall provide SFTP and SCP support for file upload
- The system shall save files downloaded with wget/curl or uploaded with SFTP and SCP for later inspection
- The system should allow for JSON logging
- The system may use cowrie as a basis
- STRETCH GOAL: The system shall have the ability to capture malware for future analysis
- The system shall trap malware exploiting vulnerabilities in a format that the malware cannot execute
Config Generation Tool
The Config Generation Tool is a standalone tool that will ingest packet capture of a system that has undergone a Nmap scan and the respective scan results and generate a configuration file for the Honeypots that can be imported. In Phase 4 the following features are requested:
- The config generation tool shall connect to and insert configs into the database directly, rather than the user having to copy the output JSON and paste it into a frontend.
- The system shall provide the ability to mimic operating systems and networking equipment using the newly requested fingerprint functionality
Technologies and other constraints
Python3, NodeJS and VueJS are preferred development languages, the TRIO library is recommended for multi-threading. Docker is currently used to easily manage and deploy honeypots and will remain the preferred solution for this phase. Nevertheless, all functionality of the Honeypot itself needs to be supported and tested on Linux without Dockers. CouchDB is the currently supported Database. Technology pivots are possible but need discussion with the Sponsors.
Each component of the system will be designed with large scale deployments (>100) in mind. Students should use best practices for the development of secure software and document in great detail. Students should also strive to design honeypots to be modular so that additional protocols can be introduced, and additional functionality can be created, e.g. RDP, SSH, SMB Honeypots, Honey Websites and active beaconing. This Project is published on GitHub and the Students will be required to follow GitHub processes and best practices.
Students working on this project will be most successful if they have a strong understanding of network principles such as the OSI Model. Prior successful participation in “CSC 405 – Computer Security” and “CSC 474 – Network Security” is recommended for this project. Previous experience with Nmap and OS configuration is an advantage.
STUDENTS WILL BE REQUIRED TO SIGN OVER IP TO SPONSOR WHEN THE TEAM IS FORMED.
Background and Problem Statement
PuzzleScript is both a language and an open-source game engine to create 2-D puzzle games. A single PuzzleScript file defines a whole game, including assets, rules, and levels. PuzzleScript games are written and saved in a browser-based editor (https://www.puzzlescript.net/editor.html) that includes features such as syntax highlighting, saving and loading from libraries, running the game, a level editor, a sound library, an output debug console, and the ability to export the current game as a standalone html file.
Although the PuzzleScript editor works well enough, it lacks more advanced editing features that are now standard in modern code editors like Visual Studio Code, such as code completion, version control integration, find and replace, and the ability to open/save local files.
Project Description
In this project you will create a PuzzleScript extension for Visual Studio Code that should provide and enhance most of the features of the web-based editor. Leveraging the existing PuzzleScript runtime is welcome. At a minimum, this extension should support:
- Creating new PuzzleScript files with a blank/template structure. This is similar to what the web editor does when creating a new game.
- Syntax highlighting. The extension “.pzls” is suggested for PuzzleScript files. You can get inspiration from the current color scheme in the PuzzleScript editor, but creating a new color scheme is okay, especially to support dark/light modes and other VS Code themes.
- Code hinting and completion
- Game preview (similar to how VS Code does Markdown preview)
- Level editor. As the web editor does, placing the cursor on a level and opening the editor will edit that level.
- PuzzleScript console output
- Exporting a game as a standalone HTML
Many of these features are already provided and implemented in the PuzzleScript codebase and will need just integration into an extension. Although this normally works by default, you should verify that these features work well with VS Code’s standard functionality, such as Git integration and common extensions such as Live Share.
As time permits, there are additional desired features that include:
- More robust (semantic) code completion and hinting. For example, suggest and complete game object variables created earlier in the file in addition to just language constructs.
- Sound preview. PuzzleScript sounds are represented as numbers. It will be ideal to play the sound by clicking (with a modifier key) on this number.
- Sound library support. The PuzzleScript editor has a series of buttons to loop through different sounds by type (explosion, powerup, pushing, coin, etc.). Incorporating this into a popup view (similar to what VS Code does when choosing a hex color) is ideal.
- Ability to publish a game to PuzzleScript.net (share via GitHub) from VS Code.
- Ability to update your published game in PuzzleScript.net from VS Code.
Technologies and other constraints
You will be using Visual Studio Code and its Extensions API. VS Code extensions are usually written in TypeScript. PuzzleScript itself is written in JavaScript and its sources are available on GitHub.
About Strategic Interaction Video
Strategic Interaction Video (SIV) is an upcoming online, pre-recorded video-based learning platform. The most innovative feature of SIV is that, unlike traditional e-learning technologies, SIV allows learners to interrupt the prerecorded video instructor at any point during a lecture to ask a lecture-related question, receive an appropriate pre-recorded response, then resume the lecture at the point of interruption.
Background and Problem Statement
The current SIV prototype allows learners to log in and see a list of courses (sometimes called trainings) available to them. A Learner can select a course of study and proceed to watch associated videos. This includes asking questions and getting responses. Some materials can also present multiple-choice questions to a learner to assess understanding of the material. An initial survey is used to customize the videos that are shown to an individual learner’s circumstance.
The structure of an SIV course is represented internally as a JSON-encoded directed graph structure. The nodes of this graph represent the content that is presented (survey, content videos, learning assessments), while the edges connect the content in the expected order. To create a more dynamic experience, some nodes can have multiple outgoing edges that customize the overall content of the course to a particular learner. An outgoing edge is chosen if a learner satisfies a specified logical condition assigned to that edge, such as providing a specific answer to a survey or failing to answer an assessment question correctly.
Currently, a database exists to keep track of all videos and the graph structure. However, manual edits to this database are required to make any changes to existing course videos, or to add new ones.
Project Description
For this project, you are tasked with creating an administrative interface for the SIV prototype to allow SIV admins to create new users, and manage course content. Some support for this implementation already exists in the back-end as part of the API and can be used as a starting point to complete the requested features. A database is already in place to support this functionality. Specifically the features requested are the following:
- Add/edit/remove learners and admins that will have access to the system. This includes the ability for users to validate their accounts and reset their passwords with email confirmation.
- Create and manage a course
- Upload new videos for a course, specifying the type of video (content video, answer to a FAQ, response to a learner assessment)
- Manage FAQs. These are text-based questions that have a corresponding video response. Each FAQ can then optionally be assigned one or more content videos as a FAQ for that material.
- Create and manage the graph structure for a course, including specifying dynamic conditionals for outgoing edges. An old early version of this exists (written in Angular) and can be used as a reference.
- Manage assignments of courses to learners.
Most of the supporting structure is in place to add these features already, and students will be given complete access to the existing codebase.
Technologies and Other Constraints
The current SIV prototype has a React front-end that communicates with a PHP REST API built on the Slim Framework with a Python AI/NLP Q&A component powered by Flask. Both systems rely on a centralized MySQL/MariaDB database.
To help you get started, in addition to source code we will give you a populated database and video materials for a sample SIV course.
STUDENTS WILL BE REQUIRED TO SIGN OVER IP TO SPONSOR WHEN TEAM IS FORMED.
About Strategic Interaction Video
Strategic Interaction Video (SIV) is an upcoming online, pre-recorded video-based learning platform. The most innovative feature of SIV is that, unlike traditional e-learning technologies, SIV allows learners to interrupt the prerecorded video instructor at any point during a lecture to ask a lecture-related question, receive an appropriate pre-recorded response, then resume the lecture at the point of interruption.
Background and Problem Statement
The current SIV prototype allows learners to log in and see a list of courses (sometimes called trainings) available to them. A Learner can select a course of study and proceed to watch associated lectures. This includes asking questions and getting responses. Some lectures can also present multiple-choice questions to a learner to assess understanding of the material. An initial survey is used to customize the videos that are shown to an individual learner’s circumstance.
The current system is not set up to track learner progress, so every time a learner opens a course, they have to start over. It is also currently not possible for instructors to see how much their learners have progressed or how they have performed in the course.
Project Description
For this project, you are tasked with extending the SIV system to keep track of learner progress and to record and display analytics of individual learners as well as aggregate analytics for all the learners that have participated in a course. We would like to track learners as follows:
- Record learner events, such as opening a course, opening a video, “scrubbing” through a video, completing a video, and so on.
- Keep track of where in a course a learner is, so they can resume instruction later without losing progress.
- Record learner answers to survey and assessment questions, and compute a score for correctness as appropriate. This can be a percentage of correct answers out of all questions in a course, and/or a percentage of correct answers to just the questions that the learner has seen so far.
- Optionally, and if time permits, logging other events like users logging in/out of the system or navigating the website would be useful.
Instructors also need a way to consume these metrics. For this, we would like the system to have a dashboard where instructors can see how their learners are progressing through a course, both for an individual learner as well as for a whole class in aggregate. Some of these metrics are more easily visualized in tabular form while others can benefit from being represented graphically. Students are invited to suggest creative ways to visualize these data.
Technologies and Other Constraints
The current SIV prototype has a React front-end that communicates with a PHP REST API built on the Slim Framework with a Python AI/NLP component powered by Flask. Both systems rely on a centralized MySQL/MariaDB database.
To help you get started, in addition to source code we will give you a populated database and video materials for a sample training.
STUDENTS WILL BE REQUIRED TO SIGN OVER IP TO SPONSOR WHEN TEAM IS FORMED.
Background and Problem Statement
Since the 1980’s many heuristics and algorithms have been proposed for drawing layered graphs, which depict hierarchical structures with nodes at the same hierarchy drawn horizontally and directed edges layered vertically toward other layers in the hierarchy. These drawings are one step in a process that can be used to draw any graph. Most research has focused on minimizing the number of edge crossings. More recent work has considered the bottleneck problem (minimizing the maximum number of crossings among all edges), minimizing total (or bottleneck) length of edges in the drawing, and verticality (minimizing the degree to which edges deviate from being vertical).
We have created a general purpose tool for writing animations of graph algorithms, called Galant (Graph algorithm animation tool). More than 50 algorithms have been implemented using Galant, both for classroom use and for research. Among these are heuristics for layered graphs.
Perhaps the primary advantage of Galant is the ease of developing new animations using its own language that looks very much like pseudocode. An animator can also add Java code if Galant’s built-in functionality proves inadequate. The layered graph implementations in particular are written in separate Java classes that are imported seamlessly into Galant. The Galant compiler translates Galant code directly into Java and passes it along to the Java compiler, so any legal Java code can be added.
Project description
Dr. Stallmann is developing (or has developed) new heuristics for most of the layered graph problems and would like these to be animated as an aid to the research and to produce illustrations for publications and live demos. To that end, the following issues need to be addressed.
- Develop better integration of layered graphs with Galant. The current implementation treats them as a special case and has multiple instances of code along the lines of “if this graph is layered then do x else do the usual”.
- One way to address the previous point would also address another issue: parts of graphs that do not fit into the display window are cut off. One way to deal with this is to scale the drawing so that it fits the window. This is already done for layered graphs, but not in the most straightforward fashion.
- A user may at any point, while editing a graph or running an animation, move nodes. This is not possible with layered graphs (and should be, so that a user can explore alternate layouts).
More possibilities. Additional research-related work is underway and could become part of the project.
- Experiments with layered graph heuristics and algorithms. This includes experimental analysis of heuristics directed at various objectives and exploration of Pareto optima. Several heuristics for the bottleneck problem were proposed by others after Dr. Stallmann’s original paper. Implementations have been posted on github but have not been analyzed rigorously or adapted to other problems (e.g., Pareto optimization).
- Experiments with an algorithm for the independent dominating set problem and supporting animations. A C++ implementation exists but will require enhancements to be competitive with, e.g., CPLEX.
The focus and scope of the project will be negotiated with the team.
Technologies and Other Constraints
Galant is a desktop application written in Java that supports graph inputs in graphml format.
Background and Problem Statement
University faculty interact with students in many different capacities. It is very common for a student to take multiple courses with the same instructor, sometimes in consecutive semesters and sometimes with many in between. With classes of 100+ students being common, especially on required courses, it can be difficult for instructors to remember exactly when and in what context they encountered a student before.
While instructors can generally remember previous students and salient interactions, memory can be unreliable. This is particularly problematic, for example, when students decide to apply to graduate school and request a letter of recommendation from their instructors. The problem is even greater when the request comes several years after the student has graduated, resulting in the instructor having to spend a significant amount of time and effort digging up as much information as possible from past emails, archived class materials and other resources in order to write a good letter of recommendation. Even after much digging, the instructor may not be able to find enough information to substantiate the strong letter of recommendation that the student really deserved.
Project Description
The main goal of this project is to create a progressive web-based application (PWA) for faculty to keep a centralized and cross-referenced record of student interactions. There can be many different types of interactions such as students in courses the instructor has taught, students in clubs the instructor may lead, students in the instructor’s research lab, or students who may have TAd for the instructor.
Users can add interaction groupings of different types, such as courses, labs, activities, and so on. Faculty should then be able to upload a CSV file with student data into a grouping, but manually adding/editing/deleting individual students should also be possible. For courses, the system should support uploading and parsing a “Photo Roster” PDF exported from MyPack. The photos in the PDF should also be stored and displayed in the system for each student. Courses can also optionally keep track of TAs and graders, so the system should support having different types of students in a grouping based on the roles they had.
Student groupings should support being associated with a specific period. For example, the instructor should be able to create a grouping called “Reading Group” that may or may not be associated with a period (e.g., “Spring 2021”), and then manually add or delete students in this group.
The system shall support instructor notes and files associated with a particular student in a particular interaction grouping (e.g., a note for a specific student in a specific course in a specific semester). Notes can have files associated with them, but individual files and individual notes should also be supported. The idea is to allow the instructor to quickly capture information relevant to that one student in a particular context.
There should be views, and the ability to search, by student (name, student ID, email), course/grouping, and semester (period, year). When viewing a student, the system should indicate how many and which interactions the instructor has had with them. When viewing the list of students on a grouping, each student row should display information about other interactions (e.g., how many past courses) and provide the ability to expand those interactions for more details.
Since this information is sensitive, authentication is required and an instructor will only have access to their own content they upload. However, the system shall support multiple instructor accounts. While the primary target of this system is NCSU faculty, the system should be made with support for other, and multiple, institutions in mind.
Once the core of the system is implemented there are many opportunities for additional features. Some examples include:
- A custom browser extension that will automatically parse and download MyPack roster data for a course, including student photos if available.
- A data export module to download custom subsets of student data in CSV, JSON, SQL, etc.
- A desktop version of this Web App running on Electron.
Technologies and other constraints
The front-end should be written in React (students can choose between JS or TS), and should interface with a REST back-end that can be written in either PHP (using the Slim Framework), Python (using Flask), or NodeJS.
Authentication should support SAML2 with Shibboleth and at least one other auth provider, as well as local accounts. Students can choose to use either PostgreSQL or MariaDB as database engines.
The browser extension should be compatible with Chrome, Edge, and Firefox using the WebExtensions API to the extent possible.
About the U.S. Army XVIII Airborne Corps
XVIII Airborne Corps is a rapidly deployable and ready Army organization that responds to crisis (manmade or natural) or contingency operations anywhere in the world by air, land or sea, entering forcibly if necessary, to shape, deter, fight, win, and successfully resolve crises. The Corps headquarters provides mission command as an Army, Joint or Combined Task Force headquarters.
The XVIII Airborne Corps is “America’s Contingency Corps” and Fort Bragg is the home of the Army’s Airborne and Special Operations Forces. When America needs her armed forces in a hurry, the first phone call comes to us. The Corps, the Army’s strategic response force, is skilled, tough and ready around the clock to deploy, fight, win and successfully resolve crises. Fort Bragg is the Army’s flagship power projection platform that provides world-class support to America’s Airborne and Special Operations warriors and their Families.
Background and Problem Statement
Artillery ranges provide practice facilities for live weapons firing, which is critical to keeping the military ready and prepared for global emergencies. As important, yet shared, resources, ranges would greatly benefit from an effective management platform to coordinate them.
The XVIII Airborne Corps would like to combine existing capabilities into an easy, flexible mobile application to improve artillery range utilization through ease of scheduling and extension of usage time, increase situational awareness, facilitate troop planning, and provide redundant communications capabilities. A capability that meets these needs would help soldiers, military contractors, and civilians easily search, reserve, and manage artillery range resources for garrison and training operations.
Project Description
Students on this project will develop a standalone application for Android, iOS, and web browsers. For this project, data sources will be static files or local databases. However, the application will eventually interface with Army systems of record to schedule artillery ranges, share data, and provide additional planning and preparation tools, so the design is expected to be flexible to accommodate this change in the future.
Key data elements for operation of the app and management of the ranges includes example data sources such as range list and GPS coordinates, searchable features that are specific to individual ranges, and calendar events that inform availability of the resource. Additionally, open source accessible information such as weather would complement and enhance this management capability.
Access and Availability: Three levels of access will give baseline users the ability to view scheduling as well as share information internally (messaging, mapping, weather, and certifications). Access will be granted by appointed system administrators.
At a minimum the application must have the following features.
- The application must be able to be used by both mobile and desktop systems. Priority for development is iOS, IE, Chrome, Android.
- Scheduling for ranges into a central booking authority. The authority is to be determined (automated vs. manual). Users will be able to set notifications and coordinate with Points of Contact associated with each range.
- Centralized data storage for certifications, range information, and reporting templates to include work orders, safety certifications, and range packets.
- Mapping function that interfaces with internal GPS, the ability to draw and add shapes to the map, and pull driving directions. Users must be able to share map feedback to increase situational awareness (road conditions, low water crossing status, etc).
- Ability to pull images from camera and submit with work orders, or drop into mapping.
- Messaging function to allow point to point as well as group communication. Range control, the central range authority, should be able to push mass notification through messaging.
- Profile settings to allow users to change information and update as needed.
Regular touchpoints and development meetings will be determined by the development team with the product managers (MAJ Adams / CW4 Masters).
About Barnes' Game2Learn Lab at NC State and BOTS
The Game2Learn Lab, directed by Dr. Tiffany Barnes, researches the impact of games and data-driven adaptation on learning through a number of innovative approaches. We build games and interactive tools for learning in math and computing, building social networks, promoting exercise, and visualizing interaction data from games and learning environments. Descriptions for our Game2Learn lab research and games projects can be found on the website, including a wide array of archived games. We are particularly motivated by finding ways to embed data-driven artificial intelligence and educational data mining techniques into game and learning environments to support learners and improve our understanding of learning. We investigate these data-driven techniques to support learning primarily in our Deep Thought logic tutor which provides adaptive feedback for constructing deductive logic proofs to students learning logic in CSC 226 (Maniktala, et al. 2020).
We have also developed a 3D block-based programming game, BOTS, where users program puzzle solutions to help navigate a team of robots through a maze (Hicks, et al. 2015; Hicks, 2016). BOTS was created by Dr. Andrew Hicks, NCSU alumni now working at Epic Games, to teach programming concepts (loops and functions) to novice programmers while investigating the usefulness of user-created levels. The goal of each level is for the player to program the BOTS to activate all switches using a minimal number of code command blocks. Levels can vary in difficulty by limiting the resources the players have to solve the puzzle, such as restricting the type of blocks available and the total number of blocks allowed (Hicks, 2016). The most recent BOTS code was written in Unity and is hosted on GitHub. Figure 1 shows a screenshot of the BOTS game, where the command blocks are available in the top right panel; the bottom right has the level with a red BOT, blue boxes the BOT can pick up and place, and yellow targets where either a BOT or a blue box must rest to solve the puzzle; the left sidebar has the BOT’s code, and the top left panel has play/pause buttons for running the code to see if it solves the level.
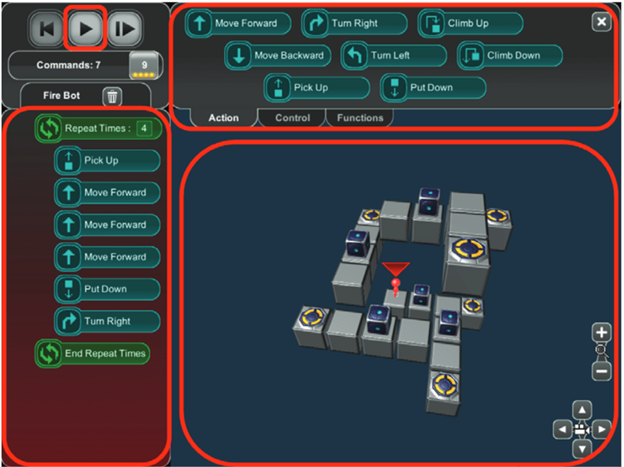
Figure 1: Image of BOTS UI in-game
Background and Problem Statement
Level generation in games allows for users to experience the same game without playing the same puzzles, providing increased replayability at a certain level of difficulty. Since BOTS is for novice programmers learning to program, replaying levels of the same difficulty benefits as practice for developing the novice’s programming problem-solving skills. Furthermore, a level generation system where the difficulty level can be specified will allow for automatic sequencing and selection of puzzles to optimize flow (the balance between easy and difficult that is just hard enough to be fun, but not so hard as to be impossible for the particular player). Updating BOTS allows for it to be played publicly by beginner programmers, accessible from our lab’s public website. Additionally, more research can be done using BOTS as future researchers would not need to rewrite the game, expediting contributions to making CS more accessible and fun. Details regarding technology and updated requirements are below.
Previously, PhD candidate Yihuan Dong created a JavaScript-based extension level generator for BOTS. This template-based puzzle generator accepts user-written templates specifying goal requirements for puzzles to produce puzzles that meet the user’s specifications as XML files that are read into the game. However, this generator did not allow one to specify level difficulty. We are hoping that the senior design team can take inspiration from this system, or design a new one, to generate levels in BOTS.
Design and Development Goals:
- Update BOTS to the most recent version of Unity
- Create a level generator (or modify the one created by Yihuan Dong) that allows a user to specify the difficulty level of a puzzle, or alternatively, to generate a level and assign it a difficulty score. Ideally, the level generator can be built within an admin dashboard for BOTS so that a designer can run the generator, see a level solution and/or play it themselves, see a level difficulty rating (and indicate whether they agree with the difficulty rating, whether they think it’s just right, too high, or too low, and write out why if desired), and then decide to re-run the generator, or choose to save and use the generated level.
- The Senior Design team could further, if desired and possible, develop a way to keep track of player performance, and generate a tailored sequence of levels to optimize difficulty for an individual player.
- Add a cooperative gameplay mode where two BOTS are needed to solve the puzzle, and two or more players can program their own BOTS.
Project Description
Before we can research what makes a BOTS level more difficult, BOTS needs to be updated from Unity version 4.6 to 2019.4. Major changes between these versions include switching the scripting language from UnityScript to C#, and loss of support for some existing asset files. Students will need to translate scripts for the BOTS game and replace assets of the game that are no longer supported by Unity. Upon updating BOTS and its level generator, students are to modify the existing level generator or create a new one capable of producing puzzles of specified difficulties consistently. They are also requested to implement multiplayer functionality for simultaneous cooperative gameplay. Modifications to the UI should include a way to create or join multiplayer games as well as communicate with other players. Students should develop unit tests to ensure the new system works, as well as recruit additional users (students, family, friends) to test the game to allow for at least one round of testing/debugging and final revisions.
PhD student Dave Bell in the Game2Learn lab will serve as the project mentor. With supervision by Dr. Barnes, Dave will be researching factors that affect difficulty for BOTS puzzles, and will make suggestions and provide feedback for the level generator created by the design team. Any relevant research data will be given to the students to modify the new level generator accordingly. For example, puzzles with solutions that use more computer science concepts or require more code may be rated as more difficult than puzzles that use fewer concepts and require less code for their solutions.
Technologies and Other Constraints
Requirements: GitHub, Knowledge of Unity Game Engine; Experience with Java, C# and C++.
Suggestion: Experience with Unity, UnityScript, MySQL, and CS design patterns;
Flexible: Visual Studio, Interested in logic puzzle games
Development platform: Web-based Unity platform
Programming paradigm: Object-Oriented
Time Constraints: We would like a level generator to be complete with sufficient time to complete user testing during the semester. The mentor will help guide which items will need to be completed first to assist with planning, and will work with the design team to conduct user testing and data collection and understand the data produced.
IP: Participating students will be invited to keep a copy of the project for their own use but the Game2Learn lab will retain rights to use and modify any created code or assets for research and education purposes. We would like to retain a creative commons license for all created artifacts.
References
- Maniktala, M., Cody, C., Barnes, T., & Chi, M. (2020). Avoiding help avoidance: Using interface design changes to promote unsolicited hint usage in an intelligent tutor. International Journal of Artificial Intelligence in Education, 30(4), 637-667.
- Hicks, A., Dong, Y., Zhi, R., Cateté, V., & Barnes, T. (2015, June). BOTS: Selecting Next-Steps from Player Traces in a Puzzle Game. In EDM (Workshops).
- Hicks, A. G. (2016). Design Tools and Data-Driven Methods to Facilitate Player Authoring in a Programming Puzzle Game. Dissertation, North Carolina State University.
About Microsoft
For more than 40 years Microsoft has been a world leader in software solutions, driven by the goal of empowering every person and organization to achieve more. They are a world leader in open-source contributions. While primarily known for their software products, Microsoft has delved more and more into hardware development over the years with the release of the Xbox game consoles, HoloLens, Surface Books and laptops, and Azure cloud platform. They are currently undertaking the development of the world’s only scalable quantum computing solution. This revolutionary technology will allow the computation of problems that would take a lifetime to solve on today's most advanced computers, allowing people to find answers to scientific questions previously thought unanswerable.
Background and Problem Statement
As everyone is busy coding the various components of a tool, the documentation for that tool is often deprioritized. We would like to have a consistent way of generating documentation for a specific C/C++/SystemVerilog code base used and then being able to host this documentation in a central place that can then be leveraged across the organization.
Project Description
The end goal for this project would be to have a pipeline in place where we can run a CMake C/C++/SV (System Verilog) project through, with output being a generated consistent format of API documentation which will then be hosted for our internal users. This pipeline should be using Azure DevOps pipelines.
Tools exist to do portions of this process, some of which are listed in the “Technologies and Other Constraints” section of this document. The project is to choose which technology (or technologies) that can serve the needs of the specific code base being targeted for use here, which includes:
- 1st party C code
- 3rd party C code (via Makefile build, called from CMake parent build)
- 1st party C++ code
- 3rd party C++ code (via CMake builds called from CMake parent build)
- 1st party SystemVerilog
As a simple example, our code project may look something like the following:
// .h file
namespace MSFTLibrary
{
uint64_t getVal();
MSFTLibraryObject getObject();
// setters...
boolean isValid();
}

// .cpp file
extern "C"
{
    #include "c_library"
}
#include <cereal/types/unordered_map.hpp>

uint64_t MSFTLibrary::getVal()
{
    uint64_t result = 0;
    // call third party cereal deserialization library
}

MSFTLibraryObject MSFTLibrary::getObject()
{
    MSFTLibraryObject result; // calls default no arg constructor
    // do stuff
    c_library_object temp = c_library_getVal();
    result = temp; // copy constructor, maybe extra logic in there to adapt
    return result;
}
namespace cereal
{

template
inline void save(Archive &archive, const MSFTLibraryObject &library_object)
{
    // use cereal's API to write out our object
    archive(make_nvp("object name", library_object.getName());
    // more archiving...
}
}

// .sv file
function string SV_MSFTLibrary::get_object_name();
   access_exists();
   return (MSFTLibraryPackage::dpi_sv_get_object_name());
endfunction : get_Object

// msft_library_dpi.h


// msft_library_dpi.cpp
extern "C"
{
    char* dpi_sv_get_object_name()
    {

        // ... allocate space on heap object named result......
        strcpy(&result[0], MSFTLibrary::getObject().getName().c_str());
        return (char *)&result[0];
    }
}
From there, it’s desirable to have all of those libraries/code bases used in the project to have the same look and feel in our API documentation (broken up by library is fine, so a separate page exists per 3rd party C code library, for example, that will work fine).
Lastly, the project revolves around the automation of said technology to create this pipeline. We would like to have an Azure Pipelines YML file that we can use in our continuous integration/deployment (CI/CD) system to perform all steps of interest:
- Build project
- Generate API documentation (or intermediate files to be sent to final documentation tool)
- Create/configure all that’s needed to have this output be ready for an Azure website deployment.
- Deploy to Azure websites.
- This would include some kind of versioning considerations. For example, it might be enough to have a top level index page which contains a list of all versions of the API(s)/codebase, as well as a “latest” link which would correspond to the main branch/newest release of our code.
- Clicking a top level link in that index page leads to the generated documentation for the project.
This pipeline will provide an automated way to generate documentation for the end users (who are our internal engineers programming against our library/API) the ability to see a consistent format of API documentation about the codebase and one centralized place to find the information. For example, functions and classes exist in header files, linkages between compilation units and the details and types of those function signatures require further digging into the source code. Cereal’s API documentation would be a good model:
https://uscilab.github.io/cereal/assets/doxygen/classcereal_1_1BinaryOutputArchive.html
which has class hierarchies, clickable links to other classes and more. The essence of this specific project will be to provide the API documentation in a way that the end users can follow not only for our first party source code (where Cereal has just it’s first party source since it has no other dependencies since it’s a header file only library), but also for our 3rd party code, our C code, and our SV code.
Today this API information, classes, expectations (resource lifecycles, invariants, etc) is not easily accessible and takes time from our engineering teams to review this when questions are raised. Having all of this in one place that is easy to consume will make it easier for our end users, who are the internal engineers building against our API and library.
Technologies and Other Constraints
Technologies:
- CMake based build process
- Languages to generate documentation for:
- C/C++
- System Verilog
Required Outputs
- HTML
- Markdown
- Azure DevOps/Azure Pipelines YML formatted configuration file
- Class hierarchy/diagrams
- API interactions (which block calls which libraries)
- UML?
Flexible (various tools to generate documentation)
- Doxygen
- Sphinx
- Breathe
- NaturalDocs
- Docsify
- Docusaurus
- Docfx – this is used by Microsoft today
- (potentially look at having this support C++)
- https://dotnet.github.io/docfx/, https://github.com/dotnet/docfx/issues/6336
Problem Statement
NetApp’s StorageGRID is a distributed, scale-out object store that implements Amazon’s S3 (“Simple Storage Service”) protocol, and can be deployed on-premise as a cost-effective and performance-optimized alternative to public cloud S3 offerings. A typical StorageGRID deployment consists of dozens or hundreds of storage nodes, distributed amongst two or more data centers, and has a geographic reach that often spans continents.
StorageGRID uses the Prometheus time-series database to track hundreds of metrics on system performance, and the Grafana charting package to visualize those metrics. These tools can be invaluable when trying to diagnose customer issues. However, the time required to actually make a diagnosis can be substantial, due to the sheer volume of data available. Which metrics are most important to understanding system behavior within a particular window of time, and how can those metrics be presented in an easily consumable fashion? These are the problems NetApp’s StorageGRID engineering team wants your help to solve.
Project
Enter Epimetheus. In Greek mythology, Epimetheus was the brother of Prometheus, and the Titan god of afterthought and excuses. Here, Epimetheus is your Senior Design project, an AI-driven runtime anomaly detector and visualizer, capable of sorting through hundreds or thousands of individual metric streams to find and visualize Points of Interest, or PoIs.
A PoI is an interval in time where one or more metrics, on one or more StorageGRID nodes, changes behavior in a substantial way – for example, the slope or direction of the curve, median value, or variance is significantly different than at other times. PoIs are interesting because they can be correlated with customer-observed symptoms, and may have value as predictors of future issues, or as evidence of a software or hardware problem that needs to be fixed.
PoIs, and the associated metrics, are not always easy for a human to find using guesswork, intuition, or brute force. Often the emergent behavior that has resulted in an outage can come hours or days after what turns out to be the important change in metric behavior, and the most important metric (the one closest to capturing a cause, rather than a symptom, of the underlying issue) may take a lot of digging to unearth.
Some real-world examples of metrics upon which the root cause analysis of major customer outages include:
- Key Metrics/PoI: Dirty active and inactive free pages in the Linux page cache, as well as the background and foreground thresholds for “emergency” page reclamation.
Symptom observed by customer: nodes rebooting randomly due to hardware watchdog timeouts.
Root cause: A combination of spiky memory consumption and an unusually high active page count caused by the customer’s workload would sometimes drive the dirty page metric above the emergency free threshold while the active page ratio was high. Since the Linux virtual memory subsystem counts active pages as free but does not actually allow them to be reclaimed during an emergency page reclamation operation, this condition resulted in user threads regularly taking long breaks from doing useful work while the kernel fruitlessly scanned through many thousands of pages trying to find some that it could reclaim. While these threads were blocked waiting on the kernel, the data they were trying to process piled up in socket buffers and the page cache, increasing the demand for RAM and resulting in a vicious circle that ultimately ended in a “big hammer” BMC watchdog timeout. - Key Metrics/PoI: Cassandra (NoSQL database embedded in StorageGRID) batch write latency, and the transmit bias current being applied to a single laser in a four-port 64Gb Fibre Channel Host Bus Adapter (HBA).
Symptom observed by customer: dramatic drop-off in system-wide performance, measured in S3 operations per second.
Root cause: a failing, but not fully failed, Fibre Channel storage connection, that was ultimately traced to a vendor manufacturing defect (“VCSEL oxide delamination”), was causing significant IO delays on a single node. Due to the non-performance-aware nature of the algorithm Cassandra uses to select the instances that participate in batch writes (which differs from quorum-based algorithms it implements for other operations), that single slow FC link ultimately slowed down the entire StorageGRID system.
Epimetheus is a web app with browser and server components that takes a Prometheus TSDB as input, identifies PoIs, and outputs a dynamically generated Grafana dashboard centered around a timeline diagram, with PoIs highlighted, and additional charts enabling deep dives on the metrics associated with each PoI.
Epimetheus is a tool for StorageGRID experts. Your customers include StorageGRID support engineers and software developers, who will count on your code to help them rapidly gain insights into the root cause of a customer outage, in many cases while that outage is still happening. Your work may be key in restoring voicemail and texting services to cellular subscribers of a Tier 1 national carrier, or getting a crude oil pipeline back online; these are both examples of the stakes of real StorageGRID support engagements. Ease of use and a clean and simple UX are goals for any design, of course, but the meat of this project, and the definition of success, is to accelerate RCA determination via intelligent metrics analysis and presentation.
Project folder, including real-world Prometheus database samples:
https://drive.google.com/drive/folders/15yvW30Cyhdi7aBmqRHYIcD_ZUxL9jZ1Z?usp=sharing
Email morgan.mears@netapp.com to request access (from MRH: please do not request access until you are placed on the NetApp team!)
Technologies and Other Constraints
- Project will be built on top of Prometheus and Grafana
- Server portion should run as a docker container on a Linux server (VM or bare metal). Server portion can accept a .tgz containing a captured Prometheus TSDB (either via HTTPS upload or some other mechanism you propose), instantiating Prometheus and Grafana instances in order to access and manipulate the time series data, and performing whatever CPU-intensive / long-running AI/ML, statistical, or other analysis you deem appropriate to meet the requirements of this project, as well as exporting a REST API to be consumed by the client portion.
- Client portion should run in a browser. Angular preferred because we use it elsewhere, but open to other frameworks if you have previous experience with one. Client portion is responsible for displaying PoI visualizations centered around a system timeline concept, and providing filtering, sorting, “drill-down”, and other functionality you propose to aid the user in rapidly forming a theory on root cause.
- Any open-source software used in this application must have permissive, non-copyleft licensing. NetApp will be happy to evaluate the suitability of any specific component license.
About Pendo
Pendo is a product experience platform that helps product teams deliver software that users love. Pendo provides insights from product usage patterns and user sentiment for making better product decisions. From these same insights, you can easily set up in-app messages, guides and walkthroughs to help users get the most value from your products.
Pendo placed 26th on the 2020 Inc. 5000 list of the fastest-growing private companies in America, moving up 47 spots from its 2019 ranking. Pendo ranks 3rd in the “software” category, and is the 2nd fastest-growing private company in North Carolina.
Background and Problem Statement
A Privacy-Focused Customer Vision
Here at Pendo, we place a top priority on building trust with our customers. Since our backend systems collect, store, and analyze data from our customers’ users, they are placing a huge amount of trust in how Pendo handles their data, some of which may be sensitive. To continually meet the needs of our customers and maintain the highest level of data security, we are starting an initiative for a privacy-focused customer vision. This initiative has a technical deliverable: The Privacy Management Portal.
Pendo Admin User Persona
As a Pendo admin, I want to have a central landing page where I can manage all of our security and privacy settings, and to be able to manage an inventory of data that Pendo has collected, which may include potentially sensitive user information.
I want to be able to easily apply different policies based on the sensitivity of user information. For example, I want to block collection of highly sensitive information like SSNs and credit card numbers. For some less sensitive information, like email addresses, I’d like to be able to collect but not display that information to some of my Pendo users.
I’d also like to be able to see where data is being sent through integrations, and apply policies based on sensitivity for those as well.
Data Loss Prevention API
One piece of the privacy management portal is going to be the use of the Google Data Loss Prevention (DLP) API.
Pendo works with billions of data points every single day. With such massive amounts of data, it is crucial that we are cognizant of each piece of data that enters our systems, so that we mitigate the risk of ingesting personally identifiable information (PII). As we continue to scale, add more customer applications, and create new data streams to our backend services, there is an increasing need for a system to scan our data for PII.
This brings up an important ethical question for Pendo: How do we monitor our data for accidental ingestion of PII from our customers WITHOUT having to access the PII ourselves?
Currently, we perform manual scans, on an as-needed basis, that leverage the Google Data Loss Prevention (DLP) API to identify potential sensitive information and PII without exposing the data.
You can see an example (and enter your own text to experiment) here: https://cloud.google.com/dlp/demo/#!/
You can learn more about Google DLP at these links:
https://cloud.google.com/dlp
https://www.youtube.com/watch?v=GArEb2e9jGk
We would like to create a process for automatically running a sample of our data through the Google Data Loss Prevention API and making those results available to our customers.
Project Description
The project will be the implementation of the privacy management portal. To complete this work, the team will be given access to our repository of frontend and backend code, with the expectation that their solution will be a microservice or integrated with the existing Pendo application. We will provide an environment for the team to use, as well as guidance for deploying changes.
This project is large in scope, with several objectives. The list of objectives is below - ones in BOLD are required, and should be worked on first by the group (bolded items may be worked on concurrently). Should the group deliver the required objectives, they would be able to move on to the stretch goals.
Objectives
- Have a single landing page where all Pendo data security and privacy features can be managed (The UI component)
- Toggle services through the “Settings“ tab
- Manually run a privacy check on latest data, or schedule periodic scans in the “Privacy Health Check” tab
- Customize how data is flagged through the “Data Element Manager” tab
- Automatically create and maintain a list of any potential PII collected by Pendo using Google DLP API
- Should be able to trigger a DLP scan manually or on a schedule
- Automatically categorize data in the inventory by sensitivity (red/yellow/green) using output from Google DLP API and user’s data sensitivity settings
- Allow users to adjust data sensitivity setting (red/yellow/green) in accordance with their company's data privacy policies.
- For example, maybe the user wants social security numbers to be marked as red, but later decides they want them to be yellow. The application should be able to handle this case.
- Code is fully documented and “user guide” is provided to Pendo explaining how your code works and how to use it
- Have a feature that allows user to automatically enable all security/privacy settings with a single toggle ("privacy by default")
- Have a feature that checks user security/privacy settings and makes recommendations for improvements ("privacy health check")
- Allows user to see where data elements were collected from (e.g. pages in my app) and the frequency with which they have been collected
- Enforce basic policies based on data sensitivity (e.g. red = do not collect; yellow = obfuscate in the UI for some users based on their role; green = no action needed)
- Regularly refresh the data inventory and alert user to changes
- See what other services user Pendo data is being shared with (i.e. what integrations have they set up and what data are they sending to)
Technologies and Other Constraints
Frontend:
- ES6 JavaScript - Required
- Modern UI Framework (such as Vue, React, Angular, etc) - Required
Cloud:
- Google Cloud Platform (Appengine, Google Cloud Storage) - Required
- Google Data Loss Prevention (DLP) API - Required
Backend:
- Go - Required for majority of work
- A familiarity with Python may be useful for certain scripting tasks
Version Management:
- Git - Required
STUDENTS WILL BE REQUIRED TO SIGN OVER IP TO SPONSOR AND SIGN AN NDA WHEN THE TEAM IS FORMED
About SAS
SAS provides technology that is used around the world to transform data into intelligence. A key component of SAS technology is providing access to good, clean, curated data. The SAS Data Management business unit is responsible for helping users create standard, repeatable methods for integrating, improving, and enriching data. This project is being sponsored by the SAS Data Management business unit in order to help users better leverage their data assets.
Background and Problem Statement
With the increased importance of big data, companies are storing or accessing increasingly more data. Storage facilities for big data systems are often called data lakes. All of that data is taking up space in data systems. As data sizes grow, data lakes frequently become data swamps, where vast amounts of unknown, potentially redundant data is stored. Some companies claim that as much as 80% of their data is duplicate or partially duplicate data.
Project Description
The goal for this project is to write a data indexing web application that can be used to locate similar datasets. The application should classify an input dataset by extracting important features (range of values, mean/median, completeness, others that we can suggest) and using that information to create a score for the dataset.
Essentially your code is analyzing data to capture and store metadata about the data that you are reading and indexing into your application and then tossing the original data away and just keeping a pointer to the location of the original dataset in your index. The metadata is enough to fully qualify the content of the dataset so that you can use it for searching and for comparison purposes to find similar data. Think of this metadata as a feature vector that fully qualifies the dataset content.
- Users can then use your application (which contains the pointers to data that you have indexed into it including the dataset score) to search for data that has been previously indexed into your application, and get recommendations for similar datasets.
- The dataset score will be used to identify similarity (using something like an AI similarity algorithm, see the References Section). Think of your application as similar to a library’s card catalog, where users can come to search for content and get recommendations for similar content that they might be interested in.
- The app will also provide simple search features and a UI to recommend similar content. The search features can be based on simple keyword searches of the table name or another method of your choice, with wildcard matching. Note: if you want to use an open source searching application like Elasticsearch as the backend for your search you can, and that would be a good addition. It is your choice.
- If you use Elasticsearch, note that its default index is based on a distance algorithm for text based matching. This application is not just based on text, so you will have to augment its default by boosting the results with your table metric (also can be thought of as the hash or index) that fully describes the CONTENT of the table, not just the name and column names. You are going to be building this feature vector/hash/metric as part of this project. It should be used to identify similarity of the content of the dataset and it would need to be used to boost the search algorithm or technique that you come up with.
- If the user chooses to select a particular dataset (e.g a CSV file), the app will provide a way to access it from your application (via a URL to the dataset if it is stored in some external system for example or by opening it using the default OS system open actions if the data is stored locally on a system).
- The datasets that you have hashed into your application index will not reside in your system in the first part of this project. There are some ideas for additional features a little later on if you get to those parts where you actually store data, but that is not part of the first part of this project. You will need to get the physical datasets however to perform the operations to build the hash/feature vector of that data to put into your application index (we suggest that you copy that data over from the source system to your local system in order to characterize it). The easiest format to use to copy the data over is the csv format; it can then be used in your local system to run your Python algorithms on to build the hash/feature vector that fully characterizes each dataset.
The application should be written in React and it should support indexing content that is coming from a variety of systems. For example, it would be useful to be able to index content stored externally online. There are some example locations for datasets in the references below. New content should be classified and its similarity categorized compared to the existing data that exists in your indexing application. Replicated content should be detected (hopefully using the score), such that if the same dataset is received again, duplicates are not retained. Reports on the index should also be supplied so that users can identify potentially redundant data in the index. You may want to consider contributing your application to the open source community.
Other ideas and nice features to have:
- You may want to consider using the taxonomy classification project completed by students in the Fall 2020 project Senior Design class as some of the features to consider as a starter for figuring out how to create your dataset score. They just did named entity recognition, so that is just a small number of features that you would be able to start with, but it is a good starting point for character columns.
- You might want to take into account the quality of the dataset when considering whether two datasets are similar and when presenting search results to a user. If the dataset has major problems (such as lots of missing data or values that are highly skewed), then you take that into account when users use your system to search for data. Can you provide an overall quality score for a dataset? What features would go into that score? Can you present that information along with the results of the search, and weight the search results that get returned to present the closest match to what the user is searching for with the highest quality?
- In an effort to ensure that intellectual property rights are maintained: for external data that you provide information about in your index, if you can get the license type, retain that along with your dataset score in your index so that you can present that information to users if they choose a particular dataset.
- Other nice features to consider are to provide a dataset difference view so that users can choose to view the differences in the features you have captured between similar datasets.
- Another feature that would be useful is to explore if there are APIs available that provide information about data (metadata) that you could use to collect enough information about a dataset so that you do not have to copy down the original dataset to analyze. Google datasets search is one such API that you could explore for example, as they capture some metadata about the datasets that they make available. Could you use this API, or are there other open source APIs available that you could use and support with your application, that provide enough information in their API about the data that would enable your application to characterize datasets in them without needing the original data to provide a hash about the content? How much does the system degrade (how inaccurate does it become) in this scenario? Remember that given the vast amount of data around, that even a small improvement in being able to locate and provide pointers to similar remote datasets would be incredibly helpful to people as it would save them from having to manually search themselves. You could make these API readers to external metadata systems available as additional components people could use to get to interesting datasets.
- Detection and notification of strata in the data (used for detecting bias) - One of the reasons we want to identify similar data is so that we can locate information that is being used that is relatively “good” or “fit for purpose” and also locate information that is not useful or should not be used. There is a lot of concern in the industry around data being used for modeling and reporting that is biased in some way such that the results are skewed and not to necessarily be trusted as a result. This bias can apply to how the data is aggregated (the classic example is Simpson’s Paradox, see the references below) or it can be in the various stratifications in the data. For example, the data could contain a heavier concentration of urban residents but be intended for identifying the location of rural patients in a community. This is very much a stretch goal, but being able to provide information about the content such that a researcher can understand the data more clearly, and identify similar datasets that might augment or compliment to fill out different strata, is one of the areas that we are trying to explore. You could provide additional metrics around the strata contained within the data that could be used by researchers to understand and locate similar data, and also to identify areas where bias could get introduced.
Objectives
This project has the following objectives:
- Create an application for ingesting data and create and generate a score that uniquely characterizes the data. (see below)
- Create a User Interface for your data index that supports search, find, and get similar data recommendations
- Provide data connectors to external content to ingest into your index. Start with CSV on local files but see other ideas for mining data in other places in the project’s description.
- Optional features: provide reports about the data stored in your index; provide a differencing viewer for similar data found in your index so that users can make an informed choice in selecting a dataset; contribute your application to the open source community; provide an external REST API that documents the features needed to place objects into your index that could be used to ingest more content into your index, and that you take into account when calculating and presenting similarity.
For the differencing viewer it would be helpful to show a side-by-side view of the metadata you have captured that you are retaining on a dataset so people can see how the two datasets differ. Here is one possible example:

Definitions and Examples
“Score that characterizes data” - In essence, this is the piece of information for each dataset that uniquely characterizes it. It could be a number (a hash of some sort) or a vector that describes the dataset. Part of this project is to come up with some ideas and an implementation of what is a good way to create and store this score. Think of one score per dataset, and you will be using this score to compare to other datasets to identify similarity.
Here are some ideas of the types of features about a dataset that should go into this score. These are just some ideas, and you might think of others. I have included some thoughts about these features as well.
Remember that you are looking for similarity across the entire dataset (not just its structure), so some of these features are going to be more important in achieving that goal. For example, just because a table has a different column name does not mean that the table has actually different content. One system might call a column “A” but have exactly the same or very similar data in the actual content as another dataset that calls the column “B”. Another example is different numbers of rows. Data “A” is slightly different than dataset “B” if it has more rows, but if the data is essentially the same between them otherwise, then the two datasets are still very similar, and we would want to know this.
This suggests that some of the features you use to calculate similarity are going to probably have to be weighted. Features that are more important for identifying overall similarity are weighted higher, and features that are less important for identifying overall similarity would be weighted lower.
- Shape - Column types and the number of columns in the dataset; number of rows
- Statistical measures of the columns: mean, median, max, min, std deviation. Note to beware of Anscomb’s quartet (different data, similar statistical measure) though. Skewness, kurtosis, cardinality; for nominal values: frequency distribution, cardinality
- Overall data quality - % of missing values (should be low), % of outliers (should be few), skewed data (very skewed is not good across an entire dataset), columns that are highly correlated (indicating presence of duplicate data across the table), presence (good) or absence of a primary or unique identifier, presence or absence (good) of entirely duplicates rows, and others. You can research this to come up with an algorithm to propose, just research data quality metrics.
- Any named entities using named entity recognition
- Theme (from the Fall 2020 project) if you want to include that; this is the theme/overall classification of the dataset
- Keywords found if there are large text columns; you can pull these out using text mining; I further reduce them using topic discovery to get an even smaller subset
- You can probably think of others
“Data Index” - this is the content for each table that you store in your app. This is the hash/feature map/score.
In addition to this score though, I think there are some fields you want to retain for each table that you have in your app storage for each dataset beside the score; they would be generally useful. I included some in the description above, this is elaborating on that information
- The score; The name of the dataset, any descriptive information you have on it; a pointer to where it exists (in the original source system if you are not storing it in yours) which would be really nice if it was a URL so that people could go look at it if they want to; the license for it if you can get it; the structure (column names) and any info about it you want to retain like cardinality, top values. I think the data here could be optional, your choice; if you include the text mining classification then that value.
Technologies and Other Constraints
- React frontend
- Python backend
- Storage - any preferred storage that the students can work with (e.g. MySql)
- The data format is structured/tabular data (rows and columns). A stretch goal would be to explore other data formats (e.g. JSON).
To ensure the success of the project, you should have some knowledge and background of machine learning and statistical methods. Knowledge of Python and REST interfaces will be helpful. You may want to contribute your design into the open source community. You should have some knowledge of Javascript and will be learning React.
Reference info, Data Sources, other examples, etc.
Similarity algorithms: https://neo4j.com/docs/graph-algorithms/current/algorithms/similarity-jaccard/ ; clustering
- Common Data quality metrics https://www.cloverdx.com/blog/6-data-quality-metrics-you-cant-ignore.
- Elasticsearch : https://www.elastic.co/
- Data sources: https://www.analyticsvidhya.com/blog/2016/11/25-websites-to-find-datasets-for-data-science-projects/
- Examples of similar datasets:
- Data in a similar domain: https://github.com/fivethirtyeight/data/tree/master/airline-safety; there are datasets that differ just by the years on this site and they are in csv format. You could use them as examples of similar data. Also compare these datasets to this dataset from Kaggle: https://www.kaggle.com/danoozy44/airline-safety , how far apart are they? Another that has similar data: https://www.bts.gov/content/us-air-carrier-safety-data to potentially compare against; others: https://catalog.data.gov/vi_VN/dataset?tags=safety&groups=consumer9350
- https://github.com/fivethirtyeight/data/tree/master/bachelorette another round of similar data, just differing by the week they were eliminated
- There is a plethora of data on COVID. Researchers really need to understand the quality and similarity or differences between states, what is being collected, what is available. There are many sites where there is different state data in similar contexts; here is one site, can you identify others where there is similar data? What are the similarities/ differences between US and other data collected by other countries? https://github.com/nytimes/covid-19-data ; https://covidtracking.com/data/download https://data.humdata.org/dataset/novel-coronavirus-2019-ncov-cases https://data.humdata.org/dataset https://www.ecdc.europa.eu/en/publications-data/download-todays-data-geographic-distribution-covid-19-cases-worldwide
- https://en.wikiversity.org/wiki/Duplicate_record_detection
- React: https://reactjs.org/tutorial/tutorial.html
- Why Data Lakes Fail: https://www.arcadiadata.com/blog/the-top-six-reasons-data-lakes-have-failed-to-live-up-to-expectations/
- Why big data storage lakes fail: https://www.forbes.com/sites/danwoods/2016/08/26/why-data-lakes-are-evil/
- Here are some places you can go to get structured datasets that are already somewhat classified to use to build and test your algorithms:
- https://quantumstat.com/dataset/dataset.html ~200 NLP Datasets
- https://www.openml.org/search?type=data - Thousands of really useful datasets here
- https://www.iso.org/home.html - International standards
- https://ec.europa.eu/eurostat/data/database - European statistics and classifications
- Google dataset search –I have used a lot of data from this site (nice writeup - https://blog.google/products/search/discovering-millions-datasets-web/)
- Kaggle.com
Sponsor: Michael DeHaan, NCSU Senior Design Staff <mpdehaa2@ncsu.edu>
Background
Numerous monitoring tools exist for making sure that production servers and services stay efficient and operational. These include stand-alone tools like Nagios or Cacti to commercial hosted offerings like New Relic and Datadog. Somewhat adjacent to monitoring tools are logfile aggregators like Splunk, Loggly, and ELK.
This project is not intended to improve on any of the features of the above tools, but instead to show how simple the construction of a monitoring platform can be, while teaching some lessons about the components involved. Before the emergence of popular open source tools, in fact, many companies wrote their own monitoring systems - and many still do if they have specific needs and applications.
Aspects of The Application
For this project, we want to construct the following:
- A python3/Django ‘core’ application that stores information about hosts, groups of hosts (tags), host statuses, users, groups of users (teams), alert thresholds, and who to notify via email/text-message in case of problems.
- A UI to show inventory information about hosts, grouping them by tag, and showing
- Hardware characteristics
- Installed software
- Time-series graphs and historical values for collected metrics possibly including
- CPU utilization
- Disk space
- Free memory
- Statistics on running processes (“top”)
- List of running containers, if any
- Uptime
- How long it has been since a system has been heard from
- Status results of one or more configurable web service status checks (requirements can be explored later)
- A daemon to run on the monitored hosts and periodically send monitoring data to a message bus. This daemon should self-register with the central service to be friendly with cloud applications that may scale up and down periodically and do not have reliably consistent hostnames. Each server might auto-generate its own server ID.
- Another daemon to send email alerts that have tripped, that is also cautious enough to not send too many alerts.
- A management command to purge old data and retain data based on certain intervals (such as keeping more data about recent events, and keeping more averages for events further in the past).
- Ideally, a way for the user to mark certain events in time, like a software release, so that they show up on the graphs.
The monitoring server should use a PostgreSQL database. The message bus should remain pluggable, but ActiveMQ or a similar message queue is a reasonable choice.
The user interface should be very dynamic, with an emphasis on exploring trend graphs for various selected metrics. Additionally it should be possible to graph monitoring statistics of hosts with the same tag on the same graph. It is not necessary for the UI to update in real time, nor does any Javascript framework like Angular or React need to be used. For simplicity, the UI could be kept to bootstrap+JQuery+Django templates.
This project will place a heavy emphasis on code review and architecture, and try to build a base application that we can potentially extend in CSC492 for future semesters.
Background
SourceOptics (http://sourceoptics.io) - is a free web application developed by and for CSC492 that provides statistics about software development contributions in git-based projects.
CSC492 staff use SourceOptics to ensure teams are working efficiently and also having a good course experience. Identifying unusual patterns in development could indicate a team is stuck on a particular problem or may need help resolving team conflicts or in reorganizing their task plans.
There are also applications of SourceOptics to understanding corporate software development patterns, particularly in large organizations, or in studying open source upstreams used as dependencies in other software projects.
Over the past several semesters, CSC492 teams have developed an initial version and added numerous upgrades since. While extremely useful, the present system requires a user to look through and understand the data (or graphs) and it is evident from various user interviews that the system would be more valuable if output was more summarized and prescriptive.
To do this, we want to get the system to report on trends and send out more actionable reports to staff about what to look at, so they can use this information when meeting with project teams.
This project is being sponsored by Michael DeHaan (mpdehaa2@ncsu.edu).
Project Goals
For this semester, we want to add reporting features that will likely involve a mix of improved statistics and pattern recognition techniques. They may include:
- Reporting on teams that are trending up and down based on previous weeks (and the other teams).
- Teams and students without commits in the last week, and when they last had a commit.
- Reporting on how the primary developers of certain portions of the application (indicated by subdirectories) change over time. What components are being shared between what team members?
- Anomaly detection - such as one team trending up while other teams are trending down, or a team’s commits are sporadic. These may indicate possible conversation points.
- Reporting on the dominant types of files being worked on week to week, based on extension, and how these are changing.
- Attempting to report on tendency to create new files vs edit existing files, as well as ratios of deletion to creation, which can indicate refactoring tendencies.
- Reporting on the distribution of files with multiple authors which can be indicative of better teamwork and code review.
In addition to computing these statistics, we also want to be able to email out a weekly report to staff. The list of people to receive the email can be configured on an organizational (class/section) basis.
Implementation Details
SourceOptics is a python3 + Django application whose UI is built with JQuery, Plotly (for graphs), minimal jQuery, and Django templates. We’ll want to keep these choices for this project.
It should be noted that this is mostly a statistics and frontend project and not a “machine learning” project. SourceOptics keeps a time series database (in PostgreSQL) of past data and stats, and we can use that data to compute and store trend information.
Statistical calculations can be run by a batch job against database data after the scanner process completes and will be run in production nightly. The UI should present whatever computed stats/info are in the database, and the email reports can run off this same data. Where reports do not exist for previous weeks, the statistics code should generate them retroactively and store them, allowing access to a history of past reports at any time.
About Sunder Networks Inc
At Sunder Networks, our focus is on building innovative solutions for legacy network problems. To that end, we are building out a network hardware / software middleware platform that will allow us to rapidly develop these solutions or "Apps" and deploy them across disparate network hardware devices (build once, deploy everywhere). Sunder Middleware (working name) includes the libraries and tooling that will allow developers to not only build custom, innovative new network Apps, but also to bring the full CICD software lifecycle model all the way down to the network hardware layer.
Historically, new network platform development spans years of development and testing. By building a development platform with APIs and Closed Loop Verification we believe we can largely reduce development costs and open up the ecosystem to innovation from a much wider range of potential developers.
Background and Problem Statement
The emerging practices and capabilities of the SDN revolution (see Figure 1) have enabled an incredible opportunity for innovation within the networking ecosystem. Usually it takes a dedicated platform team and lab full of heterogeneous switching platforms to develop and test against before going to production with new network features or fixes. While unlimited resource hyper-scale companies (e.g., Google or Facebook) are able to devote the type of resources required for this network workflow, the vast majority of enterprise customers do not have the network engineering resources to build and maintain their own network and tooling.

Figure 1: Software Defined Networking (SDN) milestones
The goal of this project is to use Sunder Middleware and prove that it is possible to build production grade Network Functions in a rapid and cost efficient manner and democratize network hardware development. Some examples of what this new programmable dataplane paradigm would allow for is the capability to
- Develop your own network protocol
- Implement security functions of your own design
- Add IPv6 functionality to an existing network function
All of these statements and more are possible with the advent of programmable Ethernet ASIC’s (such as Barefoot Networks/Intel’s Tofino see platforms or diagram for more), combined with the open source contributions of Stanford, Google, Facebook and others.
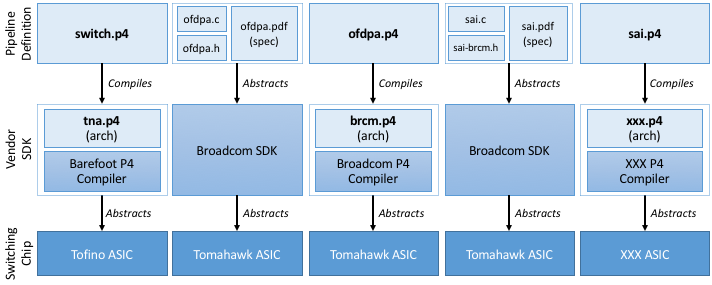
Stratum from Google is the Switch Operating System in use for this project: https://opennetworking.org/stratum/
Project Description
Students working on this project will develop multiple network “App”s written in the P4 language. Sunder Networks will provide plenty of help and interaction throughout the semester. We are seeking to learn the pain points of the development process using our middleware and what tools, graphics, and other resources would enhance App development along with hardware testing and integration.
The “App” consists of one required P4 source file main.p4, a test.py source file containing Scapy packet definitions for testing the application code (see Figures 2 & 3).

Figure 2: P4 pseudo snip (Credit p4.org)

Figure 3: Scapy python interpreter snip , test.py will be source code using these types of Scapy calls
Each week, the Sunder engineers will deploy your P4 App code to real hardware in the Sunder Networks Lab (see Figure 4).

Figure 4: Wedge-100bf-32x located in the Sunder Networks Lab
The project will begin with a HelloWorld Network “App” program so you learn the general development flow with P4. Listed below are three additional Network “App” examples that we want the team to develop. For each of these “Apps”, we will discuss approaches and provide you with getting started skeletons for the P4 code.
- HelloWorld (Learning): IPv4 Routing simple example to introduce P4 and the tooling flow.
- Security function of choice: stateful firewall, acl, tcp behavioral fingerprinting? We will provide links to other examples in the domain as well as provide thoughts on implementation e.g., what can be implemented in first pass vs what parts will be more difficult and why.
- In-Band Network Telemetry (INT): New monitoring capabilities what do you want to see? An example would be a flow watch list and select among metadata of interest such as ingress timestamp, egress timestamp, average queue depth.
- Custom Header design: Network protocols allow independent entities to communicate over the internet; when you control the dataplane forwarding efficiency can be gained by creating your own TCP/UDP or other layers of protocol headers.
Creating these Apps using the Sunder Middleware will provide us with valuable customer-type feedback on our proposed development workflow. Your work will help us prove our value propositions and refine our APIs for the market.
Technologies and Other Constraints
- P4 (p4.org) - (main focus, no prior experience required)
- Go (golang.org) - (suggested, not required)
- Kubernetes (k8s.io) - (suggested, not required)
- Docker (docker.io) - (required)
- Python (python.org) - (required)
- Communications Network Concepts (suggested)
- Network Security Concepts (suggested, not required)
- Network and Systems Testing Concepts (suggested, not required)
- CICD / DEVOPS / Automated Software Lifecycle Concepts (suggested)
The recommended workflow will be: local computer development using Docker & IDE of choice to edit source. The local development workflow on the BMv2 virtual switch will utilize Makefile for build/test/reset of the virtual software switch; build the dataplane program and test using the python coded packets.
However, the workflow is flexible, meaning that there are many ways to break up the control plane, data plane, and build/test pipeline. We will go into more depth on these variable points of control delineation, with examples, during the course of the project.
In our lab we have multiple Wedge100BF-32X which are Tofino - based (P4 programmable pipeline silicon chips), 100G whitebox switches that we will use to test and verify the students P4 apps. We will guide the students through manual testing on the hardware switches, as well as aid them in building automated testing pipelines so that they can rapidly iterate on their Apps.
Project Archives
| 2026 | Spring | Fall | |
| 2025 | Spring | Fall | |
| 2024 | Spring | Fall | |
| 2023 | Spring | Fall | |
| 2022 | Spring | Fall | |
| 2021 | Spring | Fall | |
| 2020 | Spring | Fall | |
| 2019 | Spring | Fall | |
| 2018 | Spring | Fall | |
| 2017 | Spring | Fall | |
| 2016 | Spring | Fall | |
| 2015 | Spring | Fall | |
| 2014 | Spring | Fall | |
| 2013 | Spring | Fall | |
| 2012 | Spring | Fall | |
| 2011 | Spring | Fall | |
| 2010 | Spring | Fall | |
| 2009 | Spring | Fall | |
| 2008 | Spring | Fall | |
| 2007 | Spring | Fall | Summer |
| 2006 | Spring | Fall | |
| 2005 | Spring | Fall | |
| 2004 | Spring | Fall | Summer |
| 2003 | Spring | Fall | |
| 2002 | Spring | Fall | |
| 2001 | Spring | Fall |