Projects – Fall 2011
Click on a project to read its description.
Power Outage Failure Diagnosis
Overview
AT&T has many different business units catering to many different technologies and consumers. Each business unit has a unique set of tools that are used to support these customers to ensure good customer satisfaction. AT&T is currently working to build closer connections between each of the business units in relation to customer care. One project that is currently underway is to combine outage/failure information from each of the different business units into a single database.
After the database is complete, the next phase is to mine that data to help support each business unit. One key area of focus is identifying power outages. Power outages cause many alarms/alerts and trouble reports into AT&T. But, it is not always easy to confirm an outage is related to a power event. The theory is that if we have enough data points, we can build an algorithm that groups outages by geographic location, and then if we have specific information about the reason for the outage at some of the locations in the groupings, then we can infer that all the outages in the group are due to the same root cause.
- Import all the data into a database, and then ensure that we have common points of data that can be used from each system. I.e., each system might have a different name for Street Address, Zip Code, Area Code etc. Data points that do not have the required information should be ignored.
- An algorithm will be needed to create a grouping of an outage based on location. Currently we are thinking that sites within a 5 mile radius should be grouped together. The mile radius would need to be configurable as it might change as we look at results.
- A second algorithm will need to be applied to the grouping to determine the likely root cause of the outage. This will include a second set of data points that have testing results from various AT&T systems.
- The long-term purpose of this tool will be to provide AT&T customer support technicians near real-time information about outages that are in progress. For this project, AT&T will provide outage and testing data from the month of July, 2011. The NC State team would need to create a simulator that feeds the data into the algorithms to simulate real-time data feeds.
Technical Knowledge Needed
AT&T uses a wide variety of programming languages and tools. The foundation of most of our tools makes use of MySQL for databases, Perl for data manipulation and analysis, and PHP/Flex for any Web Interface/GUI that is needed. Obviously this list is flexible depending on the needs of the project.
The main focus of this project is going to be in the two algorithms needed and the simulator. These might require more programming languages and tools mentioned above. We would need to approach each one as the team saw need of them to ensure that we can incorporate them into the AT&T infrastructure.
Mobile Stock Trading Facebook Style
Leveraging social media provides a powerful way to enhance almost any activity, including trading on the stock market. To capitalize on this, students are required to create a game which simulates stock trading in the form of a Facebook application. Users of the game would be able to create and maintain mock stock portfolios that perform according to real world (or mock) conditions. Stocks can be purchased or sold for Facebook points. The game would allow an initial number of Facebook points for users to create their initial portfolio. Users can receive news feed updates about the activities from their friends, compete against friends, and earn achievement points in the game.
Students are asked to develop a mobile component for this application, which would allow a user to manage his or her portfolio on-the-go. In addition, the mobile application would augment a user’s ability to make informed decisions about acquiring or selling stock by utilizing QR codes/bar codes on a product [optional]. Using the code, the application would fetch stock information and other relevant data about the product from the web. From their mobile devices, users could quickly scan a product, review stock information, and decide whether to buy or sell stock on the Facebook application.
This project would be designed to be implemented over two semesters conceivably by two different teams. This would necessitate a focus on the readability of code and the quality of the accompanying documentation and design artifacts (low level design docs and functional requirements docs).
Mobile Example Scenario
A user is walking down the street and sees an interesting product in a store window. By scanning the QR code on the product, the user is able to pan through screens on his/her mobile device displaying up to date stock information for the product’s manufacturer. Impressed by the related stock’s performance, the user chooses to spend points to buy stock.
Do You Need a Hybrid Vehicle?
With the development of Smart Grid technology, plug-in hybrid electric vehicles (PHEV) have become an area of focus at Duke Energy. The goal of this project is to develop an iPhone/iPad application that will track driving characteristics of users and provide recommendations on which type of PHEV they should purchase. This project has two components that must be investigated. The first component is to characterize operational aspects of PHEV’s. The second component is to characterize a driver’s profile based on GPS and other data collected during driving experiments. The application to be developed must implement an algorithm that recommends a PHEV based on a given driver profile. The application should also provide reporting functionality to give the user insight on driving habits and the PHEV recommendation. iPhone/iPad devices will be provided for experiments.
Software Testing: Game On!
Game playing is a rising trend in corporate environments to crowd source solutions and train associates in an engaging manner. Fidelity Personal Investing (PI) QA would like to develop a framework to allow their employees to play games to improve their knowledge of the business and use of our tools. The game playing framework would allow PI QA management to devise trivia-style questions that could be played self-paced and in a short time frame. Players would be able to answer questions to earn points, move up leader boards and earn badges, adding a self-paced, social aspect to education.
Expected features include the ability to: define multiple-choice questions (including graphics) and correct answers, assign different points awarded for questions, set time limits on questions, define rules that when met will generate a new reward/badge for the user, generate a leader board, and potentially more.
Students undertaking this project would have to develop a web-based solution with database backend to store questions and player information (answers to questions, ranking data, badges, etc.). In order to support hosting the solution on Fidelity's infrastructure, it should be written in HTML and Java (JSP, servlets). Students can assume the backend database will be MySQL.
An example question may look something like the following questions:
- Which of these is the correct folder structure for discretionary project in Quality Center 10 in the test lab:
- Project Repository\Year-Quarter\PPMC Project Name\Application (this is the correct answer)
- Master Repository\Product Line\Application
- Project Repository\Product Line\Application\PPMC Project Name
- Any of the above is ok.
- Your project is currently in the test execution phase. You examine your test execution progress vs. the likely execution curve and see the following image. What action do you take?
- Do nothing, testing is progressing fine
- Do nothing, test execution typically picks up towards the end of the test cycle
- Add resources or increase effort, testing execution is below expectations (this is the correct answer)
- Remove resources or decrease effort, test execution is ahead of expectations
Exploring Applications of Intel’s Trusted Computing Technologies
Background
Modern computing systems are built with a large Trusted Computing Base (TCB) including complex operating systems, applications, and hardware. The TCB provides security and protection services for both data and processes within a computer system. Because the TCB lies at the lowest layer of the software stack, compromising any portion of the TCB will result in compromising the security of the entire system, and sensitive information input to the machine is no longer protected. Given the size and complexity of the TCB in modern computers, it is very difficult to provide adequate protection to the TCB from attack and ultimately provide protection to the entire computer system.
Much of the world we live in today is enabled by computer systems and those systems rely upon the TCB for protection of their critical processes and data. Any vulnerability found within the TCB might affect the entire system and anything that depends upon it. The impact of a vulnerability can be as simple as disclosure of financial information or as complex as a power outage due to failure of a control system.
Project Purpose
The intent of this project is to create an alternate execution environment for the sole purpose of protecting critical system information. This alternate execution environment will be built upon a minimal TCB and will only leverage the hardware portion of the TCB.
Project Statement
This project will seek to improve the security of critical data by leveraging the features of Intel’s Trusted Execution Technology (TXT) and Trusted Platform Modules (TPMs). This project will use Flicker, a dynamic software environment with a minimal TCB developed by Carnegie Mellon University (CMU), to store and protect critical data from the O.S. This software environment is not intended to replace conventional systems; rather it is intended to operate in conjunction with conventional systems while providing an additional level of protection to sensitive data previously unavailable. This design requirement to operate in conjunction with a conventional O.S. dictates that an Application Programmers Interface (API) must also be developed to provide a controlled interface between the trusted software module and the running O.S.
Specifically, the project will involve:
- Suspending all activity on the computer and turning control over to a trusted software module
- Resuming a running O.S. and restoring all associated system data
- Implementing a cryptographic routine not natively supported by the TPM
- Integrating the developed cryptographic routine with the trusted software module
- Developing a process to authenticate the user and application to the trusted software module
- Integrating the developed module with a VPN application
Project Deliverables
This project will include the following deliverables:
- All developed Source code
- Documentation covering the design, implementation, and lessons learned from the project
- A demonstration showcasing an application utilizing the trusted module to provide protected access to sensitive data
- A technical presentation covering the design and implementation of the trusted software module
- A written paper (optional academic paper for submission to a workshop)
Benefit to Students
Students will learn a great deal about the details of modern x86 architectures, developing low-level code, computer software security concepts, and current research challenges in the field of security. Of particular benefit, students will learn how to use hardware-enabled security and leverage the TPM. Both of these technologies are anticipated to provide the basis for many trusted computing environments and other security applications in the coming years.
Suggested Team Qualifications
- Interest in computer security (basic knowledge is beneficial)
- Basic background in operating systems
- Experience with Assembly and C programming
- Basic understanding of computer architectures
Suggested Elective Courses
- CSC 405 Introduction to Computer Security or CSC 474 Information Systems Security
About APL
The Applied Physics Laboratory (APL) is a not-for-profit center for engineering, research, and development. Located north of Washington, DC, APL is a division of one of the world's premier research universities, The Johns Hopkins University (JHU). APL solves complex research, engineering, and analytical problems that present critical challenges to our nation. Our sponsors include most of the nation’s pivotal government agencies including the Department of Defense (DoD), the Department of Homeland Security (DHS), and the National Security Agency (NSA).
iPhone Game Moves to Android
JouleBug is a new iPhone app that we want ported to the Android platform. JouleBug enables users to save money on their energy costs with the extra benefit of taking a little stress off the planet. It is a gameful app where users earn badges and pins for saving energy and other eco-friendly activities. After each accomplishment players are also awarded points and given the opportunity to share with their Friends or Tweet to their followers. In addition to the game mechanics players can link JouleBug to their utility bill and see it displayed graphically on their phone. Our plan for future versions include leaderboards, communities, additional social constructs and more.
The iPhone app communicates with a sophisticated backend. The database is Mongo with Python and Django in the middle. A RESTful API has recently been added to the backend to enable easy integration with outer mobile platforms.
We would like for the this semester’s 492 group to create an Android version of the iPhone game working with the new API. This will require the team to work with Android, HTML5, FaceBook, Twitter and Google+. In addition to mimicking the current version of JouleBug, the Android version should add a few features currently not found in the existing iPhone app, namely:
- Acquire GeoLocation of events
- Profile Page
- Build Version
- Local Notifications(ON|OFF), Delivery Time
1. JouleBug lets users earn badges based on habits they can change:
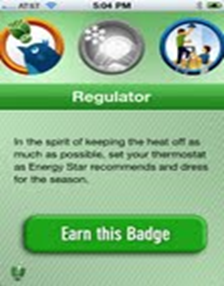
2. JouleBug badges are broken down into pins, which target specific actions users can take:
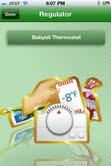
3. Users can do check-ins for each individual pin. Points are awarded and the action the user has taken can be shared:

4. JouleBug allows users to retrieve their power bills and see how playing Joulebug helps save them money:

Analysis & Automation of SCSI Protocol Streams for Test Simulation & Error Injection
Ensuring that the latest SAN storage controller software will interoperate with existing versions of Host OS storage stacks is a major piece of validation work.
Each host (client) will react differently to events on the SAN controller. The reaction is seen as a specific combinations of SCSI (storage specific protocol on a storage fabric) commands, sent from the host OS to the SAN controller. Events on the hosts send out other specific combinations of SCSI protocol commands.
There is a lot of benefit from collecting these combinations of SCSI commands, analyzing their behavior, and automating their execution. These automated tests can provide a good picture of SCSI Interoperability of the SAN software with various Host OS storage stacks prior to being exposed to the actual host software. By injecting the protocol commands into the storage controller, expected behavior versus observed behavior can be measured, and early visibility to product issues can be captured.
Typical types of events include: reboots, core-dump/panic, host OS cluster use cases, cable pulls (yes pulling a cable out :D), and controller failover.
The host OS will be selected from a prioritized list, with Windows and VMWare leading the pack. Linux as an OS will also be considered.
Overview
The project will be have these phases:
- Requirements Phase:
- Identify the SAN software specific list of events.
- Identify the Host OS side list of events.
- Identify the multi-Host cluster use cases.
- Plan and Execute Phase:
- Plan out the test configuration requirements to run thru the SAN software events.
- Execute the planned SAN software Events and collect traces over FCP and iSCSI. Students need to get familiar with the Event first and then capture the traces.
- Plan out the test configuration requirements to run thru the Host OS events.
- Execute the planned SAN software Events and collect traces over FCP and iSCSI. Students need to get familiar with the Event first and then capture the traces.
- Plan out the test configuration requirements to run thru the multi-Host cluster events.
- Execute the planned SAN software Events and collect traces over FCP and iSCSI. Students need to get familiar with the Event first and then capture the traces.
- Analysis Phase:
- Analyze the behavior of the storage controller and host system by evaluating the protocol traces.
- Identify the set of SCSI commands and ordering requirements required to recreate the event on the storage controller.
- Automate Phase:
- Once the list of SCSI commands are verified for correctness, we will need to automate execution of these lists of SCSI commands. This will require that the students are familiar with C and Perl programming, and possibly Python.
- Run the automation execution environment with a storage controller target.
- Project Report:
- Summary of conclusions, analysis, scripting, data, and lessons-learned.
Interactive Node-Link Diagrams using HTML5/WebGL
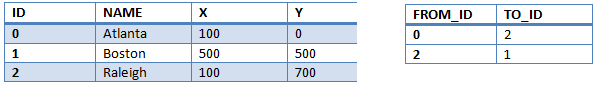
The goal of this project is to investigate the rendering and interactive capabilities of HTML5 in the context of a Node-Link Diagram visualization application. This would require the design and implementation of an HTML5 based software system that provides a highly interactive user experience for exploration and modification of node-link data. The final product should incorporate high quality graphics, animations, and novel user interactions that push the limits of the web technology. This may mean using WebGL to render graphics which will enable the use of 3D displays, animation, and user interaction to assist in navigating large networks. While some of the project structure is well defined there remains room for the team to tailor the project details to concentrate on the problems that are most interesting to them. Sample node-link data will be provided but the team is also free to use additional datasets from relevant real world networks. Simple node and link datasets might have the following structure.
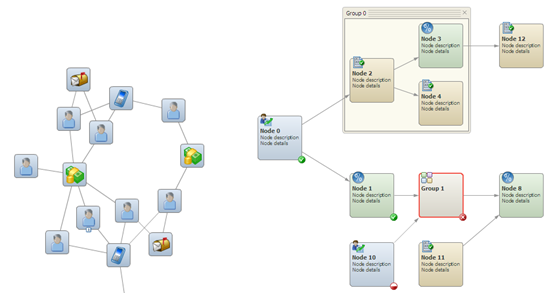
The rendering of a Node-Link Diagram could be simple or complex depending on its intended use. Here are 2 examples; the one on the left showing a network diagram that shows relationships and the one on the right is a process flow diagram.
Influence Finder
Project Overview
The goal of the project is to develop an application which determines who the influencer's are for a given topic within the social networks such as Facebook and Twitter. The influence score should be a representation of how successful a person is at engaging their audience and how big of an impact their messages have on people. Analysis will be performed on a predefined set of customers.
For example: Based a customer list we may want to find influential people who are talking about the iPhone on Twitter. This may be people with high follower counts or a large number of mentions who have posts that reference the iPhone
The influencer analysis should be presented in a visual chart along with the provided customer data. The goal of this chart is to allow users to quickly see who the key influencer are within the social networks for a given topic.
Project Organization
The project will be run within the Agile Scrum framework. Agile development provides the benefits of early and consistent customer engagement. The Teradata representative will serve as the Product Owner for the Scrum team in order to provide application requirements and to assist with backlog grooming and acceptance criteria. Development will occur in two week Sprints. Planning for tasks will occur at the beginning of the Sprint, checkpoints and backlog grooming will be scheduled mid-Sprint and demonstrations of progress will happen at the end of each Sprint in a Sprint review.
Company Background
Teradata Corporation is the world’s largest company solely focused on raising intelligence and achieving enterprise agility through its database software, enterprise data warehousing, data warehouse appliances, consulting, and enterprise analytics. Teradata produces analytical solutions that leverage enterprise intelligence in order to solve customer business problems, including customer management. Customer management is the practice of building, enduring, lasting and profitable relationships. Teradata Relationship Manager, which is developed here in Raleigh is designed specifically to meet the needs of businesses in establishing and maintaining strong customer relationships. The Teradata Corporation has approximately 2400 employees worldwide. In the Raleigh office, Teradata has an organization of 100 employees with 50 software engineers.
Influence Finder Requirements and User Stories
Requirements
- The Influence Finder application will be deployed as a web application and will provide UI to allow a user to add or delete a keyword
- RESTful web services will be used to collect influencer data for a group of customers from Twitter and Facebook based on the keywords.
- The Influence Finder application will provide a mechanism to show the analysis for each of the keywords.
- The Influencer Finder application will provide a mechanism to filter the results to only Facebook or only Twitter.
- The Influence Finder application UI will visually display the results of the analyzed social data along with the customer data on an appealing chart.
User Stories
- As a user, I would like to understand the influential reach that my customers have within the social networks based on a keyword search.
- As a user, I would like to define the keywords to run analysis on.
- As a user, I would like to see a chart(s) displaying the social influence score along with other known customer data.
- As a user, I would like to be able to filter the data displayed on the charts to either only Facebook or Twitter
Twitter for Transit
Project Description
TransLoc was formed by NCSU students with the goal of revolutionizing campus transit. Today, universities all over the country use the technology first used here on the Wolfline.
Continuing innovation of campus and public transit, we are looking to create an easy way for riders to communicate with each other about delays, accidents and other out of the ordinary situations. We need a mobile app (iPhone and Android) and a web service that will allow riders to find stops and routes near them, read what others have posted recently and add their own messages. This app needs to be intuitive and be very easy to use so that riders who are bored waiting for their bus will be compelled to tell others what is going on. Some specific features we would like to see in the mobile app:
- Locate stops and routes near the rider using the phone's built-in GPS;
- Quickly view messages from other users about the route;
- Add new messages and attach them to the stop/route, and quickly indicate what is going on from a predefined list of events (bus is late, bus just passed me, etc); and
- Keep track of how many messages and of what type each user has added, and assign karma points based on them.
In addition to creating the app, you will also create the web-based RESTful service which will store and manage all the user and transit data. We need for it to be highly scalable so that we can launch this service for all the riders at once all over the world.
This project has the potential to revolutionize how riders use transit systems and communicate with each other. It will help them avoid routes that are running with delays or leave earlier to catch the bus that's coming early.
This project will use PhoneGap (JavaScript/CSS/HTML) for the cross-platform mobile development, Node.js for server-side code, and MongoDB for data storage all running on Linux servers.
Wolfline, how do I get to my class?
Thanks to TransLoc’s Wolfline tracking system (which no doubt you use every day), you already know the exact location of your bus. Need to get to Glenwood South Friday night? Just pull up the live map a little before you need to be there and spot your bus. Want to catch the latest release at Whiterspoon Campus Cinema? Do the same. Have to rush to D.H. Hill to meet your study partners? Easy. The live tracking has made you a savy Wolfline rider.
But what if you are new to campus? How do you know that a bus will even go to Glenwood South on a Friday night? Naturally, you’d start pulling up online maps and compare the various route timetables until you get a sense of which buses you’ll need to catch and when. That’s tedious.
The good news is that Google Maps can tell you this. Put in your desired destination and when you’d like to be there and it will tell you how to get there. Wonderful!
Wait, not so fast. If you didn’t know that Google Maps could do this then you already know the first problem with relying on Google Maps: very few people know that you can do this. Furthermore, it’s not integrated into the TransLoc map, mobile apps and mobile web site so it makes for a poor user experience (who wants to go to a separate web site?).
Another problem is that Google Maps can be quirky, such as telling you to switch from the Wolfprowl to the Wolfprowl at D.H. Hill. (Wait, what?!?)
And the big one: most of our customers will never show up in Google Maps because Google doesn’t accept bus systems that are for students only and not open to the general public.
We would like to offer our riders the ability to get their A to B directions in a seamless, intuitive, friendly and quirk free manner. This is where you come in.
The good news is that a number of open source projects have sprung up to solve this issue. You will survey the landscape and integrate the most suitable project into TransLoc’s system. As part of this project you will figure out how to get the chosen system to work with our data by building the necessary data connectors between the two systems.
You will even get the opportunity to beef up your open source street cred by contributing back to the community when you enhance the chosen system to meet the needs of the project.
Don’t let your fellow classmates remain clueless on how to take the bus to get to the bar (ahem, class), show them the way!
Database Management System for Monitoring the Effect of Climate on Wildlife Interactions
Background
Transmission of infectious diseases between animals is a function of proximity (spatial interactions) and length of exposure (temporal interactions) of the animals. While many factors can influence these interactions, extreme shifts in climatic conditions can alter how animals use landscapes, potentially creating unusual assemblages that favor direct disease transmission. Diverse technology exists to determine animal movements and to collect weather information. However, to date, the organization and integration of these data sources make it difficult to study animal disease transmission. The amount of data collected from each area of interest is often overwhelming for investigators, especially those collected via GPS units at the rate needed for point accuracy. Data management complexity is daunting when attempts are made to merge these huge data sets from different sources to address questions related to disease transmission.
To make this task manageable, the large amount of data from varying sources must be integrated and analyzed in a systematic, standardized manner. Current technology allows near-real time data collection. These data streams need to be processed in near real-time as well, and stored in a way that they can be imported into multiple software analysis programs. Most investigators rely on flat files or file processing systems to organize, store, and process data files formatted as XLS, CSV, or KML. Researchers criticize this approach because the data is stored in many different files, formats, and each is organized in a different way. Each file is specialized and can only be used in a specific application and often by only one user. Processing of these files, consequently, is bulky, costly and nonflexible, especially when it comes to supplying needed data analysis promptly and accurately. Data redundancy is also an issue as are a lack of data integration and security. For these reasons, a database management approach needs to be defined so that there can be common standards for interoperability in data exchange and software use.
The database management system needs to be designed for long-term, high volume storage and must be able to integrate data from multiple sources and handle real-time, multi-user data retrieval. Extracted data should also be directly importable in the correct format through automated data processing into a wide range of applications to answer questions posed by the researcher.
Project
The goal of this project will be to create a database management system for integrating near-real time data related to animal movement with topographic maps and streaming weather station data. There will need to be automated data processing of the tracking data for point accuracy, calculations for animal interactions, and program-specific file formatting issues. There should be a user-friendly, data-entry GUI for describing a new study and uploading data from an external drive as well as the automated data retrieval. The information in the database should be linked in a way that it can be queried by multiple users and programs, as needed, to answer specific research questions.
Requirements
Input
There are four different data sources that will be imported into the DBMS. The four different sources are cell tower-based, a custom wireless sensor network, weather stations, and county-based topographic maps. The database should be set up to permit scheduled, automated data retrieval from each source with an option to upload data from an external drive in the case of network failure of a source or sources. Types of data include animal locations (GPS), other animal-attached sensors, weather information, and topographic maps.
Data Sources:
Cell tower: Lotek GPS Wildcell devices are currently deployed on coyote and deer at Fort Bragg (http://www.lotek.com/wildcell.htm).
A custom wireless sensor network (WSN) developed at NC State for monitoring wildlife interactions with their environment through the cooperation of the Computer Science Department, College of Veterinary Medicine, Program for Fisheries, Wildlife, and Conservation Medicine along with the Southeastern Climate Science Center.
Weather station data located in the proximity of testing sites will be directly streamed to the database through the cooperation of the State Climate Office of North Carolina.
Topographic maps can be uploaded from the county websites.
Types of Data:
Location data for individual animals is being collected utilizing GPS. The information received includes timestamp, animal identification, latitude, and longitude.
Animal-attached sensor data will come from the WSN and include temperature, light, and relative humidity, each with an accompanying timestamp
Weather data: The station that is closest to the animal’s location at that point in time should be linked and recorded as such. The weather data will have a timestamp and include variables such as ambient temperature, humidity, soil temperature, and wind.
Outputs need to be linked to GPS data for visualization in geographic information systems such as ArcGIS
Data Relations
Direct interaction data will be calculated from collected position data. Automated processing of GPS readings within the database will derive the interaction data for coyote, deer and other tracked animals. Interaction data include distance between animals and/or resources of interest, estimated length of contact at said distance, date and time of day of interaction, and number of interactions between parties.
All of the information stored into the database should be linked in a manner that allows for querying based on date, time of day, location, sensors, species, sex, and animal ID. Hardware identification of animals should be linked to user-defined naming conventions for ease of querying and identification, e.g. Deer1 or Coyote3. Due to the nature of the data, the database will need to be both spatially and temporally linked. All data should be based on GPS coordinates so that it may be displayed over topographic maps with accompanying information located in attribute tables. To fully appreciate the interaction data derived, the database must also be temporally linked or link-able.
User-Interface
There are a few points in the database management system where the researcher plays an important role in either relaying information or retrieving it. At these points of contact, there should be a user-friendly GUI to help guide the investigator through the process. Regarding data-entry, there should be a GUI for describing a new study, identifying the program with which the researcher wishes to view the data. The GUI will permit selection of a spatially or temporally based study, and further guide the user through the data extraction process. Currently, spatial data is being viewed in ArcGIS for data manipulation and spatial analysis. Temporal interaction data does not currently have a visualization method and is open for discussion.
Keeping Track of Test Specifications
We use a relational database tool (PQM) to manage test protocols against risk analyses. Because PQM is not easy to modify, test protocols are printed and updated in Word when changes are made. Then all changes in Word are manually transcribed into our PQM tool. This process is inefficient and error prone; we would like to find a way to improve it.
A tool to automate this could be designed as follows:
- Read Word test protocol files generated by our quality management tool to extract test specifications (identified by Bookmarks)
- Access appropriate business test objects defined in our relational database
- Compare the test business objects with the information in Word test protocol files (the tool needs to be able to extract changes, additions & deletions)
- Update test protocols in our database to ensure that manually updated Word test protocols are aligned with the content of our database.
The development framework is as follows:
The programming of the new tool would be done in Java. The JBoss app server provides access services to PQM. An appropriate Java package to access Word files must be identified.
Company Profile
Werum Software & Systems is the worldwide leading supplier of Manufacturing Execution Systems (MES) for the pharmaceutical and biopharmaceutical industries.
Project Archives
| 2026 | Spring | Fall | |
| 2025 | Spring | Fall | |
| 2024 | Spring | Fall | |
| 2023 | Spring | Fall | |
| 2022 | Spring | Fall | |
| 2021 | Spring | Fall | |
| 2020 | Spring | Fall | |
| 2019 | Spring | Fall | |
| 2018 | Spring | Fall | |
| 2017 | Spring | Fall | |
| 2016 | Spring | Fall | |
| 2015 | Spring | Fall | |
| 2014 | Spring | Fall | |
| 2013 | Spring | Fall | |
| 2012 | Spring | Fall | |
| 2011 | Spring | Fall | |
| 2010 | Spring | Fall | |
| 2009 | Spring | Fall | |
| 2008 | Spring | Fall | |
| 2007 | Spring | Fall | Summer |
| 2006 | Spring | Fall | |
| 2005 | Spring | Fall | |
| 2004 | Spring | Fall | Summer |
| 2003 | Spring | Fall | |
| 2002 | Spring | Fall | |
| 2001 | Spring | Fall |