Projects – Spring 2011
Click on a project to read its description.
Project Management Tool
Background
The AT&T team Raleigh includes 16 software developers who perform a variety of development projects. Some of these projects can take as little as a few hours, while some can take months. We receive requests for projects from a very large user base within AT&T. Many of these projects require a very quick turnaround while others can be developed as resources become available. The developers have a wide variety of programming skills. Some are versed in Perl, others in PHP, Flex, and many others. Many can develop in multiple languages, but not all of the languages and not on all of the platforms that are used in AT&T. These complexities cause many issues in project management and development resource management. One of the priorities of our group in AT&T in 2011 is to provide greater visibility to projects being worked and to the availability of resources to work new projects. We have to be able to clearly show our stakeholders our available resources and also what happens when we commit to a new project.
Project Description
We are proposing a project that would allow AT&T to better handle managing development resources. This tool would need to have several different capabilities. The first capability will be to display a timeline (much like a Gantt chart) of existing projects and allow users to add in new projects to the timeline. The second capability is a need to manage the resource pool of developers. When a new project is added to the timeline, then the available resources during that timeframe will go down. The tool will need to be able to calculate if an unavailable resource (either a person or a pool of resources) prevents project completion during the requested timeframe. Finally, reporting will need to be available so the AT&T management team can see resource utilization and see areas where additional resources might be needed or where resources are under utilized (based on the resource pool).
Benefit to NC State Students
This project will require use of many different programming languages and platforms. Information about the projects such as due dates, timeframes, and others will need to be stored in a database. A user interface will need to be created to display the data and allow users to drag and drop in new projects to allow for the forecasting functionality.
Benefit to AT&T
This tool is in great demand at AT&T. The ability to plan projects based on the available resource pool will allow us to meet several key goals in 2011. Our team within AT&T must allow our stakeholders to see the projects that are being worked by the development team, and also must allow the stakeholders to see the impact a new project request has on the development resources available to work new projects.
GPS Based Geo-location Software Infrastructure for GPS Based Location Services on a Mobile Router
Summary
The goal of this project is to deliver a GPS based geo-location software infrastructure for GPS based location services on a mobile router. The infrastructure enables defining, triggering, and processing geo-location based events on a mobile router.
A simple example of the use of such infrastructure is in asset protection (when a router is moved from an authorized location, the router automatically disables itself until such time it is returned to an authorized service center).
Goals/Objectives
- Develop an Application that defines a geographical area(s) as an irregular enclosed polygon or a set of non-contiguous enclosed polygons and provides an abstract mathematical representation of the enclosed polygon.
- Develop a service that polls GPS at a short programmable interval to detect current position of mobile router.
- Develop an evaluation function that uses two dimensional computational geometry to determine whether or not the current geo-location point is within one or more of the previously defined polygons.
- Develop an event triggering processing system. This is used to generate application events. The following include some examples:
- When the location of a mobile router leaves its geographical region (GEO-Fence) as defined by a geo-location polygon, a trigger can be used to destroy its configuration or other sensitive security information.
- A mobile router in rental core can use this event system to trigger a vehicle shutdown once a rental car has left its predefined geographical boundary. This triggering mechanism can also be used to notify the rental company that the vehicle has been disabled and to provide the vehicles exact physical location.
- Develop an example event based system that is triggered by position changes. When the current point transitions from being inside or outside of a previously defined polygon, a pre-defined event is triggered.
Crumbs Automated Music Metadata
Crumbs Music Media is an e-commerce start up whose goal is to provide an internet platform to identify, mentor, promote and encourage new and emerging global talent. The Crumbs vision is to extend Indie music social networks to a one-stop global music media aggregator. To establish a comprehensive, pre-cleared, ‘click & go’ catalog of rights for the media and entertainment industries, the Crumbs twist to similar sites is an easily accessible pre-cleared rate card delivered by a cutting edge, quality driven search engine. Based on fan and industry feedback Crumbs will assist its most popular Crumbs members, artists and music related talent alike, to the next level needed to further their career.
The first components of the new Crumbs social network are software tools to implement basic functions into the prototype network. Two tools are envisioned: 1) a subsystem to gather and store metadata from MP3 files, and 2) a digital jukebox. Technical specifications for each of these components are listed below.
Ideas for the “look & feel” of the website and designs for the custom search engine are encouraged, but not required.
Crumbs Automated Music Metadata
A subsystem for gathering and storing metadata from MP3 files.
Specifications
- Drop folder driven ingest of data: MP3 files are copied to a set folder and the service automatically scrubs the file, stores the data, and moves the file to 'stored' location.
- Database tables for storing metadata
- These should be set up to be easily extended
- Metadata fields
- Title
- Artist
- BPM
- Genre (see attachment for subset of field values)
- Mood (see attachment for subset of field values)
- Instrumental vs. Vocal
- Using a “plug-in” interface for the tools that analyze the files. Each plug-in would be an external library.
- Define extensible interface for plug-in development
- Create 2 plug-ins using this interface. (BPM and ID3 reader should be simple to implement using existing free tools)
- GUI to add and remove plug-ins using some sort of registration process.
Optional additions
- Web interface for displaying metadata.
- Web interface for searching based on metadata
Suggested tools
- LAMP stack
- jMIR (or similar) library interfaced for metadata gathering.
- Id3lib Linux library for reading ID3 tags.
Crumbs Digital Jukebox
A Point of Presence for music - Free, user selected, play-listed songs from computer 'kiosk' interface.
Specifications
- Currently playing song is default display
- Automatically runs at computer start up
- Normal users should not be able to exit the app. No general access to underlying OS.
- Interface for queuing song selections for playback
- Auto queuing during times of inactivity
- 'Free text' search of available music for queuing selection (metrics preloaded at the same time as music: title, artist, genre, etc)
- Database driven music library
- MP3 format is all that needs to be supported
- Database tables for storing playback metrics (Entry per play back: time, date, song index, etc)
- Playlist should continue in background while queuing or ingesting (if applicable) operations are taking place
- Store playback data for later mining
Optional additions
- User level security – login required for use.
- No back-to-back queue entries by the same user
- Stored user ID with playback request data
- User ingested music
- User ID tagged on ingested music
- USB key only
- Only MP3 format files shown on ingest screen
- Metrics requested upon ingest
Suggested tools
- LAMP stack
- ALSA or OSS for MP3 decoding (see Mplayer, Alsaplayer, ffmpeg for examples)
Mobile 3D & Gesture-Based Account Viewer
Deutsche Bank has a competitive interest in providing accurate up-to-date information about a customer’s funds under management by the bank. In particular, the Global Banking division maintains for its customers a variety of different accounts in different currencies held in different countries around the globe. A customer will both receive funds into and make payments through these accounts, transferring funds from one currency and/or country to another.
An example of such a customer would be Acme, Inc. The Acme, Inc. Store collects funds in multiple currencies and countries and makes payments to application developers in different currencies and countries. Given the volume of payments, currencies and accounts, it can be overwhelming for the financial office of a corporation, such as Acme, Inc., to keep up with the cash flow management. The number of accounts which a single customer may maintain can exceed over a 1000 worldwide.
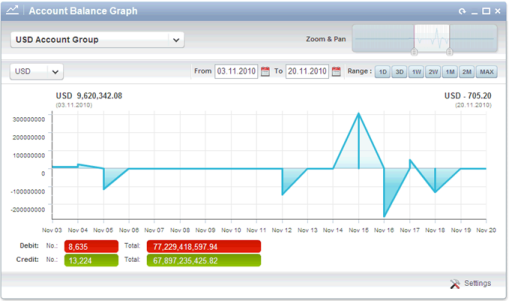
In the current environment, a customer’s fund activity can be illustrated visually through a 2D visualization done in Flex/Flash. The bank needs to extend and expand this capability to provide customer’s financial officers the means to visualize fund information in a way that optimizes their ability to manage transaction processing and maximize cash flow. As businesses become more global and agile, they need to access and manage this information on a more frequent basis. Additionally, customers now expect and require these capabilities on smart mobile devices, leveraging gesture-based interaction capabilities.
The goal of this project is to design and develop mobile-based, multi-currency, multi-account, multi-timeframe summary viewing capability for global cash accounts. In particular, we wish to take advantage of advanced mobile features including 3D visualization and gesture-based interaction in order to provide the customer with elegant yet efficient view of their information.
Some of the features we see as possible include
- Ability to slide through multiple account groups
- Ability to create a view for a given time slice
- Ability to drill in to an area to refine the details of the account information
- Ability to see multiple accounts in different currencies simultaneously
For this project, we look to use an Agile User Experience-based development model. The team will be provided a “Persona” of a typical user. This will describe how the user uses the account information in their day-to-day activities. The team will be expected to leverage all available university resources to provide a wireframe concept, including a functional description of the interaction between the user and the user interface. This will then be reviewed by a mock customer base from DB and feedback will be provided back to the team. Once the wireframe is approved, an initial concept sprint will generate a prototype. This will then be submitted for customer feedback and refinement. Finally, the team will then be expected to create an operational software program, adding working features in a sprint model. In this model, an operational application will come out of each sprint in a continuous integration environment.
The team will be provided the following inputs to the design process
- A Persona with typical usage of the visualized information
- Simulators for the mobile device of choice
- Mobile device for final testing
- Mock data in database format capable of use with desktop computers
- Access to a hosted Agile tracking tool for use during the project
- Initial Agile training from a DB Agile Scrum Master
Test Environment Manager
The Smart Grid Systems division at Duke Energy regularly has multiple projects in progress. These projects depend on the availability of test environments to be completed successfully. Test environment allocations have to be carefully coordinated so that project needs are met. The students will design a system that will help manage test environment requests and assignments. The system will maintain a list of all test environments that are available, along with their specifications; allow project managers to request environments; track test environment assignments in chart form; provide functionality to schedule test environments (match available environments to requests); and send alerts when environment maintenance is needed. In addition, the students will implement functionality so that the system will intelligently schedule test environments, based on current assignments, availability, and requests. The system should be web-based with a SQL server database, and implemented in either .Net/C# or Java. An additional challenge will be to make the system compatible with a Blackberry.
Dump Analysis Tool
Background
Celerra is the brand name of EMC’s Network Attached Storage (NAS) products. These products are designed to provide network-based access to files over a number of network protocols (CIFS, NFS, ftp, http). Celerra systems range in size from small systems supporting dozens of users to large, enterprise wide systems supporting thousands of users.
In our RTP Software Development Center we develop a wide range of software for Celerra. Our group is responsible for the DART Kernel, a proprietary real-time operating system that runs on Intel ix86 based storage processors. One of the tasks developers on the team do on a regular basis is analyzing dump files to determine the cause of the software fault that crashed the system. Is it common for a single problem in the code to result in dozens of crashes on multiple tests (e.g., all testing the same version) and the result is many dump files for the team to analyze.
The project is to build a tool that will do preliminary analysis on the crash to look for duplicates or related crashes. The tool takes as input materials collected from the crash, and then extracts the relevant information, stores the information, and searches the repository looking for matches. As output it would return a list of all the potential matches for the developer to review.
Project Scope
Dump analysis is a complex process and we are not expecting this tool to replace the need for developers to do custom analysis. Today developers look for duplicate or related dumps using a full-text search on our bug database as part of the triage process. The desire is to design and build a tool that will assist the triage teams in looking for duplicate and related issues as the first step in evaluating a new problem report. The team will have considerable flexibility in the scope of the project as well as the tools used to implement it, however, we do have the following requirements:
- Our development environment is based on Linux and open source tools, so the Dump Analysis Tool should be developed on the Linux OS and using freely available open source tools.
- The tool’s primary user interface will be via a command line so it can be integrated into our bug tracking system via scripts and cron jobs.
- The tool will build a repository of information collected from all the dumps it has processed to be used to look for duplicate problems. The team can choose to use a freely available open source database or create a custom file based solution.
- The mechanism for duplicate and related issues should be based on parsing and comparing stack trace backs from dump files. Additional information may be used to improve the results if so desired by the design team.
Materials Provided
- A collection of data files to be used as input to the tool will be provided on one or more external hard drive(s). These files can be used to build the repository and can be used to test the tool’s ability to find duplicates and related issues.
- Consulting from developers on how to interpret a stack trace back and recommendations on how they can be compared to each other.
Benefits to NC State Students
This project provides an opportunity to attack a real life problem covering the full engineering spectrum from requirements gathering, to research, to design, and finally implementation. This project will provide opportunities for creativity and innovation. EMC will work with the team closely to provide guidance and give customer feedback as necessary to maintain project scope and size. The project will give team members an exposure to commercial software development.
Benefits to EMC
The Kernel developers at EMC spend considerable time doing triage on dump files to determine who is responsible for the problem and looking for duplications and related issues. If successful this tool will help automate some of the initial work, allowing the developers to spend less time searching our AR data base and more time ‘busting the dump’ to figure out what went wrong! Further, the tool would also be useful to the Escalation Engineering and support organizations to find duplicate footprints for issues coming in from our customers.
Company Background
EMC Corporation is the world's leading developer and provider of information infrastructure technology and solutions. We help organizations of every size around the world keep their most essential digital information protected, secure, and continuously available.
We are among the 10 most valuable IT product companies in the world. We are driven to perform, to partner, to execute. We go about our jobs with a passion for delivering results that exceed our customers' expectations for quality, service, innovation, and interaction. We pride ourselves on doing what's right and on putting our customers' best interests first. We lead change and change to lead. We are devoted to advancing our people, customers, industry, and community. We say what we mean and do what we say. We are EMC, where information lives.
We help enterprises of all sizes manage their growing volumes of information—from creation to disposal—according to its changing value to the business through information lifecycle management (ILM) strategies. We combine our best-of-breed platforms, software, and services into high-value, low-risk information infrastructure solutions that help organizations maximize the value of their information assets, improve service levels, lower costs, react quickly to change, achieve compliance with regulations, protect information from loss and unauthorized access, and manage and automate more of their overall infrastructure. These solutions integrate networked storage technologies, storage systems, software, and services.
EMC's mission is to help organizations of all sizes get the most value from their information and their relationships with our company.
The Research Triangle Park Software Design Center is an EMC software design center. We develop world-class software that is used in our NAS, SAN, and storage management products.
EMC where information lives.
Locality of Reference in I/O Patterns
Background
The performance of disk IO operations depends on several factors. One of the hardest to quantify is locality of reference, or the idea that some data is more likely to be accessed than other data because data near it has also been used. Stated another way it is the tendency for application IO to cluster within a set of blocks that is smaller than the total addressable space on disk.
As an example, consider a folder containing a set of files. The files that were most heavily used yesterday are likely to be heavily used today as well – and if one block in a file is accessed, then it is reasonable to assume that others will be as well. Hence the number of IO hits on a given block will cluster in space on the disk, as well as in time.
Tools exist to trace such IO activity at various low levels of the IO stack. There are no good tools to examine how I/O patterns move across logical address ranges & how those patterns change over time. A logical address range can consist of multiple disks, each of different size & speed, and multiple RAID configurations bound into a logical entity (often called a LUN for logical unit). Today, the analysis of this type of information is very manual, and very time consuming.
Project Objective
Create a tool that can import and analyze several types of IO activity traces (traces will be provided) based on storage usage. The tool should contain a mechanism to easily add other trace formats as needed. From this data the following output will need to be generated.
- Read/Write ratio of working set
- Total size of working set
- Size of working set for various IO percentages:
- Example – if the total working set for the trace is 100GB we may find that the following is true:
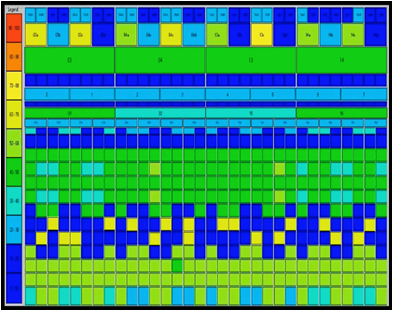
Working Set Size Percentage of IO in this set 100GB 100% 80GB 95% … … 10GB 50% - Visualizations of IO access patterns. This will likely be some sort of heat map. An example of one type of heat map is shown below to give some idea.
The data aggregations above already have a spatial component built into them. The aggregation size will need to be configurable. Most trace tools will show sector granularity (512 bytes) – the tool will need to be configurable to show from this level up to 1GB of spatial granularity. For example 8kb granularity would be a common request due to the prevalence of applications that use 8kb as their working block size. For the same reason 4kb, and 64kb are also common sizes for analysis.
Tracing tools also tend to collect data for more than one disk object at a time – the tool will need to be able to handle these separately as well as in aggregate. For example let’s assume that the tracing tool was monitoring five disks. Four of them contain database files, and one contains a transaction log. The first four disks may need to be examined together, but the fifth would need to be examined separately.
In addition the access patterns may change over time. All of the analysis should be able to be applied to the whole set of data, or to any temporal sub-region on demand. For example a trace may contain 24 hours of data, but we are only interested in the 8 hours corresponding to a working day – or only the hours that represent the non-working day.
Finally the time aggregation needs to be configurable, and displayed in series. We may want to see what happens each hour, using the example above:
| Working Set Size | Percentage of IO in this set (8:00-9:00) | Percentage of IO in this set (9:00-10:00) | … | Percentage of IO in this set (17:00-18:00) |
| 100GB | 100% | 100% | … | 100% |
| 80GB | 95% | 80% | … | 70% |
| … | … | … | … | … |
| 10GB | 50% | 50% | … | 50% |
The time aggregation period (1 hour in the example) should be configurable from 1 second up to the max size of the sample.
Tool inputs:
- Data set location
- Time interval (region or all)
- Time aggregation (1 second to region size)
- Aggregation size (size of blocks to be examined) (1sector to 2GB) – minimum bound will be determined by input granularity
- Analysis based on Read-only data, Write-only or Mixed (read/write)
Deliverables
We require a working tool that will ingest given data sets and produce the described data sets graphically and in an exportable format. Also, we need associated documentation explaining the construction of the tool and how to use it along with the source code and build instructions.
Materials Provided
EMC will provide sample workload traces and technical assistance on use cases.
Benefits to NC State Students
This project provides an opportunity to attack a real life problem covering the full engineering spectrum from requirements gathering, to research, to design, and finally implementation. This project will provide several opportunities for creativity and innovation. EMC will work with the team closely to provide guidance and give customer feedback as necessary to maintain project scope and size. The project will give team members an exposure to commercial software development.
Benefits to EMC
This tool, once complete, will allow EMC engineers to visually see how locality of reference changes during performance and stress benchmark evaluation. We will be able to use the data from this tool to better tune systems and storage algorithms.
Company Background
EMC Corporation is the world's leading developer and provider of information infrastructure technology and solutions. We help organizations of every size around the world keep their most essential digital information protected, secure, and continuously available.
We are among the 10 most valuable IT product companies in the world. We are driven to perform, to partner, to execute. We go about our jobs with a passion for delivering results that exceed our customers' expectations for quality, service, innovation, and interaction. We pride ourselves on doing what's right and on putting our customers' best interests first. We lead change and change to lead. We are devoted to advancing our people, customers, industry, and community. We say what we mean and do what we say. We are EMC, where information lives.
We help enterprises of all sizes manage their growing volumes of information—from creation to disposal—according to its changing value to the business through information lifecycle management (ILM) strategies. We combine our best-of-breed platforms, software, and services into high-value, low-risk information infrastructure solutions that help organizations maximize the value of their information assets, improve service levels, lower costs, react quickly to change, achieve compliance with regulations, protect information from loss and unauthorized access, and manage and automate more of their overall infrastructure. These solutions integrate networked storage technologies, storage systems, software, and services.
EMC's mission is to help organizations of all sizes get the most value from their information and their relationships with our company.
The Research Triangle Park Software Design Center is an EMC software design center. We develop world-class software that is used in our NAS, SAN, and storage management products.
EMC where information lives.
Data Sculpting
One of the key challenges in providing rapid testing services to the Personal & Workplace Investing IT organization is the availability of data to be used in executing tests. A common method for approaching this issue is to "data mine" large amounts of data from production and copy it into test environments. An alternative to data mining is to sculpt data to suit the test's needs. This has several advantages, including rapid creation of data, and reduced risk of exposure to confidential information. This project's goal would be to design and build a highly-configurable tool which would allow us to specify rules about how data should be created and could then randomly generate data which met the rules. Such a tool should insert the records directly into the database, making new data instantaneously available for testing.
Migration Predictability via Data Analysis
Background
Data management systems are always improving. Companies continually look to new sophisticated systems to reduce time-to-market and increase productivity. Likewise, data authoring systems are becoming more sophisticated and complex. And companies look to these application systems for product improvements. To effectively utilize the most up-to-date applications and manage the data in the newest data management systems, companies must migrate their complex application data from existing systems to the new systems. This data migration must be secure and predictable. The basis of this project is to improve the time predictability of migration projects.
Description
- Create a framework that will a) analyze the data and organize it into a load order, b) split the load order into load sets, and c) estimate load times given historical empirical data.
- With a provided set of data, use different preferences and analysis algorithms to test different load combinations and predict the overall load times.
- Provide comparisons between different combinations of load sets and load orders.
Load order and load sets must be determined based on a set of rules and preferences. The rules will be consistent across all load orders but preferences can change. The team is free to create algorithms that adhere to the rules and preferences, as well as change or create other preferences that test additional load combinations. The data will represent CAD files and their complex interrelationships. The data can be represented as a forest of interrelated trees or a graph structure. The amount of data represented may range from hundreds of files to hundreds of thousands of files. Preferences will be provided that will require the loads to be split into load sets. Load sets allow for parallel loading across multiple processes with little or no dependency across load sets.
Here is an example of the data that needs to be analyzed:
A company, Acme Cellular makes mobile phones. They have files that describe the parts of the phone. There will be one file for each unique part. There will also be one file for each sub-assembly. A sub-assembly is a group of parts that are assembled and inventoried but do not make up the entire product, the "motherboard" for example.
A sub-assembly, depends upon all of the components (chips, etc) that are attached to it. Each of the components will be represented by a file. The motherboard sub-assembly depends upon all of the components that make it up. When migrating this data, the components (chips) must be loaded first before the sub-assembly (motherboard).
Some parts, the keys for example, may be used in all of the phones within a product family. There will only be one file for each key, but that key will be used in 5 different phones (assemblies). The data analysis problem is to a) take all of the files and organize them into sets such that any file (such as a file that describes the "5" key) only appears in one set; then b) order each set so that the dependent files (chips) precede the sub-assemblies (motherboard) which precedes the final assembly (mobile phone).
There may be more advanced preferences, such as only n number of files can be in one set, but let's not bring in that level of difficulty until we are ready for it.
The prediction aspect of the project will take the load sets and apply some duration rules to estimate load times. In the real world we would want that system to become a "learning" system where the accuracy of future load times would be improved by analyzing the actual load times or earlier load sets (but that would be a follow on project).
There are both explicit and implicit relationships within the data. This project should only deal with the explicit relationships as to not overload the project. The explicit relationships will be defined in a file provided to the team. (In the real world those relations are determined by examining the sub-assembly and extract the names of the components that go into it)
Requirements
- Data will be given as a set of comma delimited files. One file contains information about the CAD files and another file will contain information about the explicit relationships between the files.
- At least two distinctly different load combinations must be tested. Two sets of preferences will be provided which should yield very different load combinations. Testing of other load combinations will be encouraged.
- Provide a user interface to set preferences, initiate the analysis, and display the results.
- Have the ability to compare results from different test runs.
- A stretch goal is to support not only explicit relationships between the files but implicit relationships based upon attributes associated with the file.
Enabling Technologies
- Database, Apache Derby preferred
- Data structure analysis (graph, tree or other suitable analysis)
- Java
- Adobe Flex, preferred user interface platform
Sponsor Background
Since 1984, I-Cubed has provided the people, products and processes to extend the value of customer’s enterprise systems. The company's subject matter expertise in Enterprise Applications, Product Lifecycle Management Consulting, Business Process Consulting and Rights Management provides a unique insight that translates customer needs into commercial products. I-Cubed's product and services portfolio helps customers accelerate the integration of enterprise systems and collaborate securely throughout the supply chain. I-Cubed has been sponsoring senior design projects for more than 10 years. I-Cubed’s office is conveniently located on NC State’s Centennial campus in Venture II.
CAD CAM App Store
Background
The CAD CAM and PLM industry is an over $20 billion dollar industry. The majority of the technology servicing this market is provided by 3 key vendors. This leaves a significant gap in coverage for niche solutions as these large providers are slow to adopt new technology. The gaps in technology have provided opportunity for smaller vendors to create value added solutions to serve the market. To date there is no centralized distribution method for deploying these technologies.
Project Description
Develop a web package template which provides specific software store functionality similar to the Apple App store and the android market. We will create a community portal that allows users to download and buy technology, provide feedback and feature input, as well as post new ideas. This site should have a location for 3rd party advertisements, featured applications and the ability for users to upload their own applications for distribution.
Project Requirements
Site general
- Browse applications, highlight featured applications by number of downloads
- Secure login to download or post comments
- Ability to support 3rd party advertisements
- Forum type communication capability
User / Consumer -
- Sign up an register for account
- Download applications
- Enter credit card information and buy software (Merchant account will be handled by I-Cubed)
- Provide feedback and register feedback on each product
- View products in terms of popularity, sort products by some applicability filters
- CAD Tool
- PLM System
- Roles
User / Technology provider
- Post products and services
- Post white papers
- Sell products and technology
Delivery
This project should be delivered in template form. In addition to being a fully functioning site for I-Cubed, it is important for our web development partner to be able to reuse this IP. The design and implementation of this system should include an ability to re-purpose for different organizations.
SponsorBackground
Since 1984, I-Cubed has provided the people, products and processes to extend the value of customer’s enterprise systems. The company's subject matter expertise in Enterprise Applications, Product Lifecycle Management Consulting, Business Process Consulting and Rights Management provides a unique insight that translates customer needs into commercial products. I-Cubed's product and services portfolio helps customers accelerate the integration of enterprise systems and collaborate securely throughout the supply chain. I-Cubed has been sponsoring senior design projects for more than 10 years. I-Cubed’s office is conveniently located on NC State’s Centennial campus in Venture II.
Exploring the Application of Intel’s Trusted Computing Technologies Background
Modern computing systems are built with a large Trusted Computing Base (TCB) including complex operating systems, applications, and hardware. The TCB provides security and protection services for both data and processes within a computer system. Because the TCB lies at the lowest layer of the software stack, compromising any portion of the TCB will result in compromising the security of the entire system, and sensitive information input to the machine is no longer protected. Given the size and complexity of the TCB in modern computers, it is very difficult to provide adequate protection to the TCB from attack and ultimately provide protection to the entire computer system.
Much of the world we live in today is enabled by computer systems and those systems rely upon the TCB for protection of their critical processes and data. Any vulnerability found within the TCB might affect the entire system and anything that depends upon it. The impact of a vulnerability can be as simple as disclosure of financial information or as complex as a power outage due to failure of a control system.
Project Purpose
The intent of this project is to create an alternate execution environment for the sole purpose of protecting critical system information. This alternate execution environment will be built upon a minimal TCB and will only leverage the hardware portion of the TCB.
Project Statement
This project will seek to improve the security of critical data by leveraging the features of Intel’s Trusted Execution Technology (TXT) and Trusted Platform Modules (TPMs). This project will use Flicker, a dynamic software environment with a minimal TCB developed by Carnegie Mellon University (CMU), to store and protect critical data from the O.S. This software environment is not intended to replace conventional systems; rather it is intended to operate in conjunction with conventional systems while providing an additional level of protection to sensitive data previously unavailable. This design requirement to operate in conjunction with a conventional O.S. dictates that an Application Programmers Interface (API) must also be developed to provide a controlled interface between the trusted software module and the running O.S.
Specifically, the project will involve:
- Suspending all activity on the computer and turning control over to a trusted software module
- Resuming a running O.S. and restoring all associated system data
- Implementing a cryptographic routine not natively supported by the TPM
- Integrating the developed cryptographic routine with the trusted software module
- Developing a process to authenticate the user and application to the trusted software module
- Integrating the developed module with a VPN application
Project Deliverables
This project will include the following deliverables:
- All developed Source code
- Documentation covering the design, implementation, and lessons learned from the project
- A demonstration showcasing an application utilizing the trusted module to provide protected access to sensitive data
- A technical presentation covering the design and implementation of the trusted software module
- A written paper (optional academic paper for submission to a workshop)
Benefit to Students
Students will learn a great deal about the details of modern x86 architectures, developing low-level code, computer software security concepts, and current research challenges in the field of security. Of particular benefit, students will learn how to use hardware-enabled security and leverage the TPM. Both of these technologies are anticipated to provide the basis for many trusted computing environments and other security applications in the coming years.
Suggested Team Qualifications
- Interest in computer security (basic knowledge is beneficial)
- Basic background in operating systems
- Experience with Assembly and C programming
- Basic understanding of computer architectures
Suggested Elective Courses
- CSC 405 Introduction to Computer Security or CSC 474 Information Systems Security
- CSC 451 Operating Systems
- CSC 456 Computer Architecture and Multiprocessors
About APL
The Applied Physics Laboratory (APL) is a not-for-profit center for engineering, research, and development. Located north of Washington, DC, APL is a division of one of the world's premier research universities, The Johns Hopkins University (JHU). APL solves complex research, engineering, and analytical problems that present critical challenges to our nation. Our sponsors include most of the nation’s pivotal government agencies including the Department of Defense (DoD), the Department of Homeland Security (DHS), and the National Security Agency (NSA).
Project requires a Non-Disclosure Agreement to be signed
iSER Performance Evaluation Project Continuation
NetApp is a leading vendor of hardware and software to help customers store, manage, and protect data. NetApp clients have very high performance needs. They typically deal with petabytes of data and high-load systems. NetApp is constantly looking for ways to improve performance of their systems. Stated in simplest terms, this project is part of a continuing effort to evaluate a set of hardware and software technologies which promise to provide a more efficient mechanism to transfer data across a network. NetApp will use results of this project to determine value-added for different applications. This semester the emphasis is on virtualization and cloud computing. A more refined project title for this semester is “Performance Evaluation of iSER/RDMA in Cloud Computing".
The existing research platform is built on CentOS. The goal this semester is to explore possibilities of running a Hyper Visor on CentOS and creating a Virtual Desktop Interface (VDI) environment. Servers and desktops in the lab are equipped with high speed (10Gb) optical network connections. Once it is possible to create multiple VMs, performance profiles can be gathered. This can be done by creating numbers of VMs and then do a study of the performance impact with and without iSER in this VDI (Cloud) Environment.
Specific steps include:
- Research an appropriate Hypervisor for CentOS and get that up and running.
- Create/set up a VDI environment in the lab architecture.
- Develop performance experiments and collect data to compare performance of the VM’s created via VDI with and without RDMA.
Below is a list of terms useful in understanding project goals:
SCSI: "Small Computer System Interface." This is an interface protocol used to access hard disk drives that has been around for many years.
iSCSI: SCSI over TCP/IP. This protocol is newer, and allows a computer to access SCSI devices located across a Storage Area Network (SAN). This type of application typically has high bandwidth and low latency performance requirements. iSCSI functions by opening a TCP connection over the network and exchanging commands and data. The computer that has the physical SCSI disk drives, and that accepts incoming iSCSI connections, is termed the "target". The computer that connects to the target in order to access SCSI devices is known as the "initiator".
iSCSI with TOE: iSCSI with "TCP Offload Engine". Typically TCP is implemented in the kernel, so the CPU carries its overhead. A home broadband connection might have a bandwidth of 30Mbps, which is considered slow by industry standards. The kernel implementation of TCP, then, does not affect network performance in such cases. This project, however, deals with 10 Gbps speeds - nearly 3,000 times faster than home use. In this kind of environment, the CPU's protocol handling adds a significant burden and degrades throughput. A newer technology known as "TCP Offload" was developed to take the TCP protocol and implement it in the hardware of the network adapter, thus relieving the CPU of this load.
DMA: "Direct Memory Access." This is a hardware mechanism in modern computers that allows some I/O devices to directly transfer blocks of data into main memory without the intervention of the CPU, thus freeing CPU cycles. This technology has been around for many years.
RDMA: "Remote Direct Memory Access." This technology takes DMA a step farther, and allows a remote device/computer to perform a DMA transfer across a network while avoiding constant CPU intervention on either end of the transfer. This is accomplished using certain protocols to negotiate DMA transfers, as well as hardware support to actually perform the data transfer using existing DMA hardware.
iSER: "iSCSI Extension for RDMA." This technology allows an iSCSI target/initiator pair to perform data transfer over the network without involving the CPUs of the nodes using an RDMA protocol. This relieves the CPU from copying large amounts of data from the network adapter's I/O buffers to main memory, saving even more CPU cycles than TOE alone. Also, since data does not remain in the network adapter's buffer for long, these buffers can be made significantly smaller than is necessary when using just TOE, decreasing costs and increasing scalability.
TOE: "TCP Offload Engine". See "iSCSI with TOE."
Available Project Resources
Four Dell T3400 computers, each with:
- Quad Core Intel Processor with 1333Mhz FSB
- 8GB RAM
- Operating system: CentOS 5.3 (64-bit)
- Chelsio 10G optical network card, in a PCI-E x8 slot with Fiber Optic Cabling
Currently these four T3400 are assigned to two pairs, each pair containing a “target” and “initiator”. The computers have been labeled as such. The Chelsio cards on each pair of computers are directly connected via fiber cable.
One Dell PowerEdge 2950 server with:
- Quad Core Intel Xeon E5405 with 2x6MB Cache 2.0Ghz 1333Mhz FSB
- 8GB RAM
- Operating system: Linux RHEL 5.3
One Cisco Nexus 5030 10Gbit Ethernet Switch
Two Dell D380 computers with NC State Realm Linux installations are available for team use. These are not intended as test bed machines.
RoboWolf
RoboWolf is a custom designed robotics platform intended to introduce computer science students to concepts of embedded systems, sensors, and wireless communications. All elements of the architecture of RoboWolf are visible to students. Programming for RoboWolf is mostly in Java, with occasional opportunities to program in C. RoboWolf is a battery driven mobile device and also includes on-board battery powered processing. RoboWolf sub-systems include a variety of sensors (accelerometers, ultrasonic range finders, etc.), subsystems for vision processing and directional control, and a limited range (10m) wireless radio (802.15.4). The goal of this project is to design and implement hardware and software systems based on MEMS gyros and a magnetic compass to permit RoboWolf to navigate in spaces that do not receive GPS signals. Another goal of this project is to design augmented radio control of hobby aircraft or boats. We plan to form a team of two (or more) computer science students and two (or more) computer engineering students to collaborate on a solution to these problems.
Properly Dimensioned Space Mapping Using an Image Reference
The Problem
Traditional architectural drawings and geographic mapping packages are predicated on a space reference system for determining size, location, and distance relationships. This reference system can be in inches, feet, meters, miles, or some other unit of measure. Since these drawings are used to validate the structural engineering, as well as the reference for the actual construction process, their accuracy is critical. Other applications for these drawings do not have a requirement for the same level of accuracy. For example, building floor maps which guide visitors need to provide an overall visual reference but need not maintain precise accuracy. Similarly, sporting event venues such as football stadiums often provide “stadium maps” which allow patrons to choose their seating location based on price and proximity to the playing field, but they don’t need the same level of accuracy that is required of the blueprints which were used to construct the stadium. While the precision can be sacrificed, there are many business uses for these drawings which still contain overall location and size information. In the stadium map example, the owners might want to generate a “heat map” which shows revenue per section, occupancy rates, or some other performance indicator. Similarly, grocery stores often want to map the store floor space into sections and assign merchandise to these sections.
The Project
This project involves the creation of a software system which allows the user to input an image representing a stadium map, store floor plan, geographic area, or any other image which they wish to “trace” forming polygons of specific interest. In a stadium map, this might be done by seat or section. In the store floor plan, this might be by aisle and category (cereal, bread, soda). In a geographic map, the user may wish to digitize regions by county or state. The input to the system will be an image. The output will be an XML representation of the digitized regions with a text-based description, polygon name, X and Y coordinates, and a segment number to allow for entities which have multiple separate regions (the Hawaiian Islands, for example). While exact dimensioning of the traced polygons is not required, the user must be able to specify a unit of measure and “calibrate” all subsequent segments based on this calibration. The technology we propose is Adobe Flash to allow the final product to be deployed via the web. There are many additional functions like “auto feature recognition”, “polygon shrink wrapping”, cut and paste, etc. that can be discussed based on time and difficulty.
Design Verification Automation Tool (DVAT)
Background
Tekelec is a Morrisville-based company focused on delivering quality hardware and software solutions to a variety of global customers. Many of Tekelec's software products are built on a platform stack consisting of a customized Linux OS, a proprietary database system and several GUI interfaces. As the core of so many products, this software stack is held to the highest standards of quality and is subject to rigorous testing procedures. Tekelec’s Design Verification group is responsible for this testing, and has developed a comprehensive automation product to assist with the verification process. This Design Verification Automation Tool (DVAT) has experienced significant development over the past few months. Last semester, Tekelec sponsored a senior design group to enhance DVAT’s reporting and analysis capabilities. This semester, Tekelec would like to focus on enhancing DVAT’s messaging features.
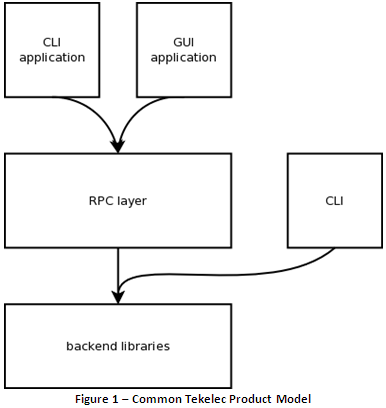
The current method of product testing with DVAT involves sending commands over SSH to individual test machines. However, Tekelec’s products also support sophisticated RPC-layer messaging. The Design Verification group would like to take advantage of these capabilities, and incorporate an RPC-layer testing vector into the DVAT infrastructure. See Figure 1 below for the relationship between the user interface and libraries in a common Tekelec product.
Problem
Tekelec’s spring 2011 senior design group should develop additional testing vectors beyond the currently implemented vector of command line interface testing via SSH. The team should focus on providing the infrastructure needed to exercise and verify the RPC layer of Tekelec’s products. While the primary RPC technology used at Tekelec is SOAP, the project must support the various dialects that are used in company products (e.g. SOAP::Lite, gSOAP).
In addition to developing the core infrastructure to exercise Tekelec products via the RPC layer, the team should extend the current DVAT code base to support the newly developed testing vector. While the expected use case of the developed infrastructure is through DVAT, the core infrastructure developed by the team should be consumable without any dependency on DVAT.
Finally, the team should provide useful examples of using the underlying RPC testing infrastructure as well as complete test plans for utilizing their testing vector from DVAT. At the end of the semester, the developed code should be an integrated component of Tekelec’s automation tool, and an important part of the overall testing effort.
Facebook Shopping Pal
Project Overview
The goal of this project is to develop an application targeted for Facebook that allows users to opt-in to receive offers from businesses, including personalized offers from companies that they Like or of which they are Fans. The application, called Shopping Pal II, will advertise offers to consumers that have opted into this service. For example, a user might be a fan of a major department store on Facebook. The Shopping Pal II application will allow the user to review and select offers and coupons from the department store using Facebook. This application is a sibling to the Shopping Pal I Android mobile application that was developed during Fall 2010.
Project Organization
The project will be run within the Agile Scrum framework. Agile development provides the benefits of early and consistent customer engagement. The Teradata representative will serve as the Product Owner for the Scrum team in order to provide application requirements and to assist with backlog grooming and acceptance criteria. Development will occur in two week Sprints. Planning for tasks will occur at the beginning of the Sprint, checkpoints and backlog grooming will be scheduled mid-Sprint and demonstrations of progress will happen at the end of each Sprint in a Sprint review.
Company Background
Teradata Corporation is the world’s largest company solely focused on raising intelligence and achieving enterprise agility through its database software, enterprise data warehousing, data warehouse appliances, consulting, and enterprise analytics. Teradata produces analytical solutions that leverage enterprise intelligence in order to solve customer business problems, including customer management. Customer management is the practice of building enduring, lasting and profitable relationships. Teradata Relationship Manager, which is developed here in Raleigh is designed specifically to meet the needs of businesses in establishing and maintaining strong customer relationships. The Teradata Corporation has approximately 2400 employees worldwide. In the Raleigh office, Teradata has an organization of 100 employees with 50 software engineers.
Shopping Pal II Requirements and User Stories
Requirements
- The Shopping Pal II user interface will be deployed as a Facebook Canvas application.
- The Shopping Pal II application will connect to external RESTful web services to retrieve application data including offers from the participating businesses.
- The Shopping Pal II application will update the user’s Facebook Notifications indicator when new offers are available.
- The Shopping Pal II application will provide a bookmark and counter on the Facebook navigation bar that will allow the user to quickly see how many new offers are available.
- The Shopping Pal II application will also provide a Facebook Page Tab interface for integration into participating company Facebook fan sites. The Page Tab interface will provide coupons and offers only for that company.
Receiving offers
- As a user, I would like to sign-up for Shopping Pal II to receive offers.
- As a user, I need a Notification when new offers are available.
- As a user, I need to have a bookmark that displays a count of new offers.
- As a user, I would like to Hide or suppress offers that are not desired and to Like offers that are desirable.
Publishing offers
- As a business, I would like a Shopping Pal tab integrated into my site that displays my list of offers.
- As a business, I would like to publish offers for customers.
- As a business, I would like to delete old offers that have expired.
- As a business, I would like to receive data on the customers that have signed-up to receive offers including whether they Like my offers or Hide my offers.
MONDRIAN: PERFORMANCE HARNESS
Problem Statement
Thomson Reuters provides intelligent information for businesses and professionals. In healthcare, this can mean enabling analysis of cost of care, quality of care, and access to care, or even investigations of fraud, waste, and abuse. See the Background section below for more information on one such product, Advantage Suite.
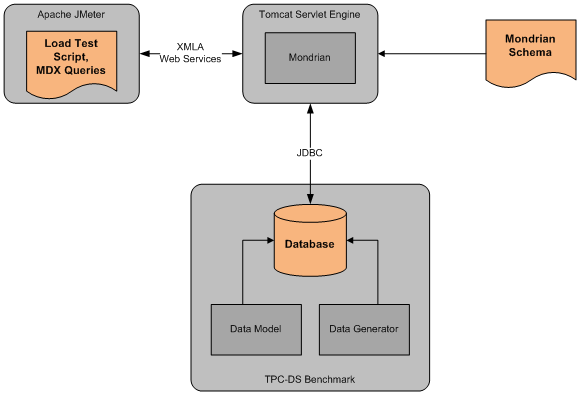
Mondrian (http://mondrian.pentaho.org/) is an open source tool in use at Thomson Reuters. Mondrian enables sophisticated analysis and reporting applications by translating queries in the Multi-Dimensional Expressions (MDX) query language into standard SQL. Reporting tools access Mondrian via the XML for Analysis (XMLA) web service interface. Thomson Reuters has made code contributions to improve the performance of Mondrian, and would like to see the Mondrian community adopt a performance test harness to guard against performance regressions as the code base continues to evolve.
This project will be a continuation of work begun in Fall 2010. The previous team’s work produced a test harness with the following components:
- A mysql database in a “snowflake” schema, with sample data, based on the TPC-DS draft standard (http://www.tpc.org/tpcds/default.asp).
- A Mondrian schema definition consisting of descriptive metadata for the measures and dimensions in the database.
- A set of 12 test queries in the MDX language.
- A test script for the Apache JMeter load test tool (http://jakarta.apache.org/jmeter/) so that single user or multi-user workloads can be applied to Mondrian.
For Spring 2011, it is desired to enhance the performance test harness as follows:
- Identify a strategy for converting performance test results into a pass/fail result, even when running on shared hardware. For example, if a given test query took 100 sec to execute yesterday and 110 sec to execute today with modified code, does that represent a performance failure, or is that within the range of normal variation?
- Identify a strategy for checking functional correctness of queries in the test harness. For example, a multi-user throughput test might expose a thread safety bug in Mondrian. The test harness should check for expected query results as well as measuring performance.
- Identify a strategy for making the test harness easily extensible over time by the Mondrian developer community.
- Modify or replace the existing JMeter test script to implement these strategies.
Our intention is to make the performance test harness available to the Mondrian open source community at the conclusion of this project.
Student Insights Gained
Students will be exposed to business intelligence concepts such as data warehousing and OLAP while working on integration tasks associated with relational databases, Mondrian, and web services. All of this is in the context of performance engineering for a sophisticated open source project. Along the way students will be responsible for all aspects of technical design and implementation, interact with subject matter experts, and present findings to company representatives. Students will be working with Thomson Reuters staff who are developing commercial software for one of the most dynamic areas in the U.S. economy – healthcare.
Required Skills and Experience
Java programming and a basic level of familiarity with relational databases will be required. The previous team’s deliverables are available as a starting point with Mondrian, MDX, and Apache JMeter. The final test harness is likely to include some combination of JMeter, Java, or a scripting language.
Development and Test Environment
The software involved in this test is Java-based and works on all popular operating systems. It will also be required to run a relational database such as MySQL or possibly Oracle. Student laptops or NCSU computers can be used for development activities. No access to Thomson Reuters servers will be required. All the required software is available for download from the web.
Background
Advantage Suite is the flagship product in the Payer Management Decision Support sector of the Healthcare business of Thomson Reuters. It consists of a suite of applications for healthcare analysts, and a component called Advantage Build, which is used to construct and regularly update a data repository that the applications query. Advantage Suite users can perform analyses of quality of care, access to care, and cost of care, conduct disease management and case management, initiate fraud, waste and abuse investigations, and much more.
Advantage Suite includes a powerful ad-hoc healthcare analytics tool, and belongs to the class of Domain Specific Business Intelligence (BI) software. Unlike other BI tools such as Cognos or Business Objects, Advantage Suite “speaks the language of the healthcare analysts”, allows the construction of sophisticated reports that resolve into a series of queries, and comes with a so-called Measures Catalog containing over 2,500 analytical metrics including simple measures (“average length of stay of a hospital admission”), ratios/rates, (“cost of healthcare expenditures per beneficiary per time period”) definitions of populations ( “people with Type 2 diabetes”, “asthmatics”, etc.), and more than 175 pre-defined report templates (“Prescription Drug Cost Monthly Trend Report”, “Top 300 Hospital Profiles”).
After the healthcare analyst has defined a report, she can immediately submit the report for execution, or schedule it via an agent. The report resolves into a series of queries that are run against the underlying healthcare analytics data mart. Reports produce on average between six and ten fact queries (i.e., queries that pull data from the fact tables), with some reports generating more than 100 queries.
Bus Tracking Blackberry App
Project Description
TransLoc was formed by NCSU students with the goal of revolutionizing campus transit. Today, universities all over the country use the technology first used here on the Wolfline.
Not content with the limitations inherent in the mobile web version of our system, last spring we released a widely popular iPhone app to let students track their buses on the go. We will soon follow it up with the release of an Android app that was produced during last semester's Senior Design session. It is now time to round up the smart phone market and give the many BlackBerry users out there some much needed love.
We need an intuitive, easy to use app that will allow riders to locate their bus anywhere from the convenience of their BlackBerry smart phone. BlackBerry handsets come in many shapes and types, so this project will need to work in this diverse ecosystem by targeting both the classic physical keyboard/trackball devices as well as the new touch screen devices.
The app you will develop will present riders with easy access to arrival estimates (provided by us) for their favorite routes as stops, in addition to our signature live tracking maps. In short, we'll give you the data feeds, and you take it from there. It will be your goal to make this app a truly indispensable app; this is your chance to improve the daily lives of thousands of your peers.
Finally, as you will come to know, the mobile app world is fast paced. To give you a feel for this, as part of this project, you will be taking an iterative approach to building the app. As you reach key milestones, you will be releasing the app to the BlackBerry App World that will allow you to solicit feedback from users to drive the direction of development. Not many projects let you get your work in front of real users while you're still working on it, so don't pass up this opportunity!
Project Archives
| 2026 | Spring | Fall | |
| 2025 | Spring | Fall | |
| 2024 | Spring | Fall | |
| 2023 | Spring | Fall | |
| 2022 | Spring | Fall | |
| 2021 | Spring | Fall | |
| 2020 | Spring | Fall | |
| 2019 | Spring | Fall | |
| 2018 | Spring | Fall | |
| 2017 | Spring | Fall | |
| 2016 | Spring | Fall | |
| 2015 | Spring | Fall | |
| 2014 | Spring | Fall | |
| 2013 | Spring | Fall | |
| 2012 | Spring | Fall | |
| 2011 | Spring | Fall | |
| 2010 | Spring | Fall | |
| 2009 | Spring | Fall | |
| 2008 | Spring | Fall | |
| 2007 | Spring | Fall | Summer |
| 2006 | Spring | Fall | |
| 2005 | Spring | Fall | |
| 2004 | Spring | Fall | Summer |
| 2003 | Spring | Fall | |
| 2002 | Spring | Fall | |
| 2001 | Spring | Fall |