Projects – Spring 2022
Click on a project to read its description.
Sponsor Background
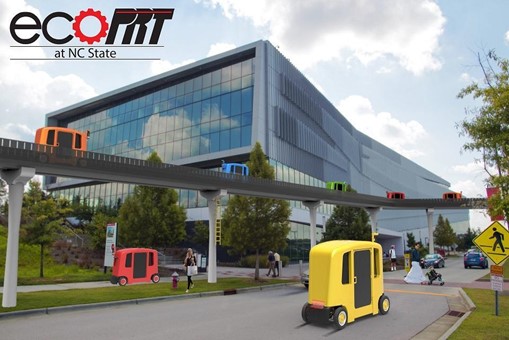
Autonomous vehicles technology is maturing and could offer an alternative to traditional transit systems like bus and rail. EcoPRT (economical Personal Rapid Transit) is an ultra-light-weight and low-cost transit system with autonomous vehicles that carry one or two passengers at a time. The system can have dedicated guideways or alternatively navigate on existing roadways where the vehicles are routed directly to their destination without stops. The advantages include:
- Dual mode – existing roadways and pathways can be used for low install cost in addition to elevated roadways at a lower infrastructure cost than existing transit solutions
- A smaller overall footprint and less impact on the surrounding environment so guideway can go almost anywhere.
The research endeavor, ecoPRT, is investigating the use of small, ultra-light-weight, automated vehicles as a low-cost, energy-efficient system for moving people around a city. To date, a full-sized prototype vehicle and associated test track have been built. For a demonstration project, we are aiming to run a fleet of 5 or more vehicles on a section of Centennial campus. The Vehicle Network server will serve as the centralized communications and vehicle routing solution for all the vehicles.
Background and Problem Statement
With the aim of running a multi-vehicle live pilot test on Centennial Campus, the overarching goal is to create a Vehicle Network Controller (VNC) and the associated ROS vehicle client software to guide the vehicles and provide interaction to users. Please refer to the architectural diagram below showing the server architecture of the solution. The VNC will manage a fleet of cars, dispatching them as needed for ride requests and to recharge when necessary. It will also provide interaction to users to both make these requests and manage the network itself.
Project Description
The work on the VNC would be a continuation of the work from previous senior design teams. The current VNC solution provides a means to simulate multiple vehicles, evaluate metrics of performance, create administrators/users, and allow for vehicle clients to interact with the server in different ways. Though still considered an alpha stage at this point, there is a need to further develop the VNC to make ready to be used with physical vehicles.
Previous work focused on using Google maps as a means for routing vehicles. This current effort would look at replacing google maps as the vehicle routing and planning. While google maps is helpful with preexisting roads, the vehicles will follow pathways that could include pedestrian or bicycle pathways on preconfigured routes. With that said, we are looking for a solution that does not rely on google maps for routing and path planning.
The effort includes two tasks which would likely need to be done one after the other. Though two tasks are presented, it would be expected that a single semester CSC team might work on just one of the tasks. The first task would be to replace google maps routing and planning with a home-grown solution. Further, the vehicles will follow specific routes, but setting up those routes requires a user interface to either obtain the routes from the existing vehicles or to have the user click and draw pathways on a map.
The second task is to further build-out the simulator for multiple vehicles and multiple rider requests. Effort would include the development of a user interface for easily setting up and running the simulation and creating the specified number of simulated vehicles and people.
For the first task, below are a set of subtasks for the path creation and planning:
- Identification of the interface points of Google Maps in the Vehicle Network Controller
- Path creations: create a user interface to easily obtain paths from existing vehicles and alternatively from a graphical user interface
- Uploading an image to the vehicle network server that serves as the map of the system. Questions to address: how can the map image be sent to client devices for displaying as well?
- The framework for the pathways is an “edge and node” map. Edges represent the pathways and nodes represent the common intersection points of multiple pathways.
- Developing an algorithm to route vehicles to riders in an efficient manner
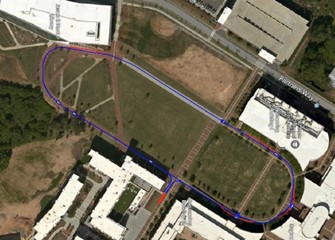
Above picture shows the oval route with paths represented by an “edge and node” map
The second task involves the development of an interface to easily setup and run simulated vehicles. In addition to controlling multiple live vehicles, the vehicle network server can also interact with simulated vehicles. As new sites are explored, creating a tool that can estimate ridership and performance data will help determine the utility of a transit solution on the particular site in question.
To that end, this second task is to provide a user interface to easily setup a vehicle network, run a simulation, and extract performance data. The specific tasks are outlines below:
- Create a user interface that allows user to easily create a map and path for vehicles
- User interface allows for the easy manipulation of initial conditions of the simulation (i.e. number of vehicles in network)
- Ability to set the number of vehicles that can be parked at each station
- User interface allows for the easy input of station demand over time. (i.e. how many riders per hour go from station A to B, how many from B to C, how many from A to C, etc.)
- Application allows for the creation of an arbitrary number of simulated vehicles and simulated “riders”.
- Include top level input parameters such as number of vehicles, number of passengers per hour, relative distribution of people at stations
- Application allows user to input total simulation time and run the simulation. At end of simulation, key parameter data is stored in a specific format (CSV or XML or ?) and is easily displayed for user.
- Key parameters could include total wait time, total ride time, total miles driven for vehicles, battery state of charge, etc.
Below is a set of additional tasks to further develop as desired. Some of them refer to the above two tasks while others are improvements on existing development. As an exhaustive list the expectation is not that all of this should be done within a single semester, but instead it provides a list of possible areas to explore, and initial meetings can be used to refine the scope of these goals.
- Improve mobile app for people calling the vehicle
- Add secure connection to client vehicle ROS package
- Include ability to monitoring battery voltages
- Include charging stations
- Algorithms to re-route vehicles to charging stations when battery is low
- Algorithms to better improve vehicle assignment to requested ride
- Include vehicle storage depot in VPN to allow storage of excess vehicles
- For running multi-vehicle simulations, include improve usability of GUI interface for server.
- Include top level input parameters such as number of vehicles, number of passengers per hour, relative distribution of people at stations
- Include ability to draw paths with mouse and have them persist through sessions
- Ability to set the number of vehicles that can be parked at each station
- Further improve multi-vehicle simulations
- Make running simulations more turn-key
- Add physics within the emulated vehicle module
- Further refine KPI's for success (i.e. dwell time, ride time)
- Further explore the vehicle routing algorithm
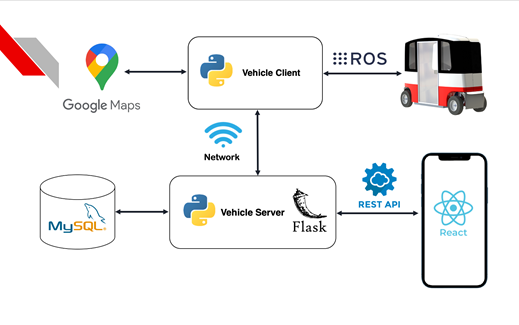
Architecture of Vehicle Network Server
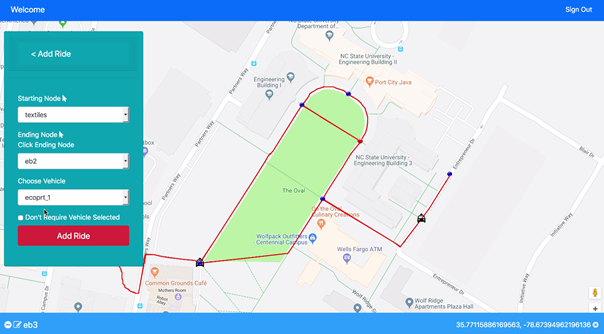
Initial View for Vehicle Network Controller
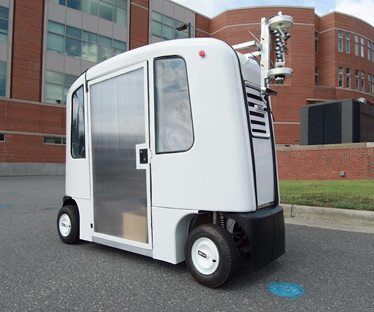
EcoPRT Vehicle
Technologies and Other Constraints
|
Name |
Description / Role |
Version (if necessary) |
|
ROS |
Robot OS system for autonomous vehicle |
Melodic |
|
NodeJS |
Web Server software. This will run on the web server and will serve the website and connect the website to the database. It will contain a REST API. The REST API will allow the website and other services to access the functions of the web application. |
8.9.4 |
|
Python |
Used to write the Vehicle Server and Vehicle Client processes |
3.4.9 |
|
NPM |
Node Package Manager for installation |
- |
|
MySQL |
SQL implementation. Database that is used for storing tabular data that is very relational in nature. |
14.14 |
|
Neo4j |
Graph database. Used for storing graph-like data. Uses the Cypher query language. |
3.4.9 |
|
Bootstrap |
Using Bootstrap will give more freedom to customize the look and feel of the web application. It also makes it easier for to make a mobile friendly version of the website. |
4.0.0 |
|
AngularJS |
Used for the logic of the website. It works very well for data binding which is the bulk of the web application since all data is pulled from the database. |
1.6.8 |
|
Express |
Routes URLs to files and/or functions |
4.16.2 |
|
HTML5 |
Used to create web pages |
5 |
|
REST |
Used to get information from the server and send it to the front end |
- |
|
Socket.io |
Used to get information from the server and send it to the front end |
2.0.4 |
|
CasperJS |
Used for automated testing of web applications with JavaScript |
1.1.0-beta4 |
|
Mocha |
JavaScript framework for Node.js that allows for Asynchronous testing |
5.0.5 |
|
Chai-HTTP |
Assertion library that runs on top of Mocha |
4.0.0 |
|
Istanbul (nyc) |
Used for determining code coverage |
11.7.1 |
Sponsor Background
#GoBeyond is a media and tech innovation lab pushing the boundaries of what we as humans know to be possible to inspire a new wave of innovation in the process: one that is sustainable and inclusive. Decades ago the world fell in love with Carl Sagan, the mission for the moon, the idea of flying cars. But science and technology have reached a critical inflection point. We no longer are enamored with the idea of infinite progress. We've broken some fundamental social and scientific systems, and it's time to rebuild those, and rebuild the world's trust in innovation to meet the needs of the broader community. In the three years since our founding #GoBeyond has broken ground creating content that has been viewed by millions and featured in over 100 publications including Forbes, Scientific American, and Interesting Engineering. We’re a Women in AI hackathon winner, DeFi Talent Fellow to advance inclusion in blockchain, and Luminary Fellow to advance equality in entrepreneurship. We were also recently nominated for an Emmy for our series Financially Naked, which focused on financial equity and inclusion.
Background and Problem Statement
Last year while most of the world was battling Covid, Jenn, the founder and Chief Story Engineer of #GoBeyond, was hospitalized and diagnosed with an autoimmune disorder. It turns out Covid has been triggering an increase in autoimmune illnesses. Many weeks and hours of internet forum searching later, she learned that one of the top world renowned institutions for treating her illness created an anti-inflammatory nutrition protocol to help patients achieve remission.
Autoimmune disorders, in particular, are one of the fastest growing illness classes with more than 100 unique identifiers and no known cures. According to the National Health Council more than 40% of Americans are battling a chronic illness, and 1 in 10 people globally are battling a chronic autoimmune disorder. These illnesses are much more prevalent in industrialized nations, with 80% of autoimmune sufferers being women and minorities, and autoimmune disorders are the leading cause of death and disability for women in the 20-50 age demographic.
The good news is there is more data now than ever to help us begin to uncover casualties and cures, and there are millions of autoimmune sufferers who have taken to forums online to try and crowdsource to improve treatment outcomes, but right now these communities are fragmented and exist in places like Reddit, Instagram, and Facebook, where no one is mining this data for trends.
AI for Ai won the Women in AI hackathon for our proposal of a social network designed to support the millions with autoimmune disorders while providing critical data for scientists, healthcare providers, and pharmaceutical companies to pursue research and cures. Because of fragmented healthcare data and studies, many patients presently turn to online forums such as Facebook, Reddit, and even Clubhouse to share symptoms and seek medical advice.
Project Description
AI for Ai will allow patients to share their symptoms through surveys and forums, and support others affected by autoimmune disease. Users can upload images of their symptoms, images of treatments, text statuses, and opt in for what data they want to share with medical providers vs. members of the autoimmune community. Natural Language Processing (NLP) and Computer Vision (CV) consolidates this data and makes recommendations to healthcare providers and scientists on areas of exploration to track trends in disease progressions and causation. Additionally, AI for Ai will scrape medical journals like PubMed to further augment our datasets.
AI for Ai should be designed for use by two audiences: patients and providers. For patients, the app will act as a social support group, providing the ability to connect with and support other patients, track symptoms and disease progression, as well as connect directly with their providers and read up on new research and findings. Each patient will have a profile where they can select their particular autoimmune illness(es), upload pictures and text updates tracking their progression. Additionally there will be community chat features where patients can share this content with other patients.
The interface for providers (scientists, researchers, healthcare providers and pharmaceutical companies) will allow these users to access data scrapers and NLP-based AI systems to identify promising areas of exploration in identifying disease progressions, environmental and genetic triggers, treatments and eventually cures. AI for Ai will also scrapes and includes publicly available data, particularly scientific papers and reports on these specific autoimmune illnesses, from the NSF and NIH, which are the largest public funders of biomedical research worldwide. AI for Ai will use NLP and CV to analyze trends within these papers and compare them to patient data on the platform.
Patients, providers, scientists, and regulators create profiles and consent for the services provided by our platform individually. They can decide what information they want to be public on the platform (i.e. they can choose not to disclose their full legal name outside of verification purposes on the platform). All patients sign a Health Insurance Portability and Accountability Act (HIPAA) waiver to respect patient privacy. Additionally in order to be more compliant with the American with Disabilities Act and to be able to better assess casualties, we’d like to create functionality within the app for voice to text recording to be able to allow patients to speak freely the way they do on Clubhouse, particularly for patients with MS and other autoimmune conditions for which typing or using a smartphone is quite difficult.
Technologies and Other Constraints
Python, PyQt5, NLP, Computer Vision, GPT3, machine learning and cyber security. Open to a mobile-first web app or mobile approach. Alternatively, students can recommend technologies and architecture based on requirements.
Python / NLP / Computer Vision / Machine learning - Analysis to study macro-trends in data provided by users and pulled from scientific papers and reports.
PyQt5 - Time permitting it would be great to have a version of the app that is voice to text friendly for folks battling disabilities who may not be able to easily type their symptoms into the app but could describe it verbally.
GPT3 - Time permitting a chat-bot based survey rather than traditional form surveys would also help with usability.
Cybersecurity - We expect the system to be built with security in mind.
We have several dozen patients who have autoimmune illnesses that have offered to be early testers of the platform. Students are encouraged to conduct usability testing with these users. Because health data is highly sensitive and legally protected the students will be asked to sign NDAs.
Should the students choose to stay on with AI for Ai after this prototype project is complete, we’re happy to explore extending and expanding employment opportunities with the project or within the broader scope of #GoBeyond.
Students will be required to sign over IP to sponsors when the team is formed
Sponsor Background
ICON provides innovative drug development solutions across all phases and therapeutic areas. ICON’s Cybersecurity Team is a small group of professionals that share a passion for the topic. Our team is excited to cooperate with NCSU students on the sixth project to further develop the RePlay Honeypots.
Background and Problem Statement
Honeypots are systems that behave like production systems but have less attack surface, less resource requirements, and are designed to capture information about how potential attackers interact with them. Their intent is to trick an adversary with network access to believe that they are a real system with potentially valuable information on it. The honeypot will log the attacker’s behavior to collect valuable information about the adversary and to enable defenders to detect the threat and gain an advantage against it.
Previous Senior Design teams have developed Replay Honeypots--a low-interaction production honeypot system that can be configured and deployed easily, remaining cost effective in large numbers. The system is architected around three main components: 1) a central management system that provides a way to monitor and control honeypots and serves as a central repository of data collected by each honeypot it controls; 2) a series of lightweight, secured honeypots that support various methods of deployment and will simulate network behavior of other systems; 3) a configuration generation tool that will ingest packet capture (PCAP) and Nmap scan outputs, and generates configuration files that honeypots use to determine how they should behave. The Project has recently been released as an Open Source Project on GitHub, and the team will actively contribute.
While this system has come a long way, there are still some areas for improvement:
- The bridge networking model, used currently, does just enough right now to allow the honeypots to be accessible via the host’s network. A better architecture for the honeypots would be for each to be independently attached to the same network as the host. This would allow the honeypots to behave independently of the host, and have complete control over their networking model and behavior. This would also make a sizable difference to an attacker’s perspective of the system. If all containers are attached to the network as independent devices, there is less of a sign that these are a docker swarm and thus deceptive devices.
- The current implementation of the honeypots gets a request, checks it against the request in the configuration, and determines if it passes the similarity threshold. If it does, the honeypot then responds with a predetermined byte sequence from the config. However, some packets might contain information such as timestamps or random values that would give the honeypot away on closer inspection. The previous team has made significant progress towards improving this issue.
Project Description
For this project, we would like the following enhancements to be implemented.
Central Management System
Here is where users create, view/monitor, and modify honeypot configurations. In Phase 6 the following features are requested:
Device Management / Monitoring:
- MACVLAN support: The system shall implement MACVLAN to deploy honeypots. This will allow the honeypots to be independently attached to the network rather than being deployed in a swarm.
Honeypots
The initial configuration of a honeypot is based on an Nmap scan of another system that the honeypot must attempt to replicate. With this input, the honeypot configures its simulated services so that an Nmap scan to the honeypot produces no detectable differences from the original system, while having as few attack surfaces as possible. In Phase 6 we would like to improve our honeypots as follows:
- The system shall have the ability to use a conventional device fingerprint to completely copy the network/interface of a target.
- The system shall provide the ability to use the captured data to modify the way the device builds packets, calculate fields in headers, and respond to specific traffic.
- The system shall provide the ability to deploy a honeytoken server
- The system should have a wide variety of honeytokens but at a minimum should include the ability to use email addresses, Word documents, PDF documents and API keys.
- The new functionality shall integrate with current Replay functionality.
- The system may use canarytokens as a basis.
Config Generation Tool
The Config Generation Tool is a standalone tool that will ingest packet capture of a system that has undergone a Nmap scan and the respective scan results and generate a configuration file for the Honeypots that can be imported. In Phase 6 the following features are requested:
- The system shall provide the ability to mimic operating systems and networking equipment using the newly requested fingerprint functionality.
- The system shall be resilient to handling large configurations.
- The previous two teams ran into some issues with adding large configs through the frontend interface. The system should be able to add large config files. If a config cannot be added, the server will reject it and the user will not be able to add/edit it.
Technologies and Other Constraints
Python3, NodeJS and VueJS are preferred development languages, and the TRIO library is recommended for multi-threading. Docker is currently used to easily manage and deploy honeypots and will remain the preferred solution for this phase. Nevertheless, all functionality of the Honeypot itself needs to be supported and tested on Linux without Dockers. CouchDB is the currently supported Database. Technology pivots are possible but require discussion with the Sponsors.
Each component of the system will be designed with large scale deployments (>100) in mind. Students should use best practices for the development of secure software and document in great detail. Students should also strive to design honeypots to be modular so that additional protocols can be introduced, and additional functionality can be created, e.g. RDP, SSH, SMB Honeypots, Honey Websites and active beaconing. This Project is published on GitHub and the Students will be required to follow GitHub processes and best practices.
Students working on this project will be most successful if they have a strong understanding of network principles such as the OSI Model. Prior successful participation in “CSC 405 – Computer Security” and “CSC 474 – Network Security” is recommended for this project. Previous experience with Nmap and OS configuration is an advantage.
Students will be required to sign over IP to sponsors when the team is formed
Sponsor Background
Department Mission:
The North Carolina Department of Natural and Cultural Resources’ (DNCR) vision is to be the leader in using the state's natural and cultural resources to build the social, cultural, educational and economic future of North Carolina. Our mission is to improve quality of life by creating opportunities to experience excellence in the arts, history, libraries, and nature throughout North Carolina. The Department works to stimulate learning, inspire creativity, preserve the state's history, conserve the state's natural heritage, encourage recreation and cultural tourism, and promote economic development. Our goal is to promote equity and inclusion among our employees and our programming to reflect and celebrate our state's diverse population, culture, and history by expanding engagement with diverse individuals and communities. We encourage you to apply to become a part of our team.
Division Mission:
The North Carolina Division of Parks and Recreation exists to inspire all its citizens and visitors through conservation, recreation and education.
- Conservation: To conserve and protect representative examples of North Carolina's natural beauty, ecological features, recreational and cultural resources within the state parks system;
- Recreation: To provide and promote safe, healthy and enjoyable outdoor recreational opportunities throughout the state; and
- Education: To provide educational opportunities that promote stewardship of the state's natural and cultural heritage.
Data & Application Management Program
Serves to support the Division, sister agencies, and non-profits in web-based applications for various needs: personnel activity, Divisional financial transactions, field staff operations, facilities/equipment/land assets, planning/development/construction project management, incidents, natural resources, public education, etc. Using the data gathered from these applications, we assist program managers with reporting, data analytic, and public education needs.
Background and Problem Statement
The existing LAMP stack system was developed over the course of 25 years, with ad-hoc application development in a production only environment (mainly using PHP and MariaDBlanguages) to meet immediate business operational needs of the field staff. The legacy system is a production only [L]AMP stack without extraneous features, like environments for development, test, GIT, etc; if there are any features outside of PHP and MariaDB, this would need to be discovered, because we do not have documentation. The legacy system has gone through multiple ad hoc, quick migrations: from a classic MAMP, ZLinux, and now RHEL7. The legacy system is in dire need of upgrades to a more sustainable, future proof architecture and environment, based on industry standards, methods, and best practices, including integration of development and test environments. The current DPR applications support all aspects of NC-State Parks daily business functionality: from accounting/financial/budgetary, natural resource inventory and management, HR/personnel tracking; such system improvements will allow park staff to be more available to serve the public in their mission of conservation, recreation, and education needs.
Project Description
In a modern 21st century workplace, software application support for business functions is comprised of more than just our simple webpage and database interface. Our ideal solution would allow for a more flexible integration with other systems: IoT, other database systems, etc. The legacy system would need to be migrated and replicated, so regular operations may continue, from a 2 VM RHEL7 system [production internal and public servers] to a cloud, container OpenShift/RHEL8 GIT, dev, test, production system The envisioned cloud-based container system should allow us to continue to use our legacy systems and applications while transiting their integration over to the modern system. This would include a proper GIT system between development, test, and production, with branch push controls at each level. Our current internal and public facing systems are on two separate VM servers, but could be NATed in the container to still be separated out for security. This may require the integration of a SAML/SSO, shift from our current login method. Apart of the project, is our near future, 2024, will require a transition from RHEL7 to RHEL8, PHP5 to PHP7 (or whatever will be the latest version that NC-DIT will be supporting on a future system), and MariaDB 5 (with MyISAM) to 10 (with InnoDB). We foresee the need to eventually change our database from MariaDB to PostgreSQL, but are not set on this and open to suggestions. We are also integrating IoT devices for our visitation counts, facility maintenance monitors, and natural resource and fire drones; as well as, integrating with State Property Office, Department of Insurance, OSHR, OSBM,and vendor database systems: SAP-Hanna, Oracle, mainframe, SAP/DB2.
- Reservation system vendor uses a MS-SQL database and requires this for replication of dataset to us.
- Visitation counter vendor uses a MongoDB, but a JSON API can be utilized to replicate and insert the data into our MariaDB.
- We receive data in the form of files from other agencies or their vendor systems, appropriate accommodations for SFTP would need to be made in project.
- Packages, like ImageMagick and PDFLib, are utilized by applications in the php script files of the legacy system.
These needs have outgrown our current setup and have given us a glimpse into the pace of future needs. We are wanting to design a new system that allows for continued use of the legacy system and establishment of a system for the next generation. The legacy system will be modified accordingly to be migrated to the next generation system for continued use, until all developed applications can be migrated appropriately to be integrated into the next generation system.
Technologies and Other Constraints
Tools and assets are limited to what has been approved by the NC Division of Information Technology (NC-DIT). Most of the ‘usable’ constraints will be what is limited to NC-DPRs use through NC-DIT.
Cloud – suggested; AWS – suggested; Azure – possible
VMs – required; legacy system is built on them. Cloud/Container system could integrate, as necessary, to allow legacy system.
Containers – suggested; RedHat OpenShift – suggested; Podman – possible, but not likely available long term {Docker is currently not being offered/supported by NC-DIT; and we do not have an alternative method to support that system; this may change}
- Development system for developers (branches that can be utilized for individual modification and addition projects), specs for 10 simultaneous users
- Test system (for users to test requested developed applications; branches for individual projects); specs for 50 simultaneous users
- Production system; specs for 500 simultaneous users
- GIT push controls integrated throughout each level, with ability to modify workflow as needed, for hot fixes/patches.
- System backup methodology implemented. Integrated into replications on Dev and Test
GIT – required, as a methodology for version and branch control for merges and pushes; GITLab – suggested, as the final repository – other GIT repos used will need to be migrated/-able into GITLab
RHEL7 & 8 – required; RHEL7 {legacy system} needs to be ready for RHEL8 before 2024; container should handle both RHEL7 and RHEL8, with intention of RHEL8 being long term
PHP 5 & 7 – required; PHP5 is currently legacy system; some PHP7 readiness has been made, but full system and application check has not been done. There may be other PHP5 to 7 readiness steps that may need to be taken, that we have not done yet. PHP7 will be the
MariaDB5 & 10 – required; prepare legacy MariaDB5 databases and tables, uses the MyISAM database engine for MariaDB10, which uses InnoDB engine. User account controls, Indexing and increased speed of query processing
PostgreSQL – suggested; PostGIS – suggested
MS Server/SQL – suggested, for integration with vendor
JSON/MongoDB – suggested; for integration with vendor
SFTP/FTP – required; implementation method flexible; This is used to acquire and read data from other agencies and their vedor systems into the next generation systems databases. System would acquire file transfers from vendors/other agency sources for depositing, and we would read the data into our database
ImageMagick – Linux package – required; applications in legacy system utilize this; have experienced issues in the past, need to ensure it works on any new systems
PDFlib – required; applications in legacy system utilize this on both internal and public systems; need to ensure this will continue to work on any new systems with existing code files.
Students will be required to sign over IP to sponsors when the team is formed
Sponsor Background
The Geohazards and Earthquake Engineering (GeoQuake) lab is a research lab in the Civil, Construction, and Environmental Engineering Department at NC State. The GeoQuake team investigates how soils and rocks increase the damaging potential of earthquake ground shaking to civil infrastructure. The GeoQuake team also strives to advance education and outreach programs for women and Latin American students, which is why we designed the Earthquake Engineering and Seismology Community Alliance in Latin America (E2SCALA) program. E2SCALA means to “climb” and also to “scale” in Spanish and those are key drivers of this project; to help Latin American students reach their highest potential (to climb), while building a network that grows with the community’s goals (to scale up).
Background and Problem Statement
Underrepresentation of Latin students in undergraduate and graduate programs in STEM remains a challenge. Addressing the fundamental causes for having less than 2% Hispanics joining the STEM workforce is of special interest to NC, which has one of the highest Latin American population growth rates in the country. Additionally, the disproportionate effects of earthquakes in Latin American countries (e.g., the 2010 Haiti, 2016 Ecuador, and 2020 Puerto Rico earthquakes) relative to similar magnitude events in Japan and New Zealand reveal the critical need for community alliances to connect and engage professionals and students in Latin America who have an interest in earthquake engineering and seismology.
The COVID-19 pandemic has taught us that it is possible to be globally connected using virtual platforms. While not ideal, new frontiers can now be explored in remote learning, but not without challenges in the design and development of global, open access, educational and community-driven virtual platforms.
Project Description
The E2SCALA initiative will provide global, open access to educational resources, virtual mentorship, and collaboration opportunities to Latin American students in the US and at partner academic institutions in Latin America. To launch this online community and collaboration platform, the following five tasks are envisioned:
Definition of users, roles and privileges
There will be four main types of users in the platform:
- Administrative team: Includes the PI, Dr. Ashly Cabas and the graduate students and postdocs in her team at NC State. The Administrative team adds/removes/edits general content in the platform, approves partners’ content, invite/reject new partners, approves/rejects working groups (example of working groups), and have access to surveys requesting feedback from the general membership, and other statistical metrics of the platform (e.g., number of members, number of working groups, number of posts, number of visits, etc.)
- Partners: collaborators in academic institutions and the industry in Latin America (or the US) who will lead working groups and mentor student ambassadors (see description below). Partners can add content to the platform after approval by the Administrative team. The general membership (see description below) can apply to different working groups and Partners approve/reject applications. Partners post outcomes/goals/meeting agenda/meeting minutes. Partners will have a roster or listserv for their working groups as well as a calendar to post upcoming meetings and other events (e.g., webinars, conference of interest, etc.). Partners form the executive committee of E2SCALA.
- Student ambassadors: Students/professional nominated by partners to participate in the mentoring program. Two nominations per partner will be allowed and the Administrative team will approve/reject applications. Applications will be sent by email to the Administrative team for review. Student ambassadors can also create and post content after approval by the Administrative team.
- General membership: Professionals and students around the world will be able to join this online community by filling out an interest and background form. No official approval is necessary at this point, but the Administrative team will review general members’ profiles and has the right to reject/remove individual from the general listserv/roster.
Creation of membership database
Profile/Account: allow first time users of the platform to create an account and provide personal information and technical interests (example of profiles, example of survey). Requested information includes name, affiliation, number of years after last degree earned (identification of early career professionals and students), expertise (via a list of options created by the Administrative team), and list of topics of interest (via a list of options created by the Administrative team).
Visualization of platform metrics:
Member distribution per country (example)
Members per working groups (example)
Membership Summary info (i.e., table with member’s name, affiliation, working group he/she is a member of, etc. example)
Listserv: emails of the general membership should be collected, and a listserv created.
Platform’s technical content:
Working groups: separate tabs (webpages?) per working group to post deliverables, meeting agendas, etc (example of working group webpages, example of working group webpage2)
About page: Summary of partners’ and student ambassadors’ profiles (example 1, example 2, example 3)
Events page: Calendar of events relevant to the E2SCALA community (example)
Resources page: Four types of resources will be provided on the platform, namely
- Recorded Interviews to experts via Zoom (created by student ambassadors and partners, approved by Administrative team).
- Training modules and lectures (developed by partners, approved by Administrative team).
- Webinars (free, hosted on zoom, led by partners, offered live to people that register, and recorded to be posted on the platform, example1, example2).
- E2SCALA Workbench: library of hyperlinks to open source software and Jupyter workflows (contributed by partners, approved by the Administrative team).
Assessment of community building
Formative evaluations/surveys (e.g., google forms created by the Administrative team) sent to the general membership, partners, and student ambassadors via email. Collection of results in a central repository where only the Administrative team has access to.
Platform Stats (number of members, number of working groups, posts, per region) that only the Administrative team has access to, but can update automatically in strategic places in the platform (e.g., the About page and Working groups page).
Feedback from members: Allow users to easily provide feedback to help us improve the platform. Create/Provide general email address for members to contact the Administrative team and provide and online form/forum with feature requests, or webinars requests.
Management of the platform
Create interface for straight-forward managing of the platform (e.g., editing/updating content, reviewing platform stats, managing working groups, accessing the membership roster/profiles, etc.) by a non-CSC student (e.g., a Civil Engineering student).
Technologies and Other Constraints
This project needs to be web-based. Technologies to use are flexible and the GeoQuake team is eager to learn what would provide more versatility to the project, while making sure its maintenance is sustainable. Educational resources such as hyperlinks to Jupyter workflows, open source software, videos such as recorded webinars and zoom interviews will be hosted in the platform. Moreover, E2SCALA should be an accessible and inclusive platform (e.g., https://wave.webaim.org/).
Sponsor Background
Dr. Rothermel is the Head of the Computer Science Department at NC State. In this position, he is called on to assess the performance of faculty members, and to compare the performance of our faculty with those at other institutions.
Background and Problem Statement
In any organization, management looks for ways to assess the performance of employees and to measure that performance against the performance of competitors. Assessing performance, however, is complicated and there are many different metrics that can be used. In general, any particular metric one might choose has both advantages and drawbacks. Thus, it’s better to have multiple metrics.
In academia, one class of employees whose performance must be assessed is tenured and tenure-track faculty (hereafter, “TT faculty”.) TT faculty are typically expected to engage in several types of activities: these include teaching, research, and service (e.g., service to their profession or to their department). Performance in each of these areas needs to be assessed. Where this project is concerned, however, we are interested solely in research performance.
Standard metrics used to assess a TT faculty member’s research performance include 1) numbers of peer reviewed scientific papers published, 2) numbers of grants received, 3) total expenditures of grant money on research activities, and 4) numbers of students mentored and graduated, among others. To see an example of “1” in action, go to “csrankings.org”, turn the toggle next to “All Areas” to “off”, and down below under “Systems”, check the box next to “Software Engineering”. You’ll see that NC State is ranked second in the USA for research in this area based solely on the numbers of publications (in a small set of top conferences) of its faculty members.
All of the foregoing metrics provide value, but they do not adequately capture one of the key attributes that motivates research in the first place: research is expected to have an impact – to result in some meaningful contribution to the world, such as addressing a problem found in that world. Faculty members can write papers all they want, but arguably, until their work results in something (directly or indirectly) tangible, it hasn’t had impact.
How do we measure the impact of research? One way is to assess the actual products of research (i.e. research that translates into practical processes or tools). This is helpful, but it doesn’t account for the fact that when research leads to practical results, it is often over a long time period in which early results are adopted by other researchers to produce intermediate results (possibly with many iterations), which ultimately are adopted by other researchers into something directly applicable to addressing some problem in the world.
An alternative metric that can help account for the impact of research can be found by considering the ways in which a piece of published research is cited in subsequent papers by other researchers. The degree to which a published work is cited helps track the degree to which other researchers found that work to be meaningful in the context of their own work, and as such, indicates a form of “impact”. Ultimately, chains of citations connect initial conceptual research contributions to the real-world applications that the initial contributions made possible. While also not a perfect measurement in and of itself, citation data is already widely collected and used and accepted as a useful measure of impact. For an example, go to google and type “Google Scholar Gregg Rothermel” and you can see citation information presented in a few ways. One citation-based metric is the “h-index”, and often you’ll find faculty noting their h-index in their resumes.
As a Department Head, I can easily compare and assess faculty in terms of their numbers of publications, their grants received, their students mentored. But these metrics don’t capture impact. Comparing faculty in terms of citations could help with that, but doing so is more difficult.
The goal of this work is to provide Department Heads with a tool that can be used to compare and assess the impacts of faculty research (both within their own department and across departments) in terms of citations that research has received.
Project Description
I have been able to assess citations using a manual process, but it takes too much time for me to apply this process broadly. The process uses data provided by Google Scholar. Initially I attempted to just scrape Google scholar pages (via cut/paste) obtain information on publications and their citations and place the resulting data into a spreadsheet. With extensive manipulation I could turn this into data that lists paper names, years of publication, and numbers of citations. Doing this for multiple TT faculty I could obtain data that can be compared, and I could then use tools for displaying data sets (e.g., boxplots that provide a view of the distributions of citation numbers per faculty member).
This turned out to be much more difficult than the foregoing paragraph makes evident. For one thing, there can be a lot of “noise” in Google Scholar pages. For some faculty, lists of papers associated with them in Google Scholar include numerous papers that those faculty are not even co-authors of! These had to be weeded out. Also, some papers listed in Google Scholar have not been refereed, have appeared only as preprints, or have appeared only in minor venues that should not be considered.
One potential solution to this problem was to take as input, for a given TT faculty member, a list of their refereed publications, such as is typically present in their CVs (Curriculum Vitae – the academic equivalent of resumes). This is what I ended up doing in my manual process. Given a CV and a list of publications, I search for those publications in Google Scholar and record the information on their dates and citations, and I place the relevant information into a spreadsheet. Then I repeat this for each faculty member being considered. Depending on what I want to visualize of the data, I arrange the data in the spreadsheet such that it allows me to obtain specific visualizations. For example, to obtain a figure providing boxplots presenting the distribution of citations for each TT faculty member among a group of faculty members, I create a spreadsheet in which each column lists a given faculty members’ citations, and use Excel’s boxplot tool on this spreadsheet.
This project needs to provide an automated method for doing the foregoing, but a method that “mimics” my manual process is not required – rather, a method that achieves the same results as that process is what we’re seeking.
The best way to describe what the proposed system needs to achieve is to first list a number of “queries” that I would like a system to be able to handle. Examples are:
- Compare the citations for a given set of faculty members over their entire careers.
- Compare the citations for a given set of faculty members over the past 10 years.
- Compare the citations for a given set of faculty members over the period 2005-2015.
- Compare the citations for the 20 most highly cited papers for each faculty member in a given set of faculty members over (some period).
- Compare the trajectories in citations (i.e., the changes in citation numbers over time) for a given set of faculty members over (some period). A trajectory could consist of numbers per year, or rolling averages.
We could find a way to characterize the set of queries to be supported more generally, using parameters.
A second component of the description involves the interpretation of the word “compare”. To date my primary “comparison” method is to obtain boxplots that let me visualize the data. So “compare” translates to “provide a figure containing a boxplot that shows the citations….”. Other results may be useful, however. For example, a “comparison of trajectories” suggests the use of line graphs that trace changes in numbers over time. Another useful method would be to calculate h-indexes over the given sets of publications being considered. We could explore other options, but to scope this project I suspect that identifying a small finite set would be appropriate.
Obviously, obtaining data and storing it in a manner that supports the types of queries required is a bit part of the project. Presumably the data would be stored in a database where it could be used to provide results for the queries. This could be performed by some front-end tool. Then a back-end tool would enable queries and visualizations.
As a Department Head, I would find a tool that facilitated the following comparisons useful in several ways. Here are some examples:
- To assess the relative impacts of the research of Full Professors within the CSC department at NC State, for use in annual evaluations.
- To assess the trajectories of the impacts of the research of Associate Professors seeking promotion to Full Professor in the CSC department.
- To assess the relative impacts of the research (or trajectories of those impacts) of a set of prospective faculty members who are applying for faculty positions with the CSC department.
- To assess the performance of CSC faculty in terms of impact, relative to the performance of other CSC departments that are thought of as comparable, or that are examples of what we “aspire” to as a department.
Technologies and Other Constraints
I do not have any suggestions for specific technologies to be used; I leave this up to the project team.
I do ask for a solution that can be utilized on common desktop PCs or laptops, without using any proprietary software that must be purchased. Minimally, a first version should function on a recent version of an iMac or MacBook.
I don’t require students to sign over IP for this, but I do expect that the Department of Computer Science at NC State is given the rights to use the system free of charge.
Sponsor Background
The NC State College of Veterinary Medicine is where compassion meets science. Its mission is to advance the veterinary profession and animal health through ongoing discovery and medical innovation; provide animals and their owners with extraordinary, compassionate medical care; and prepare the next generation of veterinarians and veterinary research scientists. With world-leading faculty and clinicians at the forefront of interdisciplinary biomedical innovation, conducting solution-driven research that defines the interconnections between animal and human health, the CVM is a national leader in veterinary research and education.
Background and Problem Statement
Medical best practices for diagnostics in many species (both human and nonhuman animals alike) involves the use of diagnostic blood work to help pinpoint which body systems are functioning properly or not. Laboratory testing of blood samples yields precise values of physiological systems and their functions across a range of measurements, which—for many species—are well documented and understood. At the push of a button lab technicians can generate a report that contains the values for the sample tested as well as a comparison to reference ranges for healthy individuals of the same species. As commonplace as this is for animals like dogs, cats, or horses, no such system is available for poultry (chicken, duck, turkey, etc.). The currently available system involves researchers entering results in a local database and calculating their own ranges, with no compilation of data from multiple farms or projects. At NCSU-CVM, all the test results from poultry blood are entered into an Access database hosted on a faculty members computer, queries are run to export results into MS Excel, and then an Excel add-on comprising macros to compute reference ranges is run to generate a report. The process is labor intensive, ripe for human error, and limits usability of the data due to lack of web-access.
Project Description
In order to facilitate a more useful tool for poultry bloodwork collection and analysis, we will develop a web-based application that allows researchers, practitioners, and owners to submit bloodwork results (with appropriate access controls/anonymization) and review reports that will provide normal ranges for the species and age group derived from compiled data from previous bloodwork results. When test results of an individual are entered, the system will compare the data entered for an individual to the expected value ranges, identifying values that fall outside of the calculated reference values. Bloodwork data can be entered manually, but the system should also support extracting/parsing bloodwork results from uploaded documents such as PDFs or text files. As a stretch goal, users should be able to submit photos of printouts containing bloodwork results and the system should use OCR to extract relevant values.
Students working on this project will be given an existing Access database and the existing Excel macros, and will work closely with Drs. Crespo and Roberts to design, implement, and test a web-application that facilitates collecting bloodwork results, calculating reference values, limiting views of data based on access controls, and generating professional PDF reports that can be shared back with owners and practitioners.
Technologies and Other Constraints
Students have complete flexibility in selecting the technologies to use, provided the output of the project is accessible via browser, generates PDF reports, and can reasonably be hosted on a mid-range desktop PC (before scaling).
Students will be required to sign over IP to sponsors when the team is formed
Sponsor Background
SAS provides technology that is used around the world to transform data into intelligence. A key component of SAS technology is providing access to good, clean, curated data. The SAS Data Management business unit is responsible for helping users create standard, repeatable methods for integrating, improving, and enriching data. This Senior Design project is being sponsored by the SAS Data Management business unit to help users better leverage their data assets.
Background and Problem Statement
With the increased importance of big data, companies are storing or pointing to increasingly more data in their systems. A lot of that data goes unused because a lot of the data is unknown. A data curator can manually inspect a small number of datasets to identify the content, such as travel information or sales records. However, manual classification becomes difficult data as data sizes grow. Storage facilities for big data systems are often called data lakes. As data sizes grow, data lakes frequently become data swamps, where vast amounts of unknown, potentially interesting datasets remain untapped and unused.
Imagine if you could tap into people’s knowledge to help with data curation; to classify, vet, and validate data stored in a system. Doing this sort of curation is hard work though, so why would people bother to do it without some sort of reward to encourage them to participate?
Could you make this process more fun by adding gamification? Similar to websites such as https://genius.com/Genius-how-genius-works-annotated , people that participate in classifying and curating data could earn genius points, gain levels, and earn the recognition of their peers for contributing to the overall knowledge base of data. Your application would serve as a data catalog with pointers to many datasets that could be interesting and useful to people, and that has been curated by knowledgeable end users.
Project Description
In the fall 2021 Senior Design Course, students created the foundation of a javascript web application for gamification called “Data Genius”. They built the framework, but many important features are missing, and there is no mobile option for the app.
The goal of this project is twofold.
1. Create a mobile version of the application
Why mobile? Since “playing” the app involves engaging users to do a somewhat tedious task (curate a dataset) when they have some spare time to do that task, having a mobile version of the application will allow them to perform curation in a fun and engaging way when they have time to do so. This will allow them to increase their standing on the leaderboard and will encourage usage to get more curations completed.
2. Add to the web application important pieces that are missing to make it more engaging
The students did a great job setting up the foundation (logging in, creating storage, initial UI, establishing some dialogs to do the curation, setting up the basic leaderboard), but there are many important features missing that would make the application more compelling for users to engage. Think about the games you play yourself and bring some of those elements into this project. Here are some features that could be added, and you may think of others:
- Can you provide a “reward” when users curate that is instant so that they get positive feedback for their contribution immediately? Something similar to the visual elements you see in something like Wordscapes, where users that complete a puzzle get a “brilliance” sun that shines a little brighter when they complete their task. You may think of other ways to reward users immediately for their contribution. This has been shown to be very effective, from a social science standpoint, in encouraging users to continue to make contributions.
- Should you provide templates or standards to ensure consistency in how curators respond? Right now its very free form, and users can enter anything they want. When curating data with tags, the tags may have some standards, something like schema.org for data. Can you provide a way to choose from previous standards, but still allow people to add additional tags if they need to?
- Can you add some machine learning intelligence to suggest tags that are most popular or are most similar based on the data?
- How can you encourage people to contribute more than once? More than 5 times, 10 times, etc.
- How can you socialize the contributions so that people feel good about what they have done? Gain recognition from peers?
- How can you prevent spammers or non-constructive content from entering data into this socially curated catalog?
- How can you prevent invalid tags, bad words, or content that you don’t want in the catalog from being entered?
- Can you provide some visualization that provides insights into the data and the tags: how many datasets have tag1, how many have tag2, etc.
- Hook in a collaboration tool like Slack and allow collaborators to communicate and tag datasets with additional information or converse about the information in the catalog.
- Provide a method to socialize validation of the curation prior to it being added to the system (to prevent invalid content from being added)
These are just some features, and you probably can think of many more that will make the application much more compelling and useful.
Here is some additional previous project work that can be leveraged for this project:
- This project has a UI design available, including UX research, from SPRING 2021 - CSC 454 - Human-Computer Interaction - DataGenius: Gamification of Data Curation. You may use this UI design as part of your implementation. The results from the UX research study conducted by that team may prove especially helpful. If needed, SAS can provide a package that includes all of the artifacts from the class. There are some of the important screenshots from this project included below in the references section as well.
You may also want to review and evaluate other applications that do this sort of thing socialization of knowledge for ideas such as genious.com (mentioned above), wikipedia, kaggle, google dataset search, and others you may think of. There are some links below that describe the social science around gamification that you also may find helpful and interesting as you build this project.
This project has the following objectives:
- Create a mobile application to complement the web application for curating an index of data assets. Be sure the mobile and the web app link to the same datasource so that people can curate in the mobile version or the web version.
- Update a User Interface that leverages gamification principles to encourage users to curate the data referenced in the index
- Add additional and useful features to encourage users to classify and document the data,
- Optional: Test your application with various users to gauge how well your application encourages participation in the data curation task
Technologies and Other Constraints
- Javascript React frontend
- Python
- Storage - any preferred storage that the students can work with
- Mobile application toolkit (will have to research the options here) or Objective-C if you want to write this for an Apple device
- The data format of the input data to be curated can be assumed to be structured/tabular data (rows and columns), such as datasets in csv format (or like excel files).
- You can leverage other senior project work for suggestions
You will gain some knowledge from this project of machine learning principals. Some background in this area might be helpful, but not required to be successful with this project. Knowledge of Python and REST interfaces will be helpful. You may want to contribute your design into the open-source community. You should have some knowledge of Javascript and will be learning React. You will learn about mobile application development.
Students will be required to sign over IP to sponsors when the team is formed
Sponsor Background
Wake Technical Community College (WTCC) is the largest community college in North Carolina, with annual enrollments exceeding 70,000 students. The pre-nursing program in the Life Sciences Department runs a two-course series on Anatomy and Physiology, where this project will be used, with enrollments exceeding 800 annually. Additionally, this project is expected to assist over 1,000 biology students when fully implemented.
Background and Problem Statement
Biology students as well as pre-nursing students need to understand how the body carries out and controls processes. Proteins have a diverse set of jobs inside cells of the body including enzymatic, signaling, transport, and structural roles. Each specific protein in the body has a particular function and that function depends on its 3D conformation. It makes sense then, that to alter the activities within cell or body, proteins change shape to change function. One important example of this is hemoglobin. Hemoglobin is a huge protein found inside red blood cells and its primary function is to carry oxygen and carbon dioxide to and from cells of the body, respectively. Structures inside hemoglobin bind to oxygen dynamically at the lungs and then release the oxygen at metabolically active tissues.
As a beginning biology or pre-nursing student this is a difficult process to imagine from a 2D image in the textbook, and we have worked to create a tool that helps visualize protein dynamics using augmented reality. In various iterations, the tool has supported the use of AR tags to change the environmental factors that influence protein structure and function, basic animation of structural changes of 3D protein structures, and the creation of structured activities to support educational use—although never all at the same time. Integrating and enabling all of these features, alongside several new ones to make the tool more suitable for online education, is the emphasis of this project.
Project Description
Supporting decentralized collaborative AR experiences for teams of students or students and instructors through the use of real-time video collaboration and recording, integrating animation features with the use of multiple AR tags, and connecting to the instructor’s assignment specification and grading views will be the main goals. As a stretch goal, integrating with Blackboard (WTCC’s LMS) to facilitate rosters and grading is also desirable.
The existing AR app uses Three.js, existing crystallographic information files (.cif) and parsers (LiteMol), and a DB backend for identity and content management. The .cif files are an open format where structured data describing molecular structure are encoded. The files contain information about the components of the molecules, their locations, and their relationships. There are three main implemented use cases:
- Instructors can specify protein molecules (e.g., hemoglobin, see Figure) using .cif files, define the environmental factors (e.g., temperature, oxygen, etc.) that impact protein structure, and set rules for triggering structural transitions.
- Students can visualize the 3D structure of proteins by placing an AR tag on surface, loading the web-app on their mobile device, and moving around the environment. They can further manipulate the simulated environment by applying environmental factors (either through UI controls or AR tags).
- Instructors can define “lessons” for students that prompt them to answer certain questions by investigating the 3D structure and submitting responses through the web-app (multiple choice, short answers, or submit a screenshot).
These three use cases are supported to a varying degree in different implementations of the app, and bringing all of those functionality under one app version is a primary goal. In addition, in-person collaboration is currently feasible through the use of AR tags and multiple devices. An additional use case to design for is to support remote collaboration among students or students and instructors.
- Multiple students or multiple students and instructors can collaboratively view a 3D structure, even if not co-located, and share the role of applying environmental manipulations to influence protein structure.
Technologies and Other Constraints
- This must be a web-based app with student AR views supported on mobile devices, and instructor/backend systems supported on desktop browsers.
- Three.js (existing, can be replaced)
- AR.js (existing, can be replaced)
- LiteMol (existing, can be replaced)
- Spring (existing)
- Gradle (existing)
Students will be required to sign over IP to sponsors when the team is formed
Sponsor Background
Cisco (NASDAQ: CSCO) is the worldwide leader in technology that powers the Internet.
Our Purpose: To power an inclusive future for all.
Our Mission: To inspire new possibilities for our customers by reimagining their applications, securing their data, transforming their infrastructure, and empowering their teams.
Our Commitment: To drive the most trusted customer experience in the industry with our extraordinary people and great technologies.
CX Cloud, a brand-new platform for customer and partner technology lifecycle experiences. CX Cloud aligns Cisco technology solutions to customer needs. Currently, the CX Cloud platform performs network optimization with AI (Artificial Intelligence) based actionable insights, provides deployment best practices guidance, and maintains asset visibility. New tools, features, and functions can be introduced to customers through CX Cloud with minimum disruption to production environments.
Background and Problem Statement
“Virtual teams are like face-to-face teams on steroids – they are more cumbersome and provide more opportunities for team members to lose touch, become demotivated and feel isolated,” Brad Kirkman (Poole College) says. Dr. Kirkman spent time partnering with three companies – Cisco, Alcoa, and Sabre – to examine their virtual team operations and came away with three best practice areas virtual teams should focus on – leadership, structures, and communication.
Leadership - How a team is designed – which includes everything from who is included on the team, what their roles are, and which technologies and performance metrics are used. The practice of empowerment and shared leadership by allowing team members to take on some of the leadership responsibilities as they would typically oversee in a face-to-face setting – such as rotating team members’ responsibility for sending out the agenda, facilitating a meeting or taking notes in virtual meeting spaces.
Structures - Improving structures the team has in place to support healthy team processes – including coordination, collaboration, conflict management and decision making. Having a shared vision and language, and leaders who are regularly checking in on team members, is especially important for a diverse team.
Communication – What happens before, at the start of, at the end of and in-between meetings is most critical. Dr. Kirkman says. “I recommend leaders always take the first five minutes of any meeting for small talk – allow the team to chat, celebrate personal accomplishments and news and build that camaraderie that comes with being a team.”
To support Dr. Kirkman’s research and to support wellness of employees engaged in virtual teamwork, new software tools may be designed and created to provide employees the ability to feel more connected, motivated, and engaged. Dr. Kirkman’s research also provides focus on building a sense of psychological safety through asking for input early and often, making sure that virtual team members feel included and valued.
https://poole.ncsu.edu/thought-leadership/article/equipping-leaders-to-support-virtual-teams/
Project Description
Students will resume a Fall 2021 Semester project for software tools to assist employee wellness leveraging existing student design and software application to help measure employee’s self-reported wellness in key areas of leadership, structures, and communication to enhance collaboration, individual leader contributions, and communication to peers/management groups via AI personas.
Project design should extend methods for user-centered design, data collection, polling intervals, insight reporting, and wellness projections that provide participating user personas and their organizations to gain key insight areas for employee wellness and engagement.
Functional areas should allow participating users the ability to remain anonymous and combine their results with other participating users with trending, historical retrospectives, and future data projections to understand personal and team impact in key areas of leadership, structures, and communication as a foundation to employee wellness.
Added areas that the solution may explore can include:
- Areas of self-reported user feedback through anonymized summary data for indicators of employee's needs, concerns, and priorities
- Indicators/intelligent bots that leadership and management teams could leverage to improve meetings, teams, business goals, and employee wellness.
Software solutions should expand or redesign assessment indicators to support healthy team leadership, structures, and communications through standardized questions and measurement scale.
Example of indicator questions “I (was/was not) able to get my point across in my last meeting”, “I (love/loathe) tasks I need to complete from my last meeting”, “I felt (heard/unheard) in my last meeting”, “I felt that my last meeting was a great/good/poor/bad use of my time”, This meeting was “(productive/unproductive)”)).
Consider asking open ended questions in polls. (I.e., “I would keep doing ______”. “I would change ________”. “I value ____”, “I do not value _____”.
The goal is for users and leaders to gain deeper perspectives and help users to receive assistance/encouragement and build empathy to prevent burnout.
Technologies and Other Constraints
Software tools to aid employee’s wellness can leverage prior project code and data structures developed on AWS platform and should be accessible from web/mobile (to support use cases for hybrid work and team collaboration). Teams may also consider usage of API vs. Functions for reliability/extensibility. Team may also build employee, management, and virtual assistant profiles/personas for functional application testing.
Students should create a storyboard detailing a business organization, personas, and example interactions with the created software tools to help employee’s wellness or outcomes along with AI assisted personas to support employees seeking support resources. Students may solve for unidentified workplace issues/challenges and possible outcomes related to leadership, structures, and communication.
The Fall 2021 Senior Design Cisco project team built the current system using AWS EC2, MySQL, NGINX, Node.js, Express, JQuery and Bootstrap.
Constraints - No expected issues in development since users would be persona based. No expected application dependencies as a stand-alone app.
Students will be required to sign over IP to sponsors when the team is formed
Sponsor Background
Professors Price and Barnes @ NC State and Morrison @ UVA are working together to build tools and processes to help students do a better job solving computer science problems with programs.
Background and Problem Statement
Learning to write programs is a fundamental part of CS courses, but it can also be a primary source of frustration and discouragement for many students, with impacts on students' self-efficacy. Negative programming experiences may occur because students do not know where to start or how to decompose a complex problem into more manageable sub-tasks, because they have difficulty predicting how much time it will take to complete, or because they are unsure if they are making progress.
Our vision is to improve students' persistence, self-efficacy and learning in introductory CS1 and CS2 courses by providing tools that help students break a programming problem down into manageable sub-task tasks, and then solve those sub-tasks individually. This makes the problem more manageable, while also teaching decomposition. Our preliminary research suggests that this subgoal-based support can improve students' engagement and persistence in CS, and reduce failure rates.
Problem Statement: The problem is that novice students need help decomposing problems into plans for programs. We seek to build a tool that allows students to make plans at higher levels of abstraction than code, while still allowing students to execute their plans like a program. The senior design project should build a prototype tool that demonstrates the capability of performing problem decomposition, breaking a problem down into parts, specifying how the parts work together, and being able to execute the plan. Furthermore, the student should then be able to implement each part of the plan in code.
Project Description
The senior design team would build a usable planning tool, building on a prototype that Dr. Price has constructed, to assist novice programming students in breaking down programming problems into parts (i.e. "plan blocks"), and specifying how they work together to solve the problem.
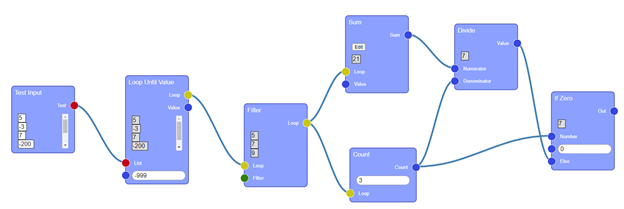
Above is a screenshot of the prototype planning tool, allowing students to select the core components of their program (blue blocks), define how they relate to each other (lines), and execute the plan with a test input.
Deliverables will include: a tool that students can use to plan solutions to example AP CSA problems and a set of documentation, consisting of video recordings of using the tool to solve each problem. Each video should demonstrate defining and connecting decomposed modules for solving each problem, specifying how the parts work together, including testing of individual modules as well as the overall problem solution, showing how each part is executable, and demonstrating how each part can be programmed and/or changed by students.
Features of the planning tool that the team will likely need to implement include:
- Additional features for the front-end:
- The ability for students to define and implement their own plan blocks, which can then be edited and used in other parts of the plan.
- An in-system textual code editor that supports Python, which can be used to write corresponding implementation code for each part of the plan.
- New plan blocks that support solving AP CSA problems from multiple years.
- A back-end, which supports:
- User accounts and logging-in.
- Saving and loading projects to a database.
- Logging/telemetry of student interactions with the system.
- A/B testing features that enable features to be enabled/disabled for studies.
- The ability to execute Python code in a sandbox to evaluate it (e.g. using existing libraries).
Technologies and Other Constraints
- The product must be web-based, written in Javascript or another web-based language.
- The current prototype uses Vue.js for the front-end, and this is suggested for this project.
- The project requires creating a back-end, and the technology for this is flexible.
- Student users must be able to write parts of programs in Python.
Sponsor Background
The Rumble Harvester project will be a co-sponsored effort between the Friday Institute and MCNC.
Friday Institute
The mission of the Friday Institute is to advance education through innovation in teaching, learning, and leadership. Bringing together educational professionals, researchers, policy-makers, and other community members, the Friday Institute is a center for fostering collaborations to improve education. We conduct research, develop educational resources, provide professional development programs for educators, advocate to improve teaching and learning, and help inform policy making. We also support educational institutions and government agencies with thought leadership around some of the most pressing technology infrastructure issues of the day, including cybersecurity, equitable broadband access and educational technology.
MCNC
MCNC is a 501(c)(3) non-profit client-focused technology organization. Founded in 1980, MCNC owns and operates the North Carolina Research and Education Network (NCREN), one of America’s longest-running regional research and education networks. With over 40 years of innovation, MCNC provides high-performance services for education, research, libraries, healthcare, public safety, and other community anchor institutions throughout North Carolina. NCREN is the fundamental broadband infrastructure for over 850 of these institutions, including all public K-20 education in North Carolina. As one of the nation’s premier middle-mile fiber backbone networks, MCNC leverages NCREN to customize protected Internet, cybersecurity services, and related applications for each client while supporting private service providers in bringing cost-efficient connectivity to rural and underserved communities in North Carolina.
Background and Problem Statement
The North Carolina General Assembly (NCGA) recently provided funds for School Connectivity to assess K-12 Cybersecurity capabilities and implement a statewide K-12 Cybersecurity program. In the K-12 assessment report presented to the NCGA in late June 2021, several key areas for improvement were identified. The Friday Institute (FI) is supporting the Department of Public Instruction (NCDPI) to perform subsequent planning and implementation efforts of deploying a series of people, process, and technical measures to improve the cybersecurity posture across the public schools (PSUs) of North Carolina. A foundational step identified by the cybersecurity program is the Inventory and Control of Enterprise Assets. Each PSU organization needs to have a continuous accurate inventory of all the digital device assets on the network in order to keep track of the items that need to be secured and/or elements that introduce risk to the organization. The basic premise is that an organization cannot secure a device if they are not aware it even exists.
Project Description
The Friday Institute and NCDPI recently deployed a pilot of the Rumble asset discovery platform that scans the IT and Operational Technology (OT) environments in a PSU network to provide a foundation for its asset inventory, attack surface reduction, and incident response programs. The pilot was a success and the Rumble platform is being expanded statewide. Each PSU will deploy a series of explorers that perform a detailed network scan to inventory each device and provide a rich set of data associated with the asset.
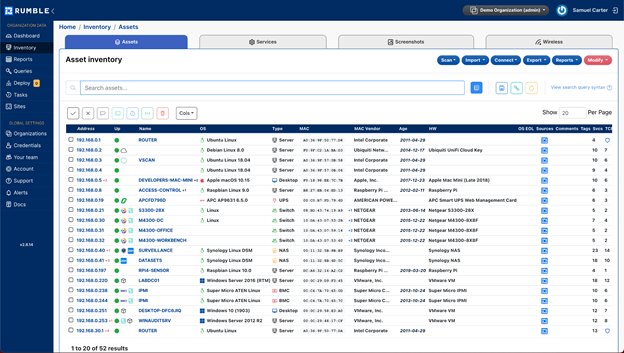
The current challenge with Rumble is that asset data can only be viewed, searched, and analyzed for a single PSU at a time. If you want to search for a particular asset, service version number, vulnerable device type, etc. across more than one organization, you must switch to each organization and repeat the search process again. This approach is not scalable across the 319 individual PSU organizations in North Carolina.
2021-2022 NC PSUs - https://www.dpi.nc.gov/media/12505/download?attachment
This project will build or integrate an appropriate web portal that will provide an aggregated view, key metrics, analytics, and search functions of all asset data across 319 PSU Rumble deployments.
Other key requirements of the Rumble Harvester solution will be:
- to provide a command line ad hoc search capability that can perform simple and complex queries across all or subset of asset data
- to provide a web-based ad hoc search capability that can perform simple and complex queries across all or subset of asset data
- to provide ad hoc and automated reporting functions in web portal include automated reports that can be generated based on schedule or via triggered asset condition
- Leverage the Rumble API for user authentication and role-based access controls of web portal functions
- Stretch goals
- Perform vulnerability analysis on applicable asset data results and generate mitigation action reports
- Provide aggregate data export functions AND/OR an integration API method for external systems to be able to query aggregate data
Technologies and Other Constraints
Students will need to perform some necessary market research, feasibility analysis, and assessment planning (with support/direction from sponsors) to best inform the Rumble Harvester design and architecture. However, students must use the following known technologies for this project:
- North Carolina Department of Education Rumble Service (Production and Test Tenants)
- Rumble REST API - https://app.swaggerhub.com/apis-docs/RumbleDiscovery/Rumble/2.7.0
- Rumble Open Sources Repo - https://github.com/RumbleDiscovery
- The solution to run/operate in Amazon AWS to enable easily scalable compute resources
- Students must perform a brief assessment on the Rumble API and Visualization tools to determine the best approach between leveraging an existing commercial platform for the web portal or building a new one. Commercial products to be evaluated will be a data visualization tool such as Amazon QuickSight, Tableau, or D3.js
- The database shall be AWS-based MySQL, PostgreSQL, or Amazon Redshift based on research
- Use of ML techniques and tools such as Amazon SageMaker is highly encouraged to gain additional insights into asset data sets
The following limitations, constraints, and considerations will need to be accounted for:
- The asset data students will have access to will need to remain confidential. This will be live asset data for K-12 students and staff and potentially contain sensitive data and critical cybersecurity vulnerabilities with a PSU. This data cannot be shared, discussed, or presented outside of the student team and support personnel associated with the project.
- The Rumble platform has a planned deployment beginning in January 2022 for PSUs. Therefore, the full asset data will not be available at the beginning of the project BUT enough data will be available for sufficient design, implementation, and QA functions. The amount of asset data available will significantly increase as the semester progresses and it will be expected students to validate the solution will scale based on data volume.
- The Friday Institute and/or MCNC will provide any necessary equipment for the development, testing, and deployment of the Rumble Harvester
Sponsor Background
You can’t protect what you can’t see. JupiterOne is a Morrisville, NC based cloud security start-up that provides security practitioners a complete view of their organization’s cyber assets, including user permissions, source code repositories, cloud infrastructure, and more. More importantly, JupiterOne’s cloud-native graph database enables security teams to use the relationships between their cyber assets to detect and remediate complex configurations that may leave their organization vulnerable to attacks.
Using information from JupiterOne’s open-source integrations, security teams could identify a Snyk code vulnerability that targets a Github repository that publishes an NPM package that’s used to deploy a container in AWS. These cross-platform relationships shine light across the entire potential attack surface and enable the team to quickly remediate all the affected resources before an attacker can target them.
Background and Problem Statement
Security is not a zero-sum game. When security engineers from different organizations collaborate to improve their security posture, everyone wins (except for the attackers!). This is why JupiterOne is so passionate about creating open-source software - by building our integrations to Azure, GCP, Github, and others in the open, we expose robust graph-based ingestion engines that can be audited and continuously improved with input from the security community.
Starbase is an open-source tool with a mission: Democratizing graph-based security analysis and asset visibility. Starbase is designed to orchestrate any number of our integration projects and optionally push the collected data into Neo4j. JupiterOne recently launched Starbase, based on foundations of the NCSU senior design students' work. Last semester, NCSU Senior Design students built an open-source tool that leveraged our integrations to push data into an open-source graph database, Neo4j. This enables security practitioners who are not using our enterprise product to get value from the work we’ve done to ingest and model this data. We've made great strides toward accomplishing the mission of Starbase, and now we'd like to take the project to the next level.
Project Description
The students should build a web application to interact and/or monitor the execution of the Starbase tool. This program should be containerized and should allow the user to run this as a local application to interact with their local Starbase configuration. This web application should be supported by an effort to capture the execution history of the integrations in a database that can then be served up to users and describe whether the jobs have succeeded or failed. Given that Starbase can be used to orchestrate any number integrations, this would allow for a more user-friendly interface for monitoring ingestion of data into the graph.
Technologies and Other Constraints
Required tools:
- UI library: React (Typescript)
- Components: MaterialUI
Optional tools:
We encourage the students to explore alternatives in each of the below, but we have listed our preferred technologies across this project:
- Web framework: Express
- Local containers: Docker
- Runtime: js (Typescript)
Students will be required to sign over IP to sponsors when the team is formed
Sponsor Background
Katabasis is a non-profit organization that specializes in developing educational software for children ages 8-15. Our mission is to facilitate learning, inspire curiosity, and catalyze growth in every member of our community by building a digital learning ecosystem that adapts to the individual, fosters collaboration, and cultivates a mindset of growth and reflection.
Background and Problem Statement
Rural youth face a series of barriers from entering the computing job market. Aside from living in regions with limited technology infrastructure, rural schools are not as likely to have advanced computing courses and rural areas tend to be slow to adopt disruptive ideas and technologies. For computing to be more widely adopted by these groups, materials need to be created that are culturally meaningful and demonstrate how computing will impact their future.
Project Description
We are seeking to continue development of a game-based learning environment that teaches children core computer science principles in a simulation themed around the future of farming. We aim to increase the appeal of computer science to rural and other populations who are underrepresented in computer science fields. The game already has several core mechanics and features integrated, most notably, a block-based coding system that players use to program drones to perform various actions throughout a plot of farmland, where they can till soil, plant seeds, and water them, and these crops will grow as game time passes. The block based programming system currently includes basic variables and loops, as well as the aforementioned actions that interact with the farm. The senior design team will be initially tasked with familiarizing themselves with the codebase. Then the students will move on to implementing major features and mechanics to the game.
We envision students adding the following features to the game:
- Soil Health: Add in a system whereby the soil has values for various different important nutrients for crop growth (nitrogen, carbon, water, etc.). These values will influence the growth of different plant species in different ways (tomatoes require higher levels of potassium, while corn requires higher levels of nitrogen). Crops will add or subtract these nutrient values depending on the specifics of their growth cycles. We will provide the relevant agricultural information, what we want from the team is to actually implement it into the game.
- Drone Attachments: Add a system whereby the player acquires new attachments for their drones, and this enables new features, most prominently, access to new programming blocks. As a part of this system, students will be expected to expand on the existing coding blocks available to students, adding in conditionals, functions (ability to create custom blocks, i.e. functions), arithmetic & boolean operators, among others.
- Pests & Pest Control: Add in a variety of pests that will hinder plant growth in different ways; different pests may target different plants, appear in varying numbers or frequency, affect different values on the farm, etc. We will provide the relevant agricultural information, what we want from the team is to actually implement it into the game.
- Economy: Implement a basic economic system into the game, where seeds and certain drone parts/action will cost money, and harvested crops can be sold for money.
While the game is intended to primarily serve populations that are underrepresented in technology fields, it is designed to broadly appeal to children ages 8 to 15 by incorporating concepts from multiple academic and artistic disciplines. By catering to these diverse interests, children will be able to grasp new or challenging concepts by connecting the material with their individual affinities and experiences.
In the development of this game, we want our team to be very conscious of all of the stakeholders at play and take all of their needs into account. These include, but are not limited to: the children playing the game, the educators utilizing the game, the researchers hoping to collect data from the game, our company developing the game, your “managers” (teachers) looking to measure your performance, etc.
In addition to developing the game, the team will be expected to test not only the functionality of the software, but also its effectiveness at meeting the various goals, including mastery of content, engagement/enjoyment, and replayability. We will want the team to design and implement two user experience testing sessions that they will conduct on middle school students. We will arrange for our team to have access to these students at around the midway point of the semester, and handle all of the scheduling and permission logistics that entails. However, we expect the team to be the ones to both design and conduct the sessions. Feedback from these sessions will be used to determine improvements and changes to be made throughout the latter portion of the Senior Design Team’s development, in the second half of the semester.
Technologies and Other Constraints
The game is made in the Unity game engine, and as such will have students programming in that interface, and using C# language syntax. We also require the game to be hosted online via Unity’s WebGL functionality or another comparable service.
Other technical constraints include the ability to run the game on computers with low-mid tier specs, and ideally, a web version that does not require high speed internet access. This is essential to ensure the game is accessible to the communities we are targeting.
Students will be required to sign over IP to sponsors when the team is formed
Sponsor Background
The Senior Design Center of the Computer Science Department at NC State oversees CSC492—the Senior Design capstone course of the CSC undergraduate program at NC State. Senior Design is offered every semester with enrollment approaching 200 students across several sections. Each section hosts a series of industry-sponsored projects, which are supervised by a faculty Technical Advisor. All sections, and their teams, are also overseen by the Director of the Center.
Background and Problem Statement
Each Senior Design team is composed of 3-6 students who work closely with the industry sponsors who proposed their project and the Senior Design teaching staff. To facilitate communication between students, sponsors, and the teaching staff, Senior Design uses the Slack platform. A new Slack workspace is created every semester with some public channels common to all sections and teams, and private channels for the teaching staff, for each section, and for each team.
Senior Design uses the free tier of Slack each semester, as it provides most of the functionality required to support the class. However, given the large—and growing—enrollment, the 10,000 searchable message limit offered by the free tier is reached very quickly into the semester. This limits the entire workspace to viewing just the 10,000 most recent messages sent collectively. Being able to retrieve messages sent early in the semester is many times useful. For example, teams may want to recall discussions on how their project was set up or configured, look back at early interactions with sponsors when requirements were being clarified, or revisit instructions provided early by the teaching staff. After reaching the 10k message limit, retrieving these early messages is impossible unless the workspace is upgraded to a paid plan.
Project Description
For this project, you will build a Slack bot that will archive a Slack workspace as it is used. When installed, this bot will use the Slack API to listen for Slack events whenever messages are sent, reactions are added on messages, files and resources are shared, etc. These events will be stored in a database in such a way that the historical record can be reconstructed and queried. For example, messages will be associated with the user who sent them, a timestamp, the channel it was sent on, a thread where it belongs, as well as any other metadata available from Slack. When possible, shared files should also be archived.
The second part of this project involves creating an interface for this database that mimics the Slack GUI and allows users to query the information stored on the database/archive. To use this interface, users should authenticate with their NCSU accounts so that they can only see and search messages that would normally be accessible to them. For example, users should only be able to view data from public channels, channels they have access to, or direct messages where they are involved.
A neat feature to add, if time allows, is support for slash commands on the Slack bot to allow querying historical messages from the archive directly from Slack. For example, a command issued on a channel with start and end timestamps as parameters will display the messages sent on that channel within that time window. Additional parameters and/or commands can be used to filter messages by keyword, type of content, or a combination of all of these.
Technologies and Other Constraints
Students are asked to use a relational database of their choosing. PostgreSQL or MariaDB are suggested.
To implement the Slack bot, students can choose between Python, PHP, or NodeJS. The GUI should use React with authentication via NCSU Shibboleth.
Although not required, using Docker containers is recommended for this project.
Sponsor Background
Siemens Healthineers develops innovations that support better patient outcomes with greater efficiencies, giving providers the confidence they need to meet the clinical, operational and financial challenges of a changing healthcare landscape. As a global leader in medical imaging, laboratory diagnostics, and healthcare information technology, we have a keen understanding of the entire patient care continuum—from prevention and early detection to diagnosis and treatment.
Our service engineers perform planned and unplanned maintenance on our imaging and diagnostic machines at hospitals and other facilities around the world. Frequently, the engineers order replacement parts. The job of the Managed Logistics department is to make the process of sending these parts to the engineer as efficient as possible. We help to deliver confidence by getting the right part to the right place at the right time.
Background and Problem Statement
While we strive for 100% accuracy when shipping spare parts, occasionally we come short of the engineer’s expectations. When this happens, the engineer can submit feedback for our team. When we get feedback, we open a ticket that allows us to keep track of the issues, respond to the customer, and address any outstanding needs. Our goal is to respond to each ticket in a helpful and professional manner, and we are looking for a data-driven way to uphold this standard of customer service.
Project Description
Our wish is for a software solution that can analyze the tone of our responses to the engineers using sentiment analysis. One use case we envision is being able to feed a CSV with the date, team member, and response as columns to build a profile of each team member. A polished and presentable UI should allow for visualization of team member’s profiles and a team, as a whole. The profile could indicate recent improvement or decline with regards to the helpful attitude of our responses.
As a stretch goal, the system could allow the model to be adaptable (i.e. if the model detects a positive attitude, but the message was actually negative or inappropriate, the message could be flagged to aid in learning).
Technologies and Other Constraints
Our only constraint is that if a web server is used, it must be compatible with the Microsoft Azure cloud platform. We are open to ideas from the team with regards to the technology and sentiment analysis technique.
Students will be required to sign over IP to sponsors when the team is formed
Sponsor Background
Dr. Kapravelos is an Assistant Professor at NCSU whose research interests span the areas of systems and software security. This includes protecting the browser at all levels, from designing a secure browser architecture to measuring and understanding large-scale Internet attacks. Dr. Kapravelos’ current research is focused on understanding how the web works and evolves over time and how it can be made more secure for users. Dr. Kapravelos is partnering with the Laboratory for Analytic Sciences (LAS), a research organization in support of the U.S. Government, working to develop new analytic tradecraft, techniques, and technology that help intelligence analysts better perform complex tasks.
Background and Problem Statement
Modern web security and privacy research depends on accurate measurement of an often evasive and hostile web. No longer just a network of static, hyperlinked documents, the modern web is alive with JavaScript (JS) loaded from third parties of unknown trustworthiness. Dynamic analysis of potentially hostile JS currently presents a cruel dilemma: use heavyweight in-browser solutions that prove impossible to maintain, or use lightweight inline JS solutions that are detectable by evasive JS and which cannot match the scope of coverage provided by in-browser systems.
In 2019, our team built VisibleV8, a transparently instrumented variant of the Chromium browser for dynamic analysis of real-world JS. VisibleV8 lets us passively observe native (i.e., browser-implemented)
API feature usage by popular websites with fine-grained execution context (security origin, executing script, and code offset) regardless of how a script was loaded (via static script tag, dynamic inclusion, or any form of eval). Native APIs are to web applications roughly what system calls are to traditional applications: security gateways through which less privileged code can invoke more privileged code
to access sensitive resources.
Project Description
This project aims at leveraging VisibleV8 to build a platform that makes web behavior analysis accessible to everyone. The project has two main parts:
- Automate the analysis: The team will need to build an automated pipeline that accepts a URL, spawns a VisibleV8 instance, visits the submitted URL and gathers all the produced logs.
- Visualize the results: VisibleV8 currently produces low-level logs that contain all the function calls and property accesses that were called while visiting a page. This is sometimes in the order of a few gigabytes, making it not useful for a human analyst and also hard to show on a website. The team will work on abstracting the used functionality to higher levels, aggregating the behavior in a human-perceived way. They will also build a web interface that reflects this, but also allows the user to drill down to specific functionality of interest and “zoom in” into that behavior to see it in detail.
Technologies and Other Constraints
The students are expected to work with Docker containers, building Chromium from source code, building a web interface with Flask and Jinja, PostgreSQL, NFS, Kubernetes and D3.js. The students are also expected to explore if better technologies can be applied than the ones listed here.
Sponsor Background
Cengage Group is a global education technology company serving millions of learners. We provide affordable, quality digital products and services that equip students with the skills and competencies needed to be job ready.
WebAssign is a platform utilized in the Higher Education learning space to provide online assessment tools to students and instructors.
Background and Problem Statement
As a SaaS solution, WebAssign must be careful that any code releases do not negatively impact customers. The engineering team takes great care in scheduling code releases to be during windows of low usage, and when no high-priority assessments (such as exams and quizzes) are taking place.
Currently, the WebAssign engineering team utilizes three processes to determine the window of time for a code release:
- A Perl script that creates a spreadsheet of assessments and their due dates
- Automatically generated daily graphs of basic application usage
- A wiki page that documents general information around the required ordering of services during a release, along with institutional knowledge to understand cross-service dependencies and required cache clearing
The three processes are functional but are not intuitive or quick to use for engineers learning and running a code release.
Project Description
The WebAssign engineering team would like a web application that can quickly and clearly help them to determine the best time to schedule a code release. The web application will contain three components – a Due Date Report, a Usage Report, and an Order of Operations Tool.
The Due Date Report will query the WebAssign database for assessment due dates and associated metadata for a given day, process the results, and present the user with a detailed view with recommendations of code release windows. The processing of assessment data and code release window recommendations will need to consider multiple factors, such as how long the assessment has been available to students, the type of assessment (exam, quiz, homework, etc.), and the number of students on the roster.
The Usage Report will query the WebAssign database for customer usage for a given day and present the user with a set of graphs that show total application usage, usage by faculty, usage by students, and usage of certain functionality such as the scheduling of assessments and creating courses.
The Order of Operations Tool will allow the user to select the repositories involved in the release and be presented with an optimized ordering and grouping of release actions. Based on predefined rules, the tool will be able to determine repository ordering, along with other dependencies such as cache clearing. The output will also include the amount of time required to run the release. The available repositories and their predefined rules will be configurable through the tool.
Based on the output of the three components, a WebAssign engineer will be able to use the Order of Operations Tool to know the amount of time required to run the code release and reference the Due Date Report and Usage Report to pick the best time window for the event to minimize any potential negative impact to customers.
Technologies and Other Constraints
The required technologies to use are Java, Spring Boot, and MySQL for the backend, and Typescript and React for the frontend.
The application must be a web application.
Backward instructional design involves outlining learning objectives (“what should students know”), creating assessments aligned to the learning objectives to measure evidence of student achievement (“how will students demonstrate knowledge”), and planning instructional methods (“how will students gain the knowledge and skills to meet the learning outcomes”). Using backward design, instructors can more easily analyze student performance in courses for course improvement and accreditation efforts.
In addition, accreditation organizations like the ABET Computing Accreditation Commission help ensure that degree programs meet quality standards of the profession for which students are being prepared. To observe whether a program meets these standards, ABET requires rigorous analysis of coursework, learning objectives, and student performance on course assignments. For example, in computer science, faculty members who work to manage the accreditation effort must map course objectives for all core computer science courses to ABET objectives before analyzing student performance against course objectives. This analysis helps the accreditation organization ensure that the degree program addresses all required objectives for the degree program, and that faculty constantly work to improve courses and the quality of the degree program.
An existing web application supports development, maintenance and assessment of backward instructional design in the NCSU Computer Science department. The Spring 2022 senior design team will expand the existing Learning Objectives Report to:
- Add authentication that requires NCSU credentials (e.g. Shibboleth)
- Add access control to support separating functionality and access to different people, including course instructor, accreditation faculty, and administrator
- Create additional types of reports of student performance against learning objectives
- Allow accreditation faculty to map courses and course objectives to ABET objectives (see https://www.csc.ncsu.edu/academics/undergrad/bs-csc.php)
- Allow instructors or accreditation faculty to upload sample student submissions for each assignment in a course
- Create reports for accreditation faculty (e.g. reports of student performance across courses for ABET objectives)
Ultimately, the web application could help instructors more quickly identify students who need additional support, extra practice on specific topics, or other educational interventions to support student achievement and success. Similarly, the web application will help accreditation faculty organize materials for accreditation and facilitate analysis of course deliverables for ABET accreditation and improving quality of the degree program.
Required Technologies
This project will give students opportunities to work with several technologies, including:
- Angular
- Java
- Spring Boot
- MySQL
Sponsor Background
The Laboratory for Analytic Sciences is a research organization in support of the U.S. Government, working to develop new analytic tradecraft, techniques, and technology that help intelligence analysts better perform complex tasks. Processing large volumes of data is a foundational capability in support of many analysis tools and workflows. Any improvements to existing processes and procedures, whether they are measured in time, efficiency, or stability, can have significant and broad reaching impact on the intelligence community’s ability to supply decision-makers and operational stakeholders with accurate and timely information.
Background and Problem Statement
Interesting questions most often cannot be answered accurately using data from a single domain. For example, a medical physician cannot accurately diagnose a patient’s condition based solely on the patient’s heart rate. Instead, the physician gathers and fuses information from multiple data “modalities” (heart rate, temperature, appearance, history, etc) to assist their diagnosis (i.e. their “sensemaking”). A “knowledge graph” is a type of technology which is richly suited to support sensemaking analytics over multimodal data. Connections between different data objects are explicitly defined, which creates the graph, and enables inferences and analysis via graph analytics that would otherwise be impractical. To make an apt analogy, a knowledge graph is like an encyclopedia for machines in that, just as an encyclopedia is organized in a natural way for humans, the knowledge graph organizes data in a way that is natural for machines to read and, possibly, with the help of AI/ML tech, comprehend.
In this project, we seek to generate a knowledge graph containing two data modalities pertaining to the activities of President Richard Nixon and his staff during his administration. In particular, the first data set is the famous audio recordings taken in the White House, and elsewhere such as Camp David, during Nixon’s presidential tenure. These audio files have been transcribed into text. The second data set is the Presidential Daily Diary during Nixon’s administration. The diary contains the official record of the physical whereabouts of the President at a very granular level (to the minute), and often includes those who were in the room with him at a given meeting. The combination of where the President is, who is in the room, and what is being said will enable historical analysts to probe this famous data set with more interesting questions than could be possible within the single data domains.
The ability to explore the enriched, multimodal, data set is of great interest, as it will lead analysts to understand what interesting questions they might now be able to ask of the data set. Because exploratory analysis of the knowledge graph is paramount, we also seek to create a web application which implements an open-source knowledge graph visualization application hosted on an LAS virtual hardware system. The key functions of this application will be to enable exploratory analysis of the knowledge graph, such as zooming, filtering, querying, algorithmic graph layouts, and viewing of temporal dynamics.
Project Description
The Spring 2022 Senior Design team is asked to design and generate a knowledge graph containing the content of the Nixon administration audio recordings, along with the content of the Presidential Daily Diary. The team is also asked to implement a web application allowing users to explore the generated graph using an existing knowledge graph exploration & visualization tool.
To create a knowledge graph, the team must consider its design. We prefer that the team use a labeled property graph model (e.g. Neo4j) rather than an RDF-based model. The “design” element of a knowledge graph largely comes from choices regarding the ontology of the graph. Owing to the time available for this effort, we strongly recommend that the team utilize a fairly basic ontology, focusing on people, places, objects, and time, rather than some more complicated and rich ontology. Ultimately, a design decision must be made by the team striking a balance between functionality and practicality.
Text transcripts of the audio content are available to use as input into natural language processing (NLP) algorithms. Software must be written to apply the NLP algorithms, and to feed the output into the knowledge graph.
To extract the location and social information from the Presidential Daily Diary, the team will need to write a parsing script. The Diary is highly structured, so extracting its information will be significantly less complicated than that of the audio transcripts, though it will likely require use of NLP algorithms just the same. Software must also be written to feed the parsed information into the knowledge graph.
Finally, to develop the exploratory capability, the team should select an existing, open-source, knowledge graph visualization tool and wrap the tool in a basic web application. The tool should permit multiple users to use it simultaneously and enable users to upload a (relatively small) knowledge graph of their choosing for visualization. If helpful and if the team prefers, the LAS can potentially provide an existing, Dockerized, web application which may be used as a “template” of sorts for this aspect of the project.
Technologies and Other Constraints
In completing this project, the team will be expected to use the following technologies, possibly with some others selected during the semester.
- Git – required (to be provided by NCSU)
- Python – preferred, for general software development (flexible if other languages strongly preferred by the team)
- Neo4j – strongly preferred, for knowledge graph development
- Cypher – optional, for querying knowledge graph
- spaCy, CoreNLP, NLTK, textblob – recommended NLP python libraries
ALSO NOTE: Public distributions of research performed in conjunction with USG persons or groups are subject to pre-publication review by the USG. In the case of the LAS, typically this review process is performed with great expediency, is transparent to research partners, and is of little to no consequence to the students.
Sponsor Background
The Laboratory for Analytic Sciences is a research organization in support of the U.S. Government, working to develop new analytic tradecraft, techniques, and technology that help intelligence analysts better perform complex tasks. Processing large volumes of data is a foundational capability in support of many analysis tools and workflows. Any improvements to existing processes and procedures, whether they are measured in time, efficiency, or stability, can have significant and broad reaching impact on the intelligence community’s ability to supply decision-makers and operational stakeholders with accurate and timely information.
Background and Problem Statement
Interesting questions most often cannot be answered accurately using data from a single domain. For example, a medical physician cannot accurately diagnose a patient’s condition based solely on the patient’s heart rate. Instead, the physician gathers and fuses information from multiple data “modalities” (heart rate, temperature, appearance, history, etc) to assist their diagnosis (i.e. their “sensemaking”). A “knowledge graph” is a type of technology which is richly suited to support sensemaking analytics over multimodal data. Connections between different data objects are explicitly defined, which creates the graph, and enables inferences and analysis via graph analytics that would otherwise be impractical. To make an apt analogy, a knowledge graph is like an encyclopedia for machines in that, just as an encyclopedia is organized in a natural way for humans, the knowledge graph organizes data in a way that is natural for machines to read and, possibly, with the help of AI/ML tech, comprehend.
In this project, we seek to generate a knowledge graph containing several data modalities pertaining to the famous audio recordings of President Richard Nixon’s administration, which were taped from within the White House (and elsewhere such as Camp David). In particular, the knowledge graph is to contain the output of natural language processing (NLP) applied to the transcripts of these recordings, as well as the vocal characteristics that the various speakers exhibit at each moment of the recorded speech. Both of these classes of information are derived from the original audio data and are therefore forms of data “enrichment”. The combination of what is being said along with how it’s being said will enable historical analysts to probe this famous data set with more interesting questions.
The ability to explore the enriched, multimodal, data set is of great interest, as it will lead analysts to understand what interesting questions they might now be able to ask of the data set. Because exploratory analysis of the knowledge graph is paramount, we also seek to create a web application which implements an open-source knowledge graph visualization application hosted on an LAS virtual hardware system. The key functions of this application will be to enable exploratory analysis of the knowledge graph, such as zooming, filtering, algorithmic graph layouts, and viewing of temporal dynamics.
Project Description
The Spring 2022 Senior Design team is asked to design and generate a knowledge graph containing the content of the Nixon administration audio recordings, along with its corresponding vocal characteristics. The team is also asked to implement a web application allowing users to explore the generated graph using an existing knowledge graph exploration & visualization tool.
To create a knowledge graph, the team must consider its design. We prefer that the team use a labeled property graph model (e.g. Neo4j) rather than an RDF-based model. The “design” element of a knowledge graph largely comes from choices regarding the ontology of the graph. Owing to the time available for this effort, we strongly recommend that the team utilize a fairly basic ontology, focusing on people, places, objects, speech characteristics, and time, rather than some more complicated and rich ontology. Ultimately, a design decision must be made by the team striking a balance between functionality and practicality.
Text transcripts of the audio content are available to use as input into natural language processing (NLP) algorithms. Software must be written to apply the NLP algorithms, and to feed the output into the knowledge graph.
To extract the vocal characteristics, the LAS will provide the team with a set of algorithms to apply to the audio data. These algorithms produce information about the valence, prosodics, pitch, arousal, and harmonics of the speaker. Software must also be written to feed this information into the graph.
Finally, to develop the exploratory capability, the team should select an existing, open-source, knowledge graph visualization tool and wrap the tool in a basic web application. The tool should permit multiple users to use it simultaneously and enable users to upload a (relatively small) knowledge graph of their choosing for visualization. If helpful and if the team prefers, the LAS can potentially provide an existing, Dockerized, web application which may be used as a “template” of sorts for this aspect of the project.
Technologies and Other Constraints
In completing this project, the team will be expected to use the following technologies, possibly with some others selected during the semester.
- Git – required (to be provided by NCSU)
- Python – preferred, for general software development (flexible if other languages strongly preferred by the team)
- Neo4j – strongly preferred, for knowledge graph development
- Cypher – optional, for querying knowledge graph
- spaCy, CoreNLP, NLTK, textblob – recommended NLP python libraries
- LAS Provided Voice Analysis Software – required (to be provided by LAS)
ALSO NOTE: Public distributions of research performed in conjunction with USG persons or groups are subject to pre-publication review by the USG. In the case of the LAS, typically this review process is performed with great expediency, is transparent to research partners, and is of little to no consequence to the students.
ponsor Background
LexisNexis® InterAction® is a flexible and uniquely designed CRM platform that drives business development, marketing, and increased client satisfaction for legal and professional services firms. InterAction provides features and functionality that dramatically improve the tracking and mapping of the firm’s key relationships – who knows whom, areas of expertise, up-to-date case work and litigation – and makes this information actionable through marketing automation, opportunity management, client meeting and activity management, matter and engagement tracking, referral management, and relationship-based business development.
Background and Problem Statement
For the past two years, as face-to-face meeting has become less prevalent, the use of business cards to pass contact information has drastically diminished. Instead, we now see a rise in the use of QR codes, embedded in Zoom call backgrounds, or even as a substitute for a physical card should people meet.
Customer Relationship Management (CRM) users want to be able to capture contact information as simply and seamlessly as possible, preferably using a mobile device. The card holder would also like to know how effective a given presentation or event has been, and so would wish to track the upload statistics associated with their QR code.
Project Description
The goal of this project will be a mobile app that supports the creation of an event- specific QR code to facilitate the transfer of contact information.
This involves:
- Creating a vCard from a contact record
- Creating a unique identifier for a Contact and an Event, which is logged in a database
- Creating a QR code image that passes the Event/Contact reference to a server endpoint
- Displaying the QR code image on screen
- Exporting the QR code image to SMS, email or other image-consuming app
Once scanned, the QR code will return the Contact vCard, but it will also log the request, allowing the collection of upload statistics.
This involves:
- Establishing a server to respond to QR code requests
- Use the QR code reference to identify the correct Contact vCard to return
- Logging the transaction against the reference
- Providing the ability to report on transactions, to review the statistics related to any Event/Contact.
The team will also need to provide a mechanism for another phone user to scan the QR code and add the Contact data to an InterAction database.
This involves:
- Using the camera from within a native mobile app
- Recognizing a QR code
- Resolving the QR code URL and requesting data
- Importing a vCard from the URL
- Creating a contact record from the vCard
Together, these three elements provide end-to-end functionality and a framework for testing.
Technologies and Other Constraints
The mobile app will be based on either the Ionic or Flutter framework, and may involve integrating with or extending an existing app.
Development will involve Angular 12+, C#/.Net and SQL Server.
A small collection of example Contacts will be provided for illustrative purposes.
Students will be required to sign over IP to sponsors when the team is formed.
Sponsor Background
LexisNexis® InterAction® is a flexible and uniquely designed CRM platform that drives business development, marketing, and increased client satisfaction for legal and professional services firms. InterAction provides features and functionality that dramatically improve the tracking and mapping of the firm’s key relationships – who knows whom, areas of expertise, up-to-date case work and litigation – and makes this information actionable through marketing automation, opportunity management, client meeting and activity management, matter and engagement tracking, referral management, and relationship-based business development.
Background and Problem Statement
There is hidden value in every database, including those for Customer Relationship Management (CRM). The definition of that value is, however, different for every user. Presented with a raw database, the average legal CRM user would have to develop skills with database and data visualization tools to get the insights they need, skills not normally considered part of their everyday job.
Provided with an intuitive query builder, the user can, instead, experiment with their data and discover hidden value without having to invest heavily in technology training.
Project Description
Drawing from existing best UX practice, the NCSU Senior Design Team will build an interactive, web-based data query builder that, behind the scenes, generates valid SQL and displays the results in tabular or other formats. The user should have several options for building a query and looking at the results. This could include empirical query building, combining known fields and constraints, or exploratory query building, through a range of interactive data filters. The validation and control of query options will need to be dependent on field type.
From the query results, it should then be possible to select options to aggregate and present the data in simple visual forms (e.g., a pie chart or bar graph). It should be possible to name and save valuable queries and visualizations for later use. Additional capabilities could involve the marking of “favorite” queries, as well as having both private and shared queries.
The sponsor will provide examples of target queries and visualizations. Guidance on usability will be provided by the InterAction UX team.
Technologies and Other Constraints
The project implementation will use Angular 12+, C#/.Net and SQL Server.
Visualization should use D3 or ngx-charts.
A data model will be provided as a basis for the query builder from.
An anonymized data set will be provided for testing of bulk operation.
Students will be required to sign over IP to sponsors when the team is formed.
Sponsor Background
Bandwidth is a software company focused on communications. Bandwidth’s platform is behind many of the communications you interact with every day. Calling mom on the way into work? Hopping on a conference call with your team from the beach? Booking a hair appointment via text? Our APIs, built on top of our nationwide network, make it easy for our innovative customers to serve up the technology that powers your life.
Background and Problem Statement
It is relatively well documented these days how to build web services that are resilient to failure and geographically redundant. But it is not so easy to test and ensure these web services are always ready for unexpected, but inevitable, failures in various parts of the systems.
We want you to build a Chaos Engineering tool that will wreak havoc on Bandwidth’s web services and software infrastructure to help us ensure we are prepared for failures.
Project Description
We want you to build a service that lives in our Cloud environment (AWS), and will mischievously interrupt or shut down parts of our systems to see what happens. To do this, you’ll be using lots of AWS APIs and tools to interact with Amazon’s services to mimic failures in our core cloud infrastructure.
It would also be great for this to be controlled with a Slack bot, so Bandwidth engineers could send it messages to control when it starts and stops.
Finally, but most importantly, we want you to name this wonderfully chaotic thing you build! We have some ideas but would love to hear what the team comes up with.
Technologies and Other Constraints
This tool could be available via a command-line interface, as a web-based app, or via some mixture of both. We’ll leave it up to the team to figure out what works best.
You’ll need some working knowledge of a language like Python, Javascript/Typescript, Java or Go. Python, Javascript or Typescript would be preferred.
You should be comfortable with HTTP APIs and how to use them through your preferred language.
Some understanding of AWS or other Cloud provider is great, but not required.
The sponsor will provide access and credentials to a Bandwidth AWS account for student use.
Sponsor Background
Triangle Strategy Group (TSG) is a technology consulting firm based in Raleigh, NC serving clients in the cosmetics, pharmaceuticals, food and beverage industries. We design Internet of Things (IOT) systems to create exciting new products and experiences for our clients and their customers.
Background and Problem Statement
ReMynda is a prototype medication monitoring system designed to assist socially distanced seniors in adhering to and replenishing their medications.
Prior to COVID-19, medication non-adherence was causing nearly 125,000 deaths, 10 percent of hospitalizations and costing the healthcare system $100–$289 billion a year. Seniors are most at risk individuals for medication non-adherence with 45-55% of seniors taking 5 or more medications and 12% of them taking 10 or more. During the pandemic, adherence-related illness and deaths have increased significantly as a result of social distancing and reduced access to pharmacies and home help.
We have developed a prototype system to help the most at-risk seniors stay on track with adherence. Each user will have an organizer device in their home that provides timely visual and audio cues to take medications, tracks usage with sensors, provides mobile alerts to caregivers and assists seniors in refilling. The organizer uses a proprietary tagging system and visual sensors to identify individual medication bottles and a weight measurement system to track consumption.
A previous Senior Design team developed a prototype for a cosmetic application. We are now seeking to adapt this into a system for medications that can be put into in-market testing with seniors, pharmacies and caregivers beginning mid-2022. Our new focus on medications brings some exciting new challenges.
Project Description
The overall goal is a scalable network of organizer devices interacting with a community of seniors, caregivers, pharmacists and MDs. This project is one of two parallel SDC projects this semester developing different technology components for the medical ReMynda system.
This team’s project will focus on (1) operating software for the medication organizer and (2) a mobile application for caregivers, MDs and some senior users who may want to directly use a mobile app.
A parallel project being completed by a second team focuses on (3) a client for the users’ pharmacy and (4) a common backend that serves both the app/device and the pharmacist's web UI. The same API can serve multiple types of clients, but with appropriate access control. The two project teams will need to coordinate to make sure the API meets the needs of all client applications.
The system should use pharmacy standard data protocols and comply with HIPAA data management requirements. Each element of the system should be well documented and readily adaptable by the sponsor so we can iterate and adapt features and appearance based on in-market tests.
We are seeking a pharmacy software partner to interview and advise us on design choices.
Core deliverables for this project are:
- Microcontroller code for Remynda organizer (some available from prior SDC projects)
- Establish and maintain Wi-Fi connectivity between each device and cloud
- Scan and ID new medication bottles using optical ID system.
- Download dose amounts and schedule
- Provide timely visual and verbal notifications
- Track amount of product used and remaining by weight
- Provide local and remote alerts in the event of any discrepancy
- Provide one-touch reordering
- Validate device integrity and provide appropriate alerts
- Transmit real-time data from each ReMynda device to cloud databases including all product interaction data and device status
- Mobile device front end (for user and/or caregiver)
- Allow configurable dose timing screen
- Provide adherence alerts (option to call or text the senior user)
- Provide organizer alerts (charge running low, connection problems)
- Provide a homepage with adherence summary, alerts, history, medication list
- Provide regimen summary screen listing all medications, dose time
- Provide inventory report, reorder notifications
- Provide reorder functionality
- Provide alert configuration screen
- Provide event log
Technologies and Other Constraints
The Triangle Strategy team will have an opportunity to work with several different technologies:
Arduino C++ for the organizer.
The previous ReMynda software used MySQL / Edge / Angular / Node architecture but the spring 2022 team may choose different technologies.
Historically we have used AWS for hosting, but charges are getting excessive. The team may consider hosting the backend on a standalone server, but HIPAA compliance needs to be considered.
The sponsor will work with the team to choose a technology for implementing the mobile application.
Students will be required to sign over IP to sponsors when the team is formed.
Sponsor Background
Triangle Strategy Group (TSG) is a technology consulting firm based in Raleigh, NC serving clients in the cosmetics, pharmaceuticals, food and beverage industries. We design Internet of Things (IOT) systems to create exciting new products and experiences for our clients and their customers.
Background and Problem Statement
ReMynda is a prototype medication monitoring system designed to assist socially distanced seniors in adhering to and replenishing their medications.
Prior to COVID-19, medication non-adherence was causing nearly 125,000 deaths, 10 percent of hospitalizations and costing the healthcare system $100–$289 billion a year. Seniors are most at risk individuals for medication non-adherence with 45-55% of seniors taking 5 or more medications and 12% of them taking 10 or more. During the pandemic, adherence-related illness and deaths have increased significantly as a result of social distancing and reduced access to pharmacies and home help.
We have developed a prototype system to help the most at-risk seniors stay on track with adherence. Each user will have an organizer device in their home that provides timely visual and audio cues to take medications, tracks usage with sensors, provides mobile alerts to caregivers and assists seniors in refilling. The organizer uses a proprietary tagging system and visual sensors to identify individual medication bottles and a weight measurement system to track consumption.
A previous Senior Design team developed a prototype for a cosmetic application. We are now seeking to adapt this into a system for medications that can be put into in-market testing with seniors, pharmacies and caregivers beginning mid-2022. Our new focus on medications brings some exciting new challenges.
Project Description
The overall goal is a scalable network of organizer devices interacting with a community of seniors, caregivers, pharmacists and MDs. This project is one of two parallel SDC projects this semester developing different technology components for the medical ReMynda system.
This project will focus on (1) a client for the users’ pharmacy and (2) a common backend that serves both the app/device and the pharmacist's web UI. The same API can serve multiple types of clients, but with appropriate access control. The two project teams will need to coordinate to make sure the API meets the needs of all client applications.
A parallel project will focus on (3) operating software for the medication organizer and (4) a mobile application for caregivers and MDs and some senior users who may want to directly use a mobile app.
The system should use pharmacy standard data protocols and comply with HIPAA data management requirements. Each element of the system should be well documented and readily adaptable by the sponsor so we can iterate and adapt features and appearance based on in-market tests.
We are seeking a pharmacy software partner to interview and advise us on design choices.
Core deliverables for this project are:
- Pharmacy client
- For a newly enrolled senior, pull senior’s medication regimen and data for each medication
- Receive medication change orders (added, adjusted, discontinued)
- When new medications are dispensed for ReMynda patients, intercept pharmacy print file, integrate tag images, and transmit combined file to pharmacy printer
- Provide tracking reports (overall tracking, per user tracking)
- Provide event logs / filter / drilldown
- Provide an alert screen
- Provide coaching interactions (texts, emails, calls) Coaching interactions can be set by pharmacist or caregiver.
- Receive one-touch reordering requests from devices, transmit to pharmacy system
- Common backend
- Store data needed for organizers, pharmacy’s existing data and systems, mobile front ends, pharmacy front end
- Manage data flows
- Maintain profile data for ReMynda organizers, Regimens, Items, Users, Pharmacists, Caregivers (contact info, mobile devices, associated users and relationships between devices, regimens, users, pharmacists, caregivers)
- Store, push and pull media files
- Audio media
- Prescription sheets
Technologies and Other Constraints
The Triangle Strategy team will have an opportunity to work with several different technologies:
The previous ReMynda software used MySQL / Edge / Angular / Node architecture but the spring 2022 team may choose different technologies.
Historically we have used AWS for hosting, but charges are getting excessive. The team may consider hosting the backend on a standalone server, but HIPAA compliance needs to be considered.
The sponsor will work with the team to choose technologies for implementing the web application.
Students will be required to sign over IP to sponsors when the team is formed.
Sponsor Background
Blue Cross and Blue Shield of North Carolina (Blue Cross NC) is the largest health insurer in the state. We have more than 5,000 employees and about 3.8 million members. This includes about one million served on behalf of other Blue Plans. Our campuses are in Durham and Winston-Salem. Blue Cross and Blue Shield of North Carolina (Blue Cross NC) has been committed to making health care better, simpler and more affordable since 1933. And, we've been the driving better health in North Carolina for generations, working to tackle our communities’ greatest health challenges
Background and Problem Statement
Problem Statement: As of now, a member/patient cannot access medical records managed by payer or provider through APIs (FHIR). To access their own medical records, a member needs to sign-up on different portals/apps managed by either Payer or Provider.
In healthcare, a payer (aka payor) is the person, organization, or entity that pays for the care services administered by a healthcare provider. This term most often refers to private insurance companies, who provide their customers with health plans that offer cost coverage and reimbursements for medical treatment and care services. There are three different types of healthcare payers: commercial, private and government/public. “Commercial payer” refers to publicly traded insurance companies like UnitedHealth, Aetna, or Humana while “private payer” refers to private insurance companies like Blue Cross Blue Shield. “Public payer” refers to government-funded health insurance plans like Medicare, Medicaid, and the Children’s Health Insurance Program (CHIP). Payers play an important role in furnishing patients with the health insurance coverage that they need in order to receive necessary health care services. In most cases, beneficiaries pay into a monthly or yearly insurance plan in exchange for coverage within a range of certain procedures or services.
A health care provider is an individual health professional or a health facility organization licensed to provide health care diagnosis and treatment services including medication, surgery, and medical devices. Health care providers often receive payments for their services rendered from health insurance providers. In the United States, the Department of Health and Human Services defines a health care provider as any "person or organization who furnishes, bills, or is paid for health care in the normal course of business." Each time a healthcare provider submits a medical claim to a payer in order to receive reimbursement for a specific procedure or service, they generate information about that care episode. Providers, suppliers, and other stakeholders within the healthcare industry can use this all-payer medical claims data to access helpful insights.
Project Description
Proposed Solution: Unification will be a native mobile application (Apple or Android) that centralizes the Apple’s HealthKit data or Google’s Health Platform/Google Fit with BCNC’s members, payers and providers data available through 21st Century Cures Act using SMART framework (https://docs.smarthealthit.org/). This modern and intuitive smartphone app will provide:
- Transparency into the cost and outcomes of member care
- Competitive options in getting medical care
- Easy, convenient and centralized access to member medical records (For eg: COVID-19 vaccination digital card)
- The ability to shop for care and manage costs
- Fitness data
- Preventative Health Care
Unified app will offer centralized, personalized health records covering payer, provider and fitness experience including the ability to:
- Collect and store health and fitness data
- Readily access health insurance and claim data
- Access provider data
- Analyze and visualize data
- Enable social interactions
The Payer and Provider information is publically available under the 21st Century Act. For e.g. https://apiportal.bcbsnc.com/fhir/bcbsnc and https://apiportal.bcbsnc.com/fhir/bcbsnc. The fitness experience comes from sensor data from an individual handheld device i.e. smartphone or smartwatch.
Technologies and Other Constraints
List of technologies:
- Programming language: React Native | Swift | Objective-C
- Authentication and Access: OAuth 2.0
- Native Mobile App Framework: Galio
- Data Exchange Framework: SMART
- Data Model: FHIRModels package
- Library: ModelsDSTU2/DSTU3, ModelsR4/R5, Modelsbuild
- Back-end: Apache CouchDB, PostgreSQL, Redis
Mobile application reference architecture:
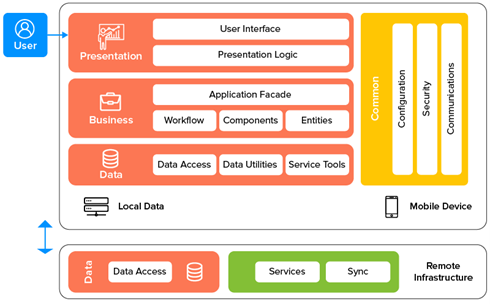
SMART authorization sequence (https://docs.smarthealthit.org/authorization/):
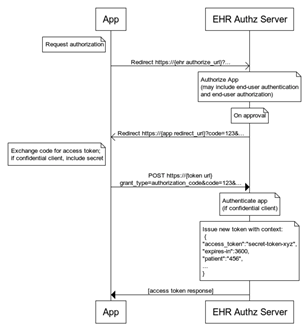
Additional Information and references:
- 21st Century Cures Act: https://www.healthit.gov/curesrule/overview/about-oncs-cures-act-final-rule
- What ONC's Cures Act Final Rule Means for Patients: https://www.healthit.gov/curesrule/what-it-means-for-me/patients
- What ONC's Cures Act Final Rule Means for Health IT Developers: https://www.healthit.gov/curesrule/what-it-means-for-me/health-it-developers
- FHIR Specification - https://www.hl7.org/fhir/
- 3. FHIR examples - https://github.com/google/fhir
Students will be required to sign over IP to sponsors when the team is formed
Sponsor Background
IBM is a leading cloud platform and cognitive solutions company. Restlessly reinventing since 1911, we are the largest technology and consulting employer in the world, with more than 350,000 employees serving clients in 170 countries. With Watson, the AI platform for business, powered by data, we are building industry-based solutions to real-world problems. For more than seven decades, IBM Research has defined the future of information technology with more than 3,000 researchers in 12 labs located across six continents.
Background and Problem Statement
Telescopic follow-up of transient astronomical events is one of the most desirable and scientifically useful activities in modern observational astronomy. From a scientific perspective, pinpointing a transient event can be essential for discovering more about the source, either by directing more powerful telescopes to observe, or to maintain a near continuous record of observations as the transient evolves. Very often transients are poorly localized on the sky and telescopes have a limited field of view thus pin-pointing the transient source is often a daunting task. Perhaps most importantly, the number of large telescopes on the planet is small, and they cannot be commandeered to randomly search for every transient of interest.
http://ccode.ibm-asset.com/cas/centers/chicago/projects/research/ctn/
Project Description
The Telescope Device Controller is a component that would be local to the telescope and may be run on a laptop or on a Raspberry Pi to communicate with the IBM Cloud to the Telescope Commander component through the Watson IoT Platform. The software will be developed in Java 16 and run in a Docker container. The software would consider the complexity of poor network connectivity and will incorporate a scheduler, a queuing mechanism using IBM MQ on Docker and storing information and commands in the IBM DB2 database on Docker. The images taken by the telescope will be stored and forwarded to IBM Cloud Object Storage (COB). If there are connectivity issues, a separate thread will store the images when connectivity is resumed. The application will be communicating with the Indigo Server locally in simulation mode. The complete solution must be packaged and deployed to the IBM Cloud OpenShift instance allocated for the project using the Tekton pipeline in a single Pod.
Students are required to review the work accomplished by the students in the last semester (Fall 2021) and build upon the existing code. The project will also deploy the component on a Raspberry Pi and test with a telescope mount. The team will also need to integrate the code with the API. A separate Raspberry Pi will be used to test the features available from INDI. The Java libraries may also need to be fixed since it is not recently updated by the author: https://sourceforge.net/projects/indiforjava/files/
Technologies and Other Constraints
Java, Watson IoT, IBM MQ, IBM DB2, Docker, RedHat OpenShift on IBM Cloud, Tekton
All software developed will be released as Open Source under the MIT license.
Students must follow the high level design attached for the development of the code. Mentoring assistance will be provided by IBM as well as resources on the IBM Cloud to work on the project.
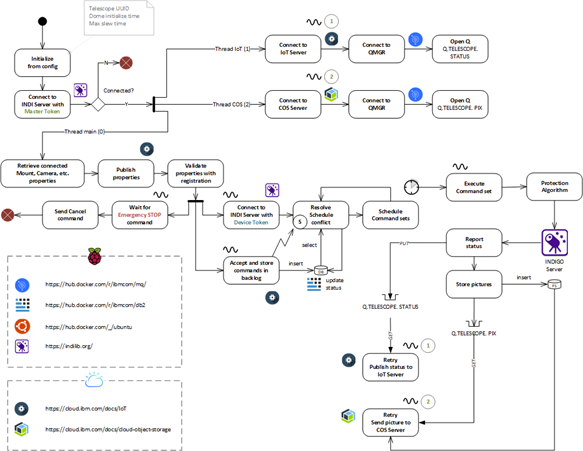
Sponsor Background
Katabasis is a non-profit organization that specializes in developing educational software for children ages 8-15. Our mission is to facilitate learning, inspire curiosity, and catalyze growth in every member of our community by building a digital learning ecosystem that adapts to the individual, fosters collaboration, and cultivates a mindset of growth and reflection.
Background and Problem Statement
Katabasis works to serve children in underprivileged communities across eastern NC. One of the central ways we do this is by conducting summer camps and after school programs where kids learn about computers and get hands-on experience building their very own computer with refurbished components we provide for them. This is a significant logistical undertaking, involving coordinating with many different county leaders and organizations, finding and organizing many computer components, and planning out individual camp sessions, tailored to the needs of the different locations. To streamline this process, we have a prototype system developed to aid in coordinating these efforts to get more computers out into the community. Over the long term, we hope to have this system coordinate camps between community stakeholders without the need for significant involvement on the part of Katabasis. We aim to empower community organizations with the resources they need to run these camps on their own without needing to wait on Katabasis for permission or guidance.
Project Description
Katabasis is seeking to expand the system developed by a Senior Design student team in Fall 2021, which coordinates activities and resources with those of our local partners across North Carolina. The current system primarily addresses the needs of Katabasis to aid in organizing camps. We want to expand the system's capabilities to address the needs of our community partners with the hope of reducing the dependence of these stakeholders on Katabasis so that we do not become a bottleneck in organizing camps. In Fall 2021, the Senior Design team added support for tracking and communicating with all our local partners, keeping a detailed inventory of computer components, and a scheduler for allocating personnel and components towards the planning of specific camp events. The first stage of this project will be to familiarize yourself with the existing codebase and make necessary improvements. The team will then move on to creating a permissions system followed by creating a lesson cataloging system. New functionalities should emphasize ease of use, designed for non-technical persons.
- Permissions System: While the system currently has all of its core functionality in place, as mentioned previously, all of these are currently limited to “admin” use only. We want to create a permissions system such that there can be multiple different types of users accessing the system with different intentions, and maintain proper information security. Specifically, we envision these types of users:
- Donors: Provide all Local Partner data*, with option to edit (only their own), and have access to add new components to inventory.
- Volunteers: Provide all Local Partner data*, with option to edit (only their own), and have access to view scheduled events, and enter availability, as well as review any times or camps already committed to. If committed to a camp, they may view Volunteer instructions for included Lessons in the Lessons Module.
- Organizers: Provide all Local Partner data*, with option to edit (only their own), and have access to create new events. This will allow them to view the inventory of computer components as well, request volunteers (but NOT view the entire database of volunteer information), and view existing in the Lessons Module.
- Admins: Full access to all tools (current default)
- Campers: NO Local Partner data* stored (very important for minors and data protection), simply have access to view all material in the Camper Resources Module.
Each module within the system should have three permission levels (None, Read, or Read & Write), and be assigned to each user type. This means there will be different interfaces and interactions for the different permission levels. - Lessons Module: This module will consist of activities, or “Lessons”, that can be conducted at various camps organized by the system. The Scheduling Module will need to be updated with an optional feature to attach Lessons to an event. Furthermore a Lesson should contain:
- Name of the Lesson
- Recommended Age Range
- Subject Areas Covered
- Materials Required
- Estimated Time Required
- Organizer Instructions & Recommendations
- Volunteer Instructions & Recommendations
- Student Activity Level
Finally, in the development of this tool, we want our team to be very conscious of all of the stakeholders at play and take all of their needs into account. These include, but are not limited to: Katabasis’s need for a logistical facilitator, teachers’ desire to educate and empower students with limited resources, nonprofits supporting impoverished communities, community members looking to support their community, your “managers” (teachers) seeking to measure your performance, among others. While not all of these stakeholders may be users of the system, we do want the system to be designed in such a way that addresses all of these interests effectively. Of those who do access the system, individuals and organizations will only access specific aspects of the software and data contained.
To the end discussed above, we will be expecting the team to conduct user testing to verify the effectiveness of the UI design, as well as to serve as proving ground for the entire software as a whole (this will be in addition to any white or black box testing requirements).
Technologies and Other Constraints
The team will be building off of the existing system, built using ReactJS, Postgres, Docker, SQLAlchemy, VSCode, Python3, and Flask. Previous knowledge of all of these tools is not required to work on this project, though a working knowledge of one or more of them would be preferable.
Students will be required to sign over IP to sponsors when the team is formed
Sponsor Background
NCSU is an R1, research intensive institution. Interdisciplinary research is a core strength of the NCSU Department of Computer Science. This includes work in Human-Computer Interaction, Educational Technology, and Text mining. Key to this research is the development of novel tools that can support educational interventions, data annotation, and analysis. In order to train effective models for argument and text mining we must also collect and annotate this data. In order to support students in novel educational tasks we need to develop novel educational platforms that can support reading-to-learn and arguing-to-learn activities.
Background and Problem Statement
Almost all communication is argumentative. Argument comprehension, and authoring, are core skills that cut across all domains. Doctors must make and defend diagnoses, scientists must make and author hypotheses, engineers make proposals and then justify them against alternatives, and all of us have to understand, and evaluate, political claims. In order to support good argumentation skills, and to support effective automated argument mining, it is necessary to develop tools that will allow students and experts to read, annotate, and author written arguments.
Project Description
The overriding goal of this project is to develop a lightweight, extensible, web-based tool that will support the automated annotation and evaluation of documents, and which will support the development of planning diagrams for later writing tasks. The proposed tool will be used in classroom settings both as a vehicle for reading-to-learn activities and writing planning. It will also be used for professional annotation of existing texts by domain experts to support later work on natural language understanding. A sample prototype which shows a document, rendered in PDF, along with an accompanying diagram, is shown below:
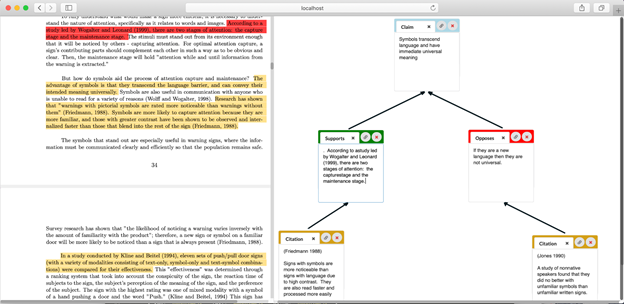
As the screenshot illustrates, the core of the tool is about maintaining linked semi-formal annotations, i.e. argument diagrams, that connect to the written text much like structured and interlinked bookmarks. By making these diagrams students can clarify for themselves and others, the nonlinear structure of arguments, including the claims, counterclaims, and relationships, that are present in most written text. Experts can also use these annotations to represent key structures of the text and then to process them for analysis.
The desired system should consist of two key components.
- The first is a lightweight and web-driven interface that will allow us to: load and render documents in pdf or other basic formats for annotation; author and render annotations that are linked to the basic document; define and store multiple schema for annotation allowing for users to define and load different annotation models; generate unlinked planning diagrams that can be used to produce future text; and author novel text using an RTF-capable editor which may then be linked back to existing diagrams. The UI should also support database-backed storage of annotations and essays, as well as automated download of essays, diagrams, and annotation images. This module should be packaged into a self-contained module that can be hosted locally allowing for use as an annotation tool and on a shared server for use in class contexts.
- The second component will provide necessary infrastructure for use of the diagramming component in a class. This will include necessary infrastructure for loading, generating, and storing user ids, class groupings, and passwords. Annotations should also be sharable across users allowing for the diagrams to be exchanged. It will also include infrastructure for making and displaying assignments which may use preloaded texts or diagrams. This solution will be beneficial to end users in the CS department as well as those in writing. It will also be deployed as part of collaborative work with other institutions.
Technologies and Other Constraints
The preferred paradigm is a web-based tool, to be built on a python backend using a configurable object-relational database schema. The data storage model should be DB agnostic, with the frontend including display features coded in javascript. Basic libraries, including those used in the prototype, can be included but reliance should be limited to open-source tools.
Students will be required to sign over IP to sponsors when the team is formed
Sponsor Background
Conceptualee Resources develops and conceptualizes new ideas to solve big society problems. We focus on issues in developing countries.
Background and Problem Statement
Rural and indigenous communities often are rich in natural resources for which they derive little value compared to others in the value chain. There is a complex web of issues that maintain the status quo. However, one key enabler is integrated development in these areas that empower people to perpetually improve their livelihoods and well-being, and that of others. One pillar is to enable them to manage, cultivate/develop, and leverage their natural resources for their own benefit and that of others instead of external parties gaining power over their land and livelihoods.
This project focuses on existing high-value commodities such as gold, tin, cobalt, cashew, and cocoa, operated by small-scale producers (mining and agriculture) in Africa. Plenty of money is generated by these commodities to the benefit of intermediaries while the producers and local communities remain in poverty. For example, in Africa, artisanal miners account for 20% to 30% of annual gold production, representing about $24 billion. Yet, the vast majority of miners are extremely poor. The specific problem environment is illustrated below.
Conceptualee Resources would like to help small-scale producers (mining and agriculture) with some of the following problems:
- Manual, low productivity work which leads to low output of minerals
- Degradation and pollution of water and soil
- Destruction of agricultural land
- Exploitation and limited access to international and regional markets directly
- Government cannot collect tax revenue that could be used for development
- Unhealthy and unsafe work environment
- Lack of formalization keeps producers from accessing available resources
- Opaque value chains filled with corruption and illicit activity mostly by intermediaries
We currently have a pilot location in Nigeria.
Project Description
To help African small-scale producers, we would like to build a Field Service Management Platform (FSMP), an integrated platform of physical, digital (i.e. data), and people infrastructure and field service operations as described below.
- Buy and sell mining and agricultural commodities where commodities are cultivated or extracted
- Provide provenance, inspection, and tracking from source to market, including transparent transactions and payouts
- Provide infrastructure, resources, training, equipment, and support for formalization and production/output improvement in a safe and environmentally friendly way
- Manage, monitor, and mitigate land and environmental issues
- Diversify to multi-commodity (agriculture and mining) value chains over time
- Conduct full-scale feasibility to create a long-term, large scale inclusive economic project that transforms the cycle of boom and bust to a cycle of organic growth
The Field Service Management Platform will provide many benefits to the key stakeholders.
- Small-scale producers: Improve productivity and output, which would lead to better and sustainable livelihoods and access to better markets and reduction of health and safety issues.
- Commodity Buyers: Certitude of source of commodity, legal transactions according to local and international laws and standards and meet environmental, social or economic impact goals
- Government: Improve service delivery to producers and communities, gain knowledge of value of natural resources to inform development, collect royalties and taxes while tracking extraction and movement of natural resources
- Community: Benefit from extended infrastructure from the Asseza Multiplex™ Center, Receive share in revenue for development projects, Business and economic opportunities in supporting value chain
The goal of this project is to create the architecture and begin development of the Field Service Management Platform to support this work. This platform has to be designed to be extensible with multiple modules. We would like the team to focus on the following two modules:
- Transaction Module – to facilitate the workflow of buying and selling commodities
- Land and Natural Resource Management Module — a field app to manage projects and tasks in the field, such as sampling, and integrated with a laboratory management system on the back end to manage data associated with samples, experiments, laboratory workflows, and instruments.
- Project/Job/Workflow/Work Order Management
- Account Management
- Inventory Management
Technologies and Other Constraints
Frontend: The Field Service Management Platform has to be accessible via simple devices such as tablets and smartphones, Android. The suggested front-end development framework is Ionic https://ionicframework.com/framework
Backend: Oodo(https://www.odoo.com/) – an open source, comprehensive business management software
Datastore: Postgres DB
Work within our established software development guidelines.
About Merck
Merck's mission is to discover, develop and provide innovative products and services that save and improve lives around the world. Merck's Cyber Fusion center mission is to ensure that our products, people, and patients are protected from any impact from a cyber situation.
Background and Problem Statement
As companies deal with the various interruptions in the supply chain due to the pandemic, the geopolitical conflicts and the high dependency on suppliers or third-party partners in countries with opposing strategic interests, the volume of supply interruption has increased due to physical as well as cyber related adverse or unpredictable events. The resiliency of such an optimized system must now move from an exception-based process to a risk based one to find rapid alternatives to its supply chain and routing network.
Project Description
Build an expert system that simulates a pharmaceutical supply chain interruption and provide mitigation recommendations:
- Using real time events like adverse weather, cyber security threats and similar interruptions, wars, pandemic etc.
- Propose current and future interruption based on current events and recommend risk-based alternatives e.g., new suppliers, new routes, changes in contract and liabilities etc.
- Setup the data structure, data feed and visuals
- System must be interactive to conduct sensitivity analysis via a web interface
As a first step, students must map the entire supply chain life cycle from research, to production, to sales and delivery, then align what possible interruption scenarios are in scope in each of the lifecycle categories.
Some of the input to the simulator may include, but not limited to, geo-political interference, primary, secondary and tertiary supply chain disruption, weather, etc. We want to know where (at any point) the status of our supply chain and the supplies in and around so we can make decisions based on Cyber or real-world threat (kinetic). Almost all data feeds will be public from sources such as NASA, NOAA.
For example, take refrigerated transportation of pharmaceuticals where certain compliance rules must be met throughout the duration of transportation. We want to determine with the simulator what events kinetic or cyber that may raise the risk of final delivery.
Technologies and other constraints
- Microsoft Azure: Cloud Computing Services
- Backend: Python
- Frontend: React
Sponsor Background
Professors Barnes and Cateté with Postdoc Behrooz Mostafavi in the NCSU Computer Science department are working together to build tools and technologies to improve K12 learning in science, technology, engineering, and mathematics, especially when integrated with computer science and computational thinking.
Background and Problem Statement
According to Code.org, over 50% of the U.S. states classify computer science as a math course contributing toward graduation. Unfortunately, higher level AP computer science courses are offered in less than 50% of schools, and are attended less often by students of color. Advances in technology, particularly around artificial intelligence, machine learning, and cyber security, have given rise to both 1) a need for students to have a firm grasp on computer science and computational thinking (CS/CT) in order to contribute to society, and 2) a need for rapid development of educational tools to support their learning.
Regarding the latter, computing educators are often teaching a brand new subject after only a few weeks of training and very little experience with scaffolding, grading, and providing formative feedback on related activities. Many tools developed to help support these teachers specialize along a single feature and don’t always consider the context of a live classroom. There has also been less attention paid to integrating analytics and intelligence into these tools to help analyze the impacts on the educator and students. Furthermore, although many individual educational tools are beneficial to students, the complexity around interacting with a variety of systems can cause students to become confused and disengaged, which may inhibit their learning. If students cannot manage their work and interactions in a useful and intuitive way, they lose the educational benefit of the systems they are attempting to use. Therefore, it is critical for CS learning by novice students to be able to provide a complete package for teacher-centric and classroom support around block-based programming.
In this project, we propose a new tool called SnapClass, which will integrate multiple learning features into one environment for total classroom support. Our objectives as part of this project are to 1) merge our existing Snap! support systems into a cohesive ecosystem for increased use and accessibility of programming activities for classroom, students, and teachers 2) develop new intelligent and data-driven supports to provide a teacher-centric hub for activity creation and student assessment, 3) develop an administrative dashboard for school staff to manage student accounts and activity and 4) collaborate with our K-12 school and teacher partners to beta-test and iteratively refine the new SnapClass system prior to release. While the different features are deployed into dozens of classrooms, with complete integration, SnapClass will become more accessible and desirable for a greater number of teachers, including the network of 500+ AP CS Principles teachers using the Snap!-based BJC curriculum and their 20,000 students annually.
Project Description
SnapClass will be a learning hub used for account management and project sharing by both students and teachers for STEM+C block-based coding assignments based on the Snaphub at North Carolina State University. You can demo the SnabHub environment at http://go.ncsu.edu/snaphub using bbpe-demo for both credentials. Selecting Ms. Watson from the dropdown will give a wide variety of sample activities including Epidemics pictured below.
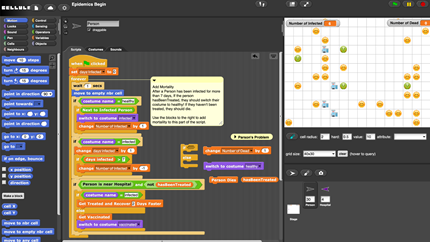
The iSnap environment, go.ncsu.edu/isnap, currently separated from SnapHub includes additional intelligent features such as hints, feedback, and examples that have been incorporated into the base Snap ecosystem.
The separate system GradeSnap focuses on teacher support by providing a rubric grading environment and class enrollment dashboard; whereas PlanIt focuses on project design and adds a toggleable planning interface to the snap environment. See below.
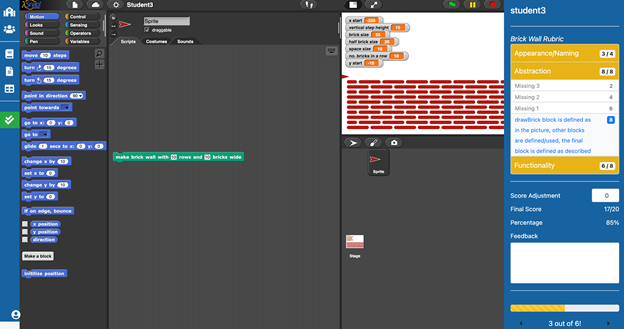
Above, GradeSnap project grading interface. Below, PlanIt dashboard for project planning and design.
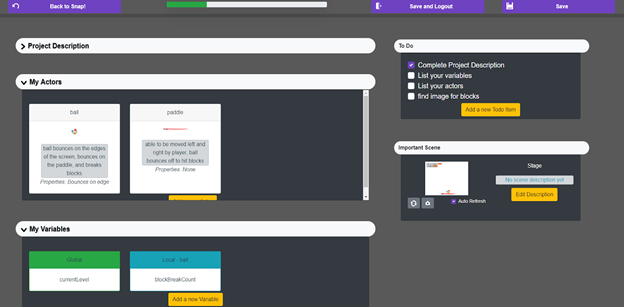
As a project team, the Senior Design students will work together to merge the existing systems and to develop a new administrative panel for assignment management. Additional requests are to develop an intelligent teacher dashboard that uses student programming performance and gradebook data to visualize insights for teachers and potential recommendations for topic reinforcement. The data center could include both live and post activity feedback on their students’ pace, performance, and estimated levels of understanding as determined through analyzing log and trace data. It is recommended that teams split the work by component (snaphub/planit merge; snaphub/gradesnap merge; admin dashboard, etc). Pair-programming recommended for understanding codebases for merge activities. Beta testing with our K-12 classroom partners is not expected in Spring 2022. Simple sample usability testing will suffice.
Technologies and Other Constraints
The SnapClass component code bases are located on GitHub, versioning and project management will be required. Additional requirements and code bases are listed below;
- Desktop/Laptop Development, Chrome Browser Required
- Familiarity with the following languages Highly Recommended - JavaScript, HTML, MySQL, PHP
- Additional languages and frameworks Helpful - Python, Angular, Node.js, MariaDB, jQuery
- Skills to be gained: server/client management, database integration, web development, HCI, machine learning, data mining, updating legacy codebases.
Sponsor Background
The sponsoring organization is the NetApp ONTAP Networking Team. The mission of our team is to provide world-class Networking features and capabilities to the industry-leading data fabric and management system used by cloud, hybrid cloud, private cloud and on-premises data storage and management applications. This project will contribute to cutting-edge methods of simulating, debugging and solving issues and implementing features relevant to the most complex networking topologies and enterprise customer environments in NetApp’s customer base.
Background and Problem Statement
Over the course of delivering data management systems to very complex, high-availability customer environments, NetApp has found it very difficult to understand end-to-end data problems, found at a customer site and in developing new features. The problem to be solved is one such classification of very difficult issues. Specifically, experience has shown:
- Malformed data packets due to conscious network attack surfaces or buggy devices in the network can cause unexpected behaviors and/or exploitation at various points in the network.
- The Network Stack should be designed and tested for unusual scenarios such as out of window TCP sequence and ACK numbers and rarely used TCP options.
- It is labor intensive and very difficult to test the Network Stack using commonly available traffic generators. Almost every detail of input traffic, expected responses from an endpoint, and follow-up steps should be designed and scripted to be useful. Because of its labor-intensive nature, convergence of negative tests for the network stack is very limited.
Project Description
The primary objective of this project is to develop a traffic agitator as an add-on to the existing, on-box FreeBSD firewall, known as ipfw. This firewall is implemented into ONTAP as an add-on firewall in the Network Stack. The agitator will possess several characteristics necessitated by the add-on nature of the firewall:
- Passive. Unlike existing traffic generators, the agitator will not actively generate or drive traffic and connections. Instead, traffic and connections will be driven by any existing tool such as iperf and any other in-house network test harnesses. The agitator will intercept and corrupt packets of such traffic and connections.
- Easy to deploy. As a software component in the network stack, the agitator does not require any additional device to be added to the path being tested.
- Policy based. Policy-based firewall rules can be installed into the firewall implementation and make a highly flexible, customizable firewall behavior. Since the traffic agitator will be built on the foundation of the firewall, these types of rules can be used to select and specify traffic to be agitated.
- Random. There is no need to drive or orchestrate traffic and connections. This characteristic allows the agitator to (pseudo) randomly corrupt packets and operate in a stateless manner.
Goals of the Project
- Primary Goals: The primary goals of this project will be to develop a passive traffic agitator as an add-on to ipfw, FreeBSD’s on-box firewall. They will also include adding the ability to capture packets after agitation. Following are some guidelines to achieve the primary goals:
- The passive agitator will work only on incoming packets. We are trying to test the network stack of the system which receives packets.
- The network connection to be agitated can be hardcoded using a given 4-tuple (Source IP, Source Port, Destination IP, Destination Port).
- Subsequently the packet header fields to be agitated (such as TCP sequence number, ACK number, SACK blocks, etc) should be carefully selected such that the agitation does not cause the network connection to terminate or cause any data corruption.
- The new values of the packet header fields to be agitated can be determined by the type of field and the degree of agitation. For example, the TCP window of a give TCP connection header can be modified and can be agitated within the range of 0 – 65535.
- A new pseudo device can be created and a Berkley Packet Filter Tap (BPF_TAP) can be added to the new pseudo device as part of the agitator. This will allow to capture packets after the packets have been agitated.
- The agitator can be triggered using a FreeBSD system control (sysctl) which can be set using the CLI. See stretch goals for improvement on this.
- Stretch Goals: There exists a few stretch goals, the completion of which will depend upon progress of the primary goal and team interest and acumen. They include, but are not limited to:
- Instead of the FreeBSD system control (sysctl), use ipfw CLI to trigger the agitator.
- Enhance ipfw CLI to add a capability that tester can specify rules and range of agitation. For instance, the specific fields in packet for agitation can be part of such rules. Range and probability of agitation can be other.
Pre-requisites & Tools
To be successful in this project the following pre-requisites are assumed:
- Experience in C programming and Linux.
- Experience with Kernel development is desirable but not required.
- Experience with FreeBSD source code management tools like GIT .
- Ability to download, modify, compile and deploy a FreeBSD kernel as a VM.
- Ability to use virtualization tools like Virtual Box to deploy FreeBSD VMs.
Technologies and Other Constraints
The technology set used to develop this software is flexible. The system under development will be an add-on feature to a standard FreeBSD kernel. We will not require access to NetApp tools or systems to develop the software. For this reason, a wide variety of CLI’s and desktop development platforms can be used in conjunction with freely available FreeBSD software.
Students will be required to sign over IP to sponsors when the team is formed
Sponsor Background
Oracle provides products and services that address enterprise information technology (IT) environments. Our products and services include applications and infrastructure offerings that are delivered worldwide through a variety of flexible and interoperable IT deployment models. These models include on-premise deployments, cloud-based deployments, and hybrid deployments. Using Oracle technologies, our customers build, deploy, run, manage and support their internal and external products, services and business operations including, for example, a global cloud application supplier that utilizes Oracle Cloud Infrastructure-as-a-Service (IaaS) to provide its Software-as-a-Service (SaaS) offerings; a multi-national financial institution that runs its banking applications using the Oracle Exadata Database Machine; and a global consumer products company that leverages Oracle Fusion Cloud Enterprise resource Planning for its accounting processes, consolidation and financial planning. At Oracle our mission is to help people see data in new ways, discover insights, and unlock endless possibilities.
Background and Problem Statement
The peer review process of research publications is a process of subjecting an author’s work to the scrutiny of others who are experts in the same field. To avoid bias, the reviews are usually anonymous, the identities of both authors and reviewers are kept hidden. Bias can still exist due to small research fields. We think the scientific peer-review process could be improved and would like you to come up with a Stack Overflow-like user interface for the review process of research publications. We would like to propose a crowd review process to only focus on content and quality of ideas, as opposed to anything else. Publications can be posted online and reviewed by experts, with transparent questions and answers. The reviews of the experts can be challenged, commented on by everyone who signs up to the platform. This encourages open discussion and transparent reviews. We think in 2022 it’s time for a revolution of how to review scientific work and we invite you to rethink the current state with us.
Project Description
This project includes a web interface for authors to upload new scientific publications, receive comments and reviews from experts in the field. Interactions are public and transparent. This website will differ from sites such as Academia.edu and ResearchGate, where authors upload publications after they have already been reviewed and published. The goal of this website is to re-imagine the scientific peer-review process and to allow authors to directly submit new publications, get public/transparent reviews from experts and have open discussion around their research.
The data of publications should be stored in an Oracle Autonomous Database and the business logic should be implemented in the Micronaut framework.
This solution should follow along the framework of Stack Overflow, which is a question-and-answer website for professional and enthusiast programmers.
In addition, the solution should provide an approval process that is visible to the public, encourage an open forum for academic discussion among authors, reviewers, and editors, and inform readers which papers are strong, incorrect/inconsistent, and controversial.
We envision the following user roles for the web app: Author who publishes papers (everyone with a profile), Expert (assigned by expert panel), User who is not logged in and Admin.
Some of the expected deliverables are: UI design (e.g. Figma), API design, architecture, personas and initial full stack implementation.
Technologies and Other Constraints
- Frontend – students can choose any front-end technology
- Backend - Micronaut (https://micronaut.io/) has to be used for the backend
- Oracle’s Autonomous Database (https://www.oracle.com/autonomous-database/) for data storage
- Oracle Cloud for deployment
- VSCode as the IDEA (including our VSCode plugins)
Note: We’ll provide guides to get started accordingly and provide Oracle Cloud instances.
Students will be required to sign over IP to sponsors when the team is formed
Sponsor Background
Professors Lynch, Barnes, and Heckman with Postdoc Behrooz Mostafavi and Ph.D. Candidate Xu in the NCSU Computer Science department are working together to build tools to help teachers and students manage the large number of technologies needed to do CSC course work, and to use these tools to make teaching and learning better.
Background and Problem Statement
Modern classrooms are increasingly defined by suites of online tools, for both students and instructors. This is particularly true in Computer Science where automated graders, code repositories, forums, ticketing systems, and other online tools are commonplace, and many of which may be class-specific. While these tools may be individually beneficial, this diversity of platforms adds a layer of complexity which can inhibit engagement and limit learning for students, and complicate their instructors' ability to provide management and support.
This project aims to address this gap by developing an open platform to collect, integrate, and analyze data from students' use of multiple online tools. This platform, called Concert, will actively track student progress, and allow instructors to identify students' help-seeking and collaboration behaviors. It will also enable research to develop a model of how students use the online resources that are available to them. It is expected that results of this project will increase understanding of students' help-seeking behaviors, study behaviors, and social relationships within classes, and how these behaviors and relationships affect student performance. This platform is being developed in concert with educators at NCSU and will be tested in real classrooms to assess its utility and impact on student performance.
Using open application programming interfaces, the Concert platform will gather data from commonly used systems, such as the Piazza forum, Jenkins Automated Grader, the GitHub submission system, MyDigitalHand, and Moodle. It will integrate data from these online tools and provide a single student dashboard interface for notifications and help seeking, as well as a single instructor dashboard interface for data analysis and student evaluation. Within these dashboards, reports that monitor student performance, study and work habits, and use of classroom tools and resources will be gathered and presented to the student or instructor, and formatted based on their specific requirements. This necessitates a modular interface within the dashboard that can hook into multiple data sources, define and pull data reports from those sources, attach that data to a range of visualizations, determine a salient span of the data being visualized, and organize the different data in a clean and clear way, and parameterized for either student or instructor.
Project Description
Concert is built as a responsive modular web application that is composed of four structural layers (Interface, API, Datastore, and Backend). Each layer is designed to exchange information with the layers above and below it. The Interface layer will provide student and instructor-facing visualizations of course data. The interfaces will be supported by an API layer which consists of two RESTful APIs, one of which will provide access to course-specific data to students and instructors, while the other provides bulk access to research data. The APIs will in turn be supported by a central Datastore that holds all demographic data, course descriptions, and transaction logs. The Backend layer connects Concert to the external course tools for data collection and transmission, and will be responsible for regular monitoring of the tools based upon course settings.
Current work is focused towards designing and creating dashboards for students and instructors that facilitate easy access to aggregate student data for monitoring student progress, visualizations for student contributions, course management and statistical analysis of student behaviors, presentation of strategic advice, and links to important information. Within these dashboards, Concert needs a modular stream-based framework for reporting information to the student or instructor, such as performance on assignments and assessments over time, task and deadline management, communication and collaboration with other students or instructors, and live analysis and visualization of mass student data. This framework needs to be designed for a wide range of data sources and visualizations outside the scope of just this project, to allow plug-in integration into other technology platforms. A standard model is required, with defined hooks for general data acquisition and visualization, with links to additional data specific to the class, such as assignment start and end states, and class resources and tooltips. A long-term goal is to define an API library for module operations.
The library should support a stream-based model of object data that allows for predefined sources, aggregators, filters, and sinks which can be defined by code on the python backend and then displayed to the client side in a standard model. In the long-run the library should also be well-documented and extensible to support future use across projects.
Technologies and Other Constraints
Team members will have access to prior work for data reporting, and be given a basic framework to work from to design and develop the reports module.
- Desktop/Web-based development - Requirement
- Python Programming
- Virtual environments
- Pipenv
- Object-relational Databases and Configurable Data Sources and filters.
- SQL & SQLite
- UI Interface design and implementation
- HTML5 & JavaScript
- User-centered design processes - Suggestion
- Layouts
- Modular hooks into backend code
- Layouts
Sponsor Background
Professors Barnes, Chi, and Price with Postdoc Behrooz Mostafavi in the NCSU Computer Science department are working together to build tools and technologies to improve learning in logic, probability, and programming through machine learning, subgoal supports, and AI.
Background and Problem Statement
Intelligent tutors are computer systems that use technologies such as artificial intelligence to provide learners with personalized instruction and feedback. They have been shown to be highly effective at improving students' learning, largely because of their ability to provide students with individualized, adaptive support as they learn.
As a large-scale project, Deep Thought - a deductive logic proof tutor developed at NCSU - aims to advance the technology for building data-driven intelligent tutors. To do so, it exists within a growing framework for building intelligent tutors that makes it easier to create personalized learning experiences that adapt to individual learners, while also acting as a valuable research tool for improving personalized pedagogical decisions in tutoring systems. The system uses data to determine what actions a tutoring system should take, when the system should act, and explain why these actions should lead to improved learning.
This project will develop a generalizable data-driven framework to induce a wide range of instructional interventions and robust, yet flexible pedagogical decision-making policies across three STEM fields (logic, probability, and programming) and types of intervention (worked examples, buggy examples, and Parsons problems). The system will be designed to allow use of the intelligent tutor in a wide range of STEM-related domains. The system will use advanced machine learning and data mining techniques to generate instructional interventions, mixed-initiative pedagogical policies, and human-in-the-loop explanations. This research will advance knowledge about data-driven generation of mixed-initiative decision making that balances a student’s sense of agency with their need for effective instructional interventions at critical decision points. The efficacy of the resulting system will be evaluated via a series of empirical studies comparing the new interventions with existing tutoring systems to determine the impact on learning outcomes, agency, personalization, and effective interactions. This project is supported by the NSF Improving Undergraduate STEM Education Program: Education and Human Resources. The IUSE: EHR program supports research and development projects to improve the effectiveness of STEM education for all students. This project is in the Engaged Student Learning track, through which the program supports the creation, exploration, and implementation of promising practices and tools.
Project Description
Deep Thought is an intelligent tutor for the practice of solving deductive logic proof problems in graphical representation; displaying the proofs as logical premises, with buttons for logical rules that can be applied to selected premises and derived expressions, and a logical conclusion as the goal of the problem. In its present form, Deep Thought has also served as a research tool and test-bed for new educational technologies and pedagogical policies for improving student performance, and was originally built for this purpose as a Ph.D. student project. The data-driven policies used in Deep Thought are designed to be domain-independent and scalable, such that integration into a larger generalized framework is supported.
Currently, Deep Thought is under development for the inclusion of new problem types in addition to new pedagogical policies. To facilitate the rising role of Deep Thought in the research and development of a generalized pedagogical framework and other adaptive educational technologies at NCSU, a new R&D Sandbox interface for Deep Thought is necessary. At present developing and experimenting with new features in Deep Thought requires a high level of technical knowledge and familiarity with the code and architecture. Analyzing data and logs requires manually rerunning statistical analyses, including any adaptation required for differences in databases between Deep Thought versions. Finally, while we should be able to visually “replay” a student working through a problem in the Deep Thought tutor based on how log data is recorded, this kind of capability is not available. This sandbox would be a place to experiment with previous and future Deep Thought features, problem types, and policies without in-depth knowledge of the code base. It would also allow researchers to perform more expansive and exploratory analysis on Deep Thought data than before, and expand who would be capable of analyzing the data, by letting researchers interact with the data through a user-friendly interface rather than code and scripts.
This interface should:
- Streamline development of new tutor features and policies by providing developers with an interface to change and interact with the Deep Thought tutor without dependency on external resources
- Improve testing and integration of new tutor features and policies by allowing developers to toggle features and policies on or off and analyze the results, either visually via log replays or statistically
- Provide live and up-to-date data mining, analysis, and visualization of student logs for research and development of new ML and AI-supported reinforcement
This project will occur alongside the regular development for Deep Thought which includes re-factoring and modularization of the code base for ease-of-integration into a larger framework, and additions for improved course management, security, and data transfer. While the project will not include work on any of these aspects of Deep Thought, awareness of larger project goals are necessary for effective design of the R&D Sandbox, and adaptable and agile development practices should be expected.
Technologies and Other Constraints
- Desktop/Web-based development (Mac or Windows) - Requirement
- JavaScript
- HTML5
- Apache
- MySQL/phpMyAdmin
- Analysis/API programming (PC/Linux) - Suggestion
- Python Programming
- Virtual Environments
- Machine Learning
- R Programming
- Analysis
- Machine Learning
- Python Programming
- Spreadsheets
Sponsor Background
IBM is a leading cloud platform and cognitive solutions company. Restlessly reinventing since 1911, we are the largest technology and consulting employer in the world, with more than 350,000 employees serving clients in 170 countries. With Watson, the AI platform for business, powered by data, we are building industry-based solutions to real-world problems. For more than seven decades, IBM Research has defined the future of information technology with more than 3,000 researchers in 12 labs located across six continents.
NCSU College of Veterinary Medicine (CVM) is dedicated to advancing animal and human health from the cellular level through entire ecosystems.
Background and Problem Statement
Background: Infectious diseases (ID) and antimicrobial resistance (AMR) has emerged as one of the major global health problems of 21st century affecting animals, humans, and the environment. Around the clock, many researchers, institutions, national and international agencies are continually reporting the occurrence and dissemination of ID and AMR burden in “one health” perspective. In the scientific world there is plenty of data related to ID and AMR being generated.
It is important to analyze and study these data reports to address future emerging problems which threaten global health. This requires vast computing resources to analyze and interpret the data. In recent years, artificial intelligence (AI), which uses machine learning and deep learning algorithms, has been effective in digesting these “big data” sets to give insight on AMR and ID.
Project Description
We propose to work on AMR expert system based on NLU/NLP. The expert system integrates data from databases and publications into a knowledge graph, which can be queried to retrieve known facts and to generate novel insights. This tool uses advanced AI, allowing users to make specific queries to the collections of papers and extract critical AMR knowledge – including embedded text, tables, and figures.
Examples of the types of queries:
- Which anti-microbial drugs have been used so far and what are the outcomes?
- Identify new, reported risk-factors
- Ranked antimicrobial drugs that are mentioned in AMR related articles.
- Ranked bacteria mention in the AMR related articles.
Currently, we have an existing pipeline of an AMR expert system with data around 400 papers developed by the Fall 2021 CSC Senior design team. It includes a basic domain specific language model and NLU engine to return articles and knowledge across the articles. We would like to enhance the expert system with advances in the domain specific natural language model, innovative training method, and data visualization for knowledge graph queries.
With the Spring 2022 CSC Senior design team, we plan to address the following goals:
- Understand and improve performance of the existing AI pipeline for AMR system
- Build UI (optionally gamified) for supervised training by subject matter expert
- Extend the Visualization for knowledge graph queries
- Extend Data ingestion mechanism to handle data type mismatch and other data standardization issues.
Skills: NLU/NLP, Data Visualization, Cloud AI tools, Cloud devops. Front end interface design
Technologies and Other Constraints
GitHub (preferred)
IBM Watson Discovery Service (required), IBM mentors will provide education related to this service
NLP Machine Learning
Web front end (initial pipeline includes React, but flexible)
Cloud Services for AI and Devops
Sponsor Background
The Department of Computer Science, like many large university departments, teaches hundreds of course sections each year. The sponsors of this project are faculty members who, in addition to their other responsibilities, ensure that every semester those sections are scheduled with the University so that students may enroll in courses.
Background and Problem Statement
The scheduling process for an academic year starts in the Fall, which is when the following academic year is planned, with input from the entire faculty. That input is collected in two stages, using a Google Sheet and a Google Form, and then organized manually to produce a list of sections for fall, spring, and summer terms. Those sections are then scheduled manually, using yet another spreadsheet. Finally, the schedule in that spreadsheet is converted in a painstaking way into a format that facilitates data entry into the University’s MyPack system. Because the data entry is manual, the last step is to export the schedule from MyPack and compare it to the spreadsheet, to ensure there are no errors.
Project Description
Because the scheduling process, which spans months and several phases, has so many manual steps requiring cutting and pasting information between different kinds of documents, it is error prone. The department schedulers want a web-based application that supports as many phases of the scheduling workflow as possible. Key features are:
- the ability to import CSV files containing the course catalog, the sections to be scheduled for a semester, and the requirements (per section) provided by the instructor (e.g. classroom must have movable furniture, or their classes cannot be scheduled back to back);
- a web-based GUI supporting concurrent users in which sections can be scheduled by dragging them onto a calendar; and
- continuously validating the current schedule by checking that it violates neither instructor preferences nor any general rules entered by the schedulers (e.g. the Senior Design problem session on Fridays cannot overlap with any another Senior Design section);
- the ability to export CSV files that allow a semester’s schedule to be saved outside of the application’s database, and the export of a CSV file specifically for comparison with the data entered (and exported by) MyPack, to find any data entry errors.
This project is a continuation of one from a previous semester, but it should be started again using a different technology stack. A certain amount of front-end functionality, including calendar drag-and-drop, is there in JavaScript and can be reused, along with many visual elements. In this current project, you will (a) design a new user experience; (b) implement automated rule checking; (c) write CLI-based utilities to convert Google Form data so that it can be imported into the application; (d) implement a “view history” feature to show how a particular course was taught in the past (when, where, and by whom); (e) generate a report on a per-instructor basis; and (f) implement a “view and comment” feature by which any faculty member can see the schedule and ask questions.
Your project will be the rare Senior Design project that is intended to be used in a production environment by your sponsors when you are finished with it.
Technologies and Other Constraints
In the prior project, PHP was used because the CSC Department IT staff required it. We expect this semester’s team to write essentially from scratch using a more modern stack (front-end, back-end, and database). The deployment will be done via Docker. The application will integrate with Shibboleth for authentication. The student team will grant the CSC Department and NCSU broadly the right to use and modify the application as they see fit.
Students will be required to sign over IP to sponsors when the team is formed
Project Archives
| 2026 | Spring | Fall | |
| 2025 | Spring | Fall | |
| 2024 | Spring | Fall | |
| 2023 | Spring | Fall | |
| 2022 | Spring | Fall | |
| 2021 | Spring | Fall | |
| 2020 | Spring | Fall | |
| 2019 | Spring | Fall | |
| 2018 | Spring | Fall | |
| 2017 | Spring | Fall | |
| 2016 | Spring | Fall | |
| 2015 | Spring | Fall | |
| 2014 | Spring | Fall | |
| 2013 | Spring | Fall | |
| 2012 | Spring | Fall | |
| 2011 | Spring | Fall | |
| 2010 | Spring | Fall | |
| 2009 | Spring | Fall | |
| 2008 | Spring | Fall | |
| 2007 | Spring | Fall | Summer |
| 2006 | Spring | Fall | |
| 2005 | Spring | Fall | |
| 2004 | Spring | Fall | Summer |
| 2003 | Spring | Fall | |
| 2002 | Spring | Fall | |
| 2001 | Spring | Fall |