Projects – Fall 2018
Click on a project to read its description.
Social Science Research & Analytics – Healthcare Decisions
Opportunity
Consumer sentiments and motivations behind healthcare choices are recognized as a key determinant in health outcomes. This project offers an opportunity to analyze and understand sentiments regarding “being uninsured” and what factors play into people’s decision to remain uninsured, or decisions to purchase one type of health coverage over another.
Solution
Develop a system to gather data available on various social media platforms to glean insights into consumer attitudes toward established healthcare. The system should automatically mine social media platforms for configurable keywords and store the information for analysis and visualization. A front-end for reporting and visualization of the data will support the following use cases:
- Analyze the data for insights about customer experience
- Analyze social media sources to gather the most common keywords and statements associated with different healthcare brands (payer, provider, health solutions).
- Review and visualize data to determine what are sentiments regarding “being uninsured” and what factors play into people’s decision to remain uninsured.
The system will be hosted on cloud resources that are HIPAA compliant.
Learning
Anticipated activities and opportunities for learning:
- Gain familiarity with methods of evaluating consumer sentiment
- Gather and manage large datasets from disparate sources.
- Learn how to set up and manage data store solutions as containers for datasets.
- Learn “data wrangling” methods - prepare data for use by introductory machine learning or other analytic methods.
- Opportunity to use simple analytics and machine learning methods to evaluate large datasets.
Takeaways/Question to answer
- What motivates a person to remain uninsured?
- What factors motivate a person to select one coverage plan over another?
- What are the best methods for consistently learning about people’s needs and motivations from social media channels?
Students will be required to sign over IP to Sponsor when team is formed.
Dashboard for Automated Test Results Visualization
Problem Statement
BlackBerry QNX technology includes QNX Neutrino OS and many middleware components. BlackBerry has decades of experience in powering mission-critical embedded systems in automotive and other industries. As the leader in safety-certified, secure, and reliable software for the automotive industry, BlackBerry currently provides OEMs around the world with state-of-the-art technology to protect hardware, software, applications and end-to-end systems from cyber attacks.
For Self-Driving Cars, functional safety is part of the overall safety of a system or piece of equipment and generally focuses on electronics and related software. As vehicles become increasingly connected and reliant on software, new threats emerge. Therefore, it is imperative that it operates safely, even when things go wrong. A self-driving car is an extremely complex system with state-of-the-art technologies. Proving that the system does what it is designed to do is a great challenge. And it must do so in a wide range of situations and weather conditions. This requires a stable, secure and efficient operating system.
To ensure mission-critical reliability, BlackBerry QNX continually performs extensive automated testing of their software components by executing hundreds of thousands of tests daily. The current process of identifying trends, issues and generating charts and reports from these tests consume a tremendous amount of effort.
Automating this process and generating visual representations of trends and issues would help to identify software issues as early as possible and enable employees to focus on other tasks.
Project Description
The goal of this project is to visualize the data generated by an automated test systems and to streamline and enhance the capability of identifying issues and trends as early as possible. Developing a web dashboard would be beneficial as a cross-platform solution where software quality trends can be easily digested and customized for each test area and user.
The team will be expected to:
- Develop an interactive, user-friendly web dashboard that visualizes test results from a database. The dashboard must provide users with the following functionality:
- Search the database for existing test documents (focus on one key search, for example by fields such as username, test area, time of test, etc).
- Select one or more of the search results to be charted
- Generate charts and/or reports from the selected test
- The dashboard may provide the following features:
- Individual user customizations (user login)
- Create a server-side application that:
- Provides an interface (such as REST) for client-side applications
- Allow querying of available test documents and retrieval of data from the selected documents
- Retrieval and Storing of user customization
- Retrieves data from a MongoDB database based on parameters provided from client
- Runs on Linux and/or Windows OS(es)
Stretch Goals
The following are stretch goals for the system:
- Additional dashboard features
- Additional search and reporting features
- Management of user dashboard settings
- Ability to save and retrieve previous generated charts/reports
- Server-side application
- Additional server interface functionality to support additional search and reporting features
Skills, Technologies & Constraints
Some prior experience developing web (server-client) applications is strongly recommended for this project.
Members of the team would be expected to have or learn some of the following skills:
- JavaScript/Node.js - or similar language for web application
- Angular, React, Express.js, etc.
- JSON
- HTML
- REST API
- MongoDB (No SQL database) - Basic database experience suggested
- Version Control System (Mercurial, SVN, Git) - No prior experience needed
Students are free to choose any of the programming languages commonly used for server-side web development. It is recommended to use a language that has a MongoDB Driver available like Node.js (see https://docs.mongodb.com/ecosystem/drivers/ for supported languages)
The client-side dashboard must be written in a language supported by modern web browsers; a modern JavaScript framework is strongly suggested.
Support
BlackBerry QNX mentors will provide support at the beginning of the project for a project overview, initial setup, and assistance in the software tool selection.
The students will also be provided with:
- Sample data in a MongoDB database containing data that needs to be charted
- Demonstration of current proof of concepts developed
- Minimal wireframes of dashboard interface
- Guidance on setting up development environment and supporting tools
Mentors will be available to provide support, planning sessions, Q & A, technical discussions and general guidance throughout the project. Mentors will also be available for meetings on campus as necessary.
About BlackBerry
BlackBerry is an enterprise software and services company focused on securing and managing IoT endpoints. The company does this with BlackBerry Secure, an end-to-end Enterprise of Things platform, comprised of its enterprise communication and collaboration software and safety-certified embedded solutions.
Based in Waterloo, Ontario, BlackBerry was founded in 1984 and operates in North America, Europe, Asia, Australia, Middle East, Latin America and Africa. For more information visit BlackBerry.com
About QNX
Customers rely on QNX to help build products that enhance their brand characteristics – innovative, high- quality, dependable. Global leaders like Cisco, Delphi, General Electric, Siemens, and Thales have discovered QNX Software Systems gives them the only software platform upon which to build reliable, scalable, and high-
performance applications for markets such as telecommunications, automotive, medical instrumentation, automation, security, and more.
QNX software is now embedded in 120 million cars that are on the road today. Automotive OEMs and tier ones use BlackBerry QNX technology in the advanced driver assistance systems, digital instrument clusters, connectivity modules, handsfree systems, and infotainment systems that appear in car brands, including Audi, BMW, Ford, GM, Honda, Hyundai, Jaguar Land Rover, KIA, Maserati, Mercedes-Benz, Porsche, Toyota, and Volkswagen.
Each Student participating in the project will be required to sign Non-Disclosure Agreements and agree to assign to BlackBerry any IP relating to the project.
Supportive Testing Framework for Prediction Models
Context
Bronto’s clients send marketing emails to their contacts. Those contacts open and click the emails and then are tracked as they browse the client’s website and make purchases. Those orders are synced back to Bronto, so we know what they bought and total revenue. We also know when the contact was created and if/when the contact unsubscribed from emails.
Clients would like to see predictions of what a contact’s lifetime value will be (based on the frequency and size of their orders and when they are likely to churn out, ie unsubscribe from marketing emails). The churn-out prediction alone is something they’d like to see. You would use this to trigger a re-engagement campaign, or rather a please don’t go campaign, for those who are nearing the predicted end of their engagement with the marketer.
Proposed Solution
Given a set of contacts, each with a sequence of actions (received a message, opened an message, clicked a link, browsed a site, placed an order), build a prediction model that predicts what action each contact will take next. But building prediction models is not a one time task. To support building prediction models, we want to create a testing harness that can automate the process.
The first step is to build a testing harness that can
- take as input a data set and a black box prediction model
- set aside some portion of the data, themes recent events
- feed the rest of the data into the prediction model
- receive the model’s output
- measure the model’s accuracy using the withheld recent events
You’ll need some data sets, which means writing some non-random fake data generators.
If there’s still time in the semester, then we’ll also build some of those prediction models.
The prediction can take a few forms:
- when will a contact unsubscribe, or how likely are they to unsubscribe in the next year
- how much money will a contact spend in the next year, or in their lifetime (ie before they unsubscribe)
- which action will each contact take next (output one value for each contact from the set of possible actions)
- when will each contact take a particular action after a preceding event, eg after receiving the next message, how long will it take the contact to open that message (output a number of minutes, infinity if they’re unlikely to open it at all)
- how many contacts will take a chosen action after a preceding event, eg after the next message is sent to all of the contacts, how many will open it, click it, place an order
Interactive Tracker (Service Project)
What is Bugle?
Bugle is an application and website that enables service event organizers to easily manage volunteer events. Bugle provides a robust suite of project management tools to simplify the unique challenge of organizing a volunteer event. Bugle also helps volunteers find service opportunities within their community. Volunteers can search for events by category, location, and time. Bugle’s services are free for volunteer organizations hosting events as well as volunteers looking for them.
Users
- Event organizer (event host)
- Event leaders (volunteers who are selected to assist with organizing an event)
- Volunteers
Concept
Interactive tracker is a collaborative tool featured on the Bugle app. The interactive tracker allows an event organizer to select event leaders from the volunteers who have signed up for a given event. The event organizer uses the interactive tracker to assign tasks to event leaders and monitor their progress. There are three task categories: pre-event, during-event, and post-event. When an event leader completes a task, the event organizer will be notified. The tracker will reflect the number of tasks completed and those remaining. If an event leader is unable to complete a task, they can communicate the challenge, delay, or help they require. Once all ‘pre-event’ tasks are completed, an event will be prepared to launch. During an event, the event organizer can use the interactive tracker to observe the status of their event and identify what tasks are coming up next. This will be particularly helpful for larger events like Relay for Life. For large events requiring sequential sub-tasks, the event organizer can input the sub-tasks and order them accordingly. When an event leader completes a sequential task, the next event leader will receive a push notification to begin their task.
Purpose
Reduce the number of meetings needed to organize an event.
Functionality
- Event coordinators can select event leaders from volunteers who have signed up for an event
- Event organizers can assign tasks to event leaders
- Event leaders can add tasks for themselves to complete
Interactive Tracker Product Description
- Event organizers and event leaders can view all event tasks and their status
- Event organizer can build a sequence for during-event tasks
- Event leaders will receive push notifications of start times of respective tasks
Technology
We would like a mobile-app for the android platform. We are open to the app being written in any language.
Students will be required to sign over IP to Sponsor when team is formed.
Pollinator Garden Design
Background and Problem
Over the past decade, scientists and the public have become increasingly aware of declines in the health of managed honey bees, as well as populations of wild bees such as bumblebees. To help counteract these declines, many programs encourage individuals to install “pollinator gardens” on their properties. These habitats typically draw on lists of recommended, perennial plants are known to provide pollen and nectar for bees. Although these habitats can be effective, in our local outreach and extension work, we have noted that garden design remains a barrier for many homeowners who are unsure how to create an aesthetically appealing garden using recommended pollinator plants.
To overcome this barrier, we would like to offer a web-based garden visualization app that lets homeowners map recommended plants into a garden space and view the virtual planting in three dimensions prior to installation. While similar apps do exist (for example, here https://www.bhg.com/gardening/design/nature-lovers/welcome-to-plan-a-garden/), they include few if any suitable plants for attracting pollinators and lack other desirable features, such as the ability to view a planned garden from different angles.
Solution Description
We envision an app that allows users to:
- Enter shape and dimensions of garden space to be populated
- Filter available plants by height, bloom color, bloom season, soil type, shade tolerance, and plant type (vine, shrub, etc.)
- Drag recommended plants into garden space
- View resulting garden in layout view, as well as a realistic side view, potentially from multiple angles
- Update the view for different seasons, for example, to visualize which flowers will bloom together or which season lacks flowers
- Generate a plant shopping list based on the final design
- Note that we are working on finding or creating plant images to use in garden visualization; we hope that, in the meantime, app design can proceed using simple, colored shapes or other placeholders to substitute for more elegant images.
Additional considerations:
- Users will need to sign in to save their design
- As an underlying database from which to draw plant information, we may be able to use https://plants.ces.ncsu.edu/ which is currently being updated to include more pollinator plants
- We would like the app to work in any browser and be mobile responsive. (Many existing garden design apps don’t run in Chrome, which is frustrating.)
- We envision an NC-centric app whose source code could be modified by/for Extension educators in other regions to operate based on their own available plant lists. Under what license could the source code be released?
Future Development
In time, we would like to add additional features to the app/website. In case it is useful to have these on the table from the start, they include the following functions for users:
- Optionally (for the truly design-timid user), select a garden style (e.g., English cottage vs. modern) and preferred bloom colors, to produce an automatically populated garden, which they can then modify by dragging/replacing plants
- Receive alerts when their design does not meet all biological or design recommendations (e.g., your design lacks flowers in July, or all your plants are the same height.)
- Input their own data and observations about rates of insect visits to different plants
- Upload a background image (e.g., their house) against which the garden could be viewed
- Add their own custom plants
Weekly Meetings
During weekly sponsor meetings, we will review new developments in the app and provide feedback and clarification related to the goal of making it possible for anyone to design an attractive, bee-friendly garden.
Students will be required to sign over IP to Sponsor when team is formed.
Automated “One-Click” Deployment of Windchill
Background
Product Lifecycle Management (PLM) systems such as Windchill are used by manufacturing organizations to help manage their engineering product lines from the time they are created to the time they become obsolete. These systems are oftentimes tailored to fit the needs of the organization and are required to incorporate changes to the production environment quickly and frequently. However, deploying new PLM builds can be a long and complicated process with many important steps that tie up developer operations with manual build validation.
A company’s needs change over time and their PLM system must evolve to accommodate those changes. The changes could be things like adding validation to restrict access to certain products, changing the flow of work for certain Windchill part and document types, or creating new types altogether. Programmers make these changes in a development environment and record all the changes made. Once all of the changes have passed a testing process, the changes are deployed together to the production environment in a build.
However, not all changes are created equal! Different changes require different deployment steps—for instance, Java files must be compiled, changes to property files must be propagated, and XML load files must be loaded. Some changes require Windchill to be restarted while others simply require the browser to be refreshed. These steps can be a great hassle to deploy manually, particularly for large builds where hundreds of changes are made to many different file types. The changed files must first be deployed to their correct locations on the production server, then the corresponding build steps must be performed to ensure the correct incorporation of changes.
The focus of this project will be to create an automatic build deployment process for updated Windchill builds that any user could initiate. The “one-click deployment” must incorporate changes from build to build while keeping both client data and system performance intact. This more efficient automated process will reduce downtime and eliminate human error caused by manual build preparation. For companies with large and complex PLM systems, the one-click system and the continuous productivity it represents means millions of dollars in company savings.
Windchill is a PLM platform developed by PTC. For more information on Windchill and its capabilities, visit: https://www.ptc.com/en/products/plm/plm-products/windchill
Requirements
- Create a fully-automated build deployment process for Windchill with one user-initiated step
- Keep track of the changes to be made for each new build to ensure the proper files are added, removed, or edited
- Follow the correct deployment steps for each different type of change under the guidance of the sponsor team
- Changes that WILL be supplied by the sponsor team during the course of this project:
- Java files to be compiled and included in the build
- XML load files to be loaded
- Changes to XCONF files to be propagated
- Changes to files in the system's safe area, which require different deployment steps than changes to files in the regular file system
- Other file types may be supplied by the sponsor team pending successful implementation with the basic types listed above.
- Changes that WILL be supplied by the sponsor team during the course of this project:
Expected Outcome (KPIT)
The goal of this project is to end up with the core functionality of a tool that can be used to assist with automated deployment. The tool should be able to be demonstrated fully at the end of the project, however, may require modifications to be used on various customer projects based on variables such as Operating System, Code Repository, Local vs. Cloud Environments, etc. All code developed should be modular and easily updatable to meet the needs of multiple use cases.
Expected Outcome (Student Team)
Project participants should gain a working knowledge of the enterprise-scale application of Windchill and how deployments of the software work on VMs hosted on physical servers and potentially on cloud servers. Additionally, participants will strengthen their knowledge of JAVA, ANT Scripts, and various automated deployment functionality. The team will also be responsible for a basic user interface to control the program execution.
Delivery
This project should be created with an emphasis on automatic incorporation of changes within Windchill. In addition to deployment, the system must have a way to register the changes to be deployed with each new build and must go through the proper steps to deploy the changes correctly and automatically.
A successful implementation of the one-click deployment process will perform as follows: the sponsor team will provide the student team with changed files and deploy steps for the changes. The student team will devise a way to list the files for proper execution of the deploy steps in the one-click deployment application they create. If the application runs successfully, the changes will be seen in the production environment.
Smart Skills Development
The project involves creation of a new skills for Google Assistance/Alexa which will be able to provide the following services to its users:
- Provide details of Lab locations of LabCorp
- Provide address
- Open and Close times
- The lab locations need to be provided based on the service the user requires.
- Appointment Booking
- Authenticate the User
- Determine the Service which the Patient requires – this can be done by querying the user or by checking our systems if a test has been requested by a care provider.
- Determine the nearest Lab which provides the required service based on location of the Patient.
- We should be able to select an option when using app to start conversation with the skills developed as part of this project.
- Determine the availability based on Patients needs and book the appointment.
Stretch Goals
- Appointment Booking
- Send confirmation to Patient as calendar invite providing details of the appointment.
- Provide reminder to user of the appointment and any pre appointment task like fasting etc.
- With your knowledge of creating Alexis skills, create a second skill that supports clinical trial recruitment.
- Ask the Patient about his disease conditions
- Based on the age, disease conditions and location, determine if the Patient is eligible for any clinical trials study.
- Provide information about the study and provide ability to contact the study contact.
-
Here is a sample conversation:
User:  Find clinical trials near me.
Skill: What type of clinical trial
User:  Non-Small cell Lung cancer
Skill: Do want to see completed studies or recurring
User:  Recurring studies.
Skill: I have found 40 studies
User:  how many are pharma company run studies
Skill: I have found 10 studies. DO you want me to email you the details and the contact of these studies?
User:  No or Not now.
Skill: Ok, do you need more information of these 10 studies.
User:  How any are phase 3 trials
Skill: There are 3 trials in phase 3.
User:  I want only community based hospital sites
Skill: There are 2 trials which are hospital based.
User:  Send the details of these 2 trials.
Skill: sent!!
- Create dummy data and micro services which are integrated with the skill so that we can just plug all the data to make the skill productionized.
Students will be required to sign over IP to Sponsor when team is formed.
Predicting Part Failure with Machine Learning
Siemens Healthineers develops innovations that support better patient outcomes with greater efficiencies, giving providers the confidence they need to meet the clinical, operational and financial challenges of a changing healthcare landscape. As a global leader in medical imaging, laboratory diagnostics, and healthcare information technology, we have a keen understanding of the entire patient care continuum—from prevention and early detection to diagnosis and treatment.
Molecular Imaging (MI) and Managed Logistics (ML)
Medical imaging helps to advance human health globally, supporting early and precise diagnosis, a specific, less invasive therapy and solid after care. Answering to clinical needs in radiology, oncology, neurology and cardiology, Siemens molecular imaging systems (e.g., PET and CT scanners) provide solutions to help clinicians more confidentially diagnose, treat, and monitor disease.
MI systems will require maintenance (both planned and unplanned) throughout their life and spare parts are often needed to resolve issues. This is where Managed Logistics comes in. ML provides logistical support to our customers. We help to deliver confidence by effectively managing the spare parts supply chain. In other words, ML’s mission is to get the right part to the right place at the right time.
Project Overview
The current forecasting models ML executes to plan for future spare part demand is based on time series modeling. Using historical order volumes and these models, ML is able to achieve high part availability while at the same time keeping inventory costs low. Time series models are excellent at forecasting overall trends but often fail to predict unanticipated spikes and troughs in demand. Being able to accurately predict individual part failures in deployed systems would be a significant game changer for the way we manage supply chain operations.
Just as we in ML continually seek improvement, so do the engineers who develop the MI systems. With the advent of the Internet of Things (IoT), Siemens is developing “smart parts” to proactively alert potential failures. This access to large amounts of data streams from the machines in our MI installed base presents a great opportunity for ML to leverage this information. Our goal for this project is to turn this opportunity into reality.
Last semester a senior design team built an application that proved that these logs have at least some predictive value. This project has the potential to be a game-changing innovation in the supply-chain management game, and we are looking for a motivated group of students with a fresh perspective to take the next step in development. Are you ready to build on last semester’s research and develop a solution that will make even more accurate predictions?
Project Scope
Our basic goal for this project is to discover a predictive model that can use data from machine logs and spare part consumption logs to generate a prediction about when a machine part will fail. Due to the experimental nature of the project, we want you to create a research framework that will facilitate rapid prototyping and re-prototyping of possible solutions in order to approach the problem from several different angles. This allows for the project to be broken down into two major phases.
Phase I – Research Framework
In the first phase of the project, we are asking you to create an application or suite of applications that will help you conduct machine learning experiments in an organized and efficient way.
Data Extraction from MI System Logs
MI has created a data lake that stores the system logs that contain all discrete events for each of our machines. The logs essentially contain every action performed at the machine (e.g., power on/off, system initialization, scan initiation, failure tests, etc.). These logs can get very large for machines running 12+ hours a day and are not easily read by the human eye, but since they are structured in CSV format we anticipate that the logs can be analyzed, filtered, and formatted in an automated fashion. For the analysis process, we are asking you to develop software that can calculate basic statistical information about different types of logs. For filtering and formatting, we are asking you to create an application to convert a subset of the logs into a format suitable for input to a machine learning algorithm
Part Failure Prediction with Machine Learning
Once you are able to extract filtered and structured datasets from the MI system logs, the next step is to integrate spare part consumption data for each machine. The spare part consumption data is a small dataset that contains the date, part number, and quantity for spare parts ordered and installed at each functional location (example provided below). Combining these two datasets will enable us to analyze log data in relation to spare part consumption. We anticipate certain patterns will emerge in the MI log data that will help predict specific part failures.
Identifying all the potential combinations of system events and analyzing these patterns “by hand” is an arduous task to say the least. But there are several techniques in the field of machine learning that could yield highly effective prediction models. We are asking you to research and recommend potential machine learning techniques that could be implemented based on the dataset. Recommended machine learning techniques to begin your research are Decision Trees (CART), Support Vector Machines (SVM), or Artificial Neural Networks (ANN), but feel free to recommend other options. We then want you to implement one of these techniques and build a prototype to predict the spare parts needed.
Reporting of Experiment Results
For the final step of the framework, we are requesting that you create a frontend application or webpage to display the accuracy of different models in a way that is easily interpreted and comparable. This display should also list the variables for each experiment, including the model type and parameters, which spare part is being considered, which subset of log data was used, and any other relevant information.
Phase II – Rapid Prototyping
Once you have created the research framework in Phase 1, we expect you to use this framework to rapidly experiment with different variables in an effort to find an especially accurate model. This could involve extracting a different data set from the logs, using a different machine learning technique, tuning the machine learning model, or focusing on a different part.
We at Siemens realize that as computer science students you might not have had a lot of exposure to data analysis and machine learning. But if you are a student that has taken analytics or data science courses we think this could be an excellent opportunity to combine your skills and talent to accomplish something very impactful. Because of the ambitious scope of the project, Siemens is committed to working closely with you to ensure that this project is solvable and successful.
NOTE: Students will be required to sign Non-Disclosure Agreements and sign over IP to Siemens Healthineers when team is formed.
| Order Created | Part Num. | Quantity | Machine ID |
|---|---|---|---|
| 12/1/17 12:11 AM | 10522041 | 1 | 400-010960 |
| 12/1/17 1:12 AM | 10412189 | 1 | 400-029235 |
| 12/1/17 12:06 AM | 10909856 | 1 | 400-028439 |
| 12/1/17 12:21 PM | 04361585 | 2 | 400-028440 |
| 12/1/17 4:26 PM | 05989228 | 1 | 400-028441 |
| 12/1/17 7:21 PM | 11296055 | 2 | 400-031821 |
| 12/1/17 9:56 PM | 07833192 | 1 | 400-024036 |
| 12/1/17 8:06 PM | 08423472 | 1 | 400-033380 |
| 12/2/17 1:21 AM | 10763443 | 1 | 400-014751 |
| 12/1/17 11:01 PM | 10412000 | 1 | 400-032146 |
Usage Data Mining Framework
The Problem
Telecom systems generate a lot of usage data. This usage data ultimately gets rated and rolled up into invoices for customers. It also helps business analysts make strategy decisions. There is a lot of untapped information that can be gleaned from the usage data. Bandwidth would like a framework for mining this data. The framework would allow Bandwidth to accomplish various business objectives:
- Identify trends in customer use of our products. For example, a customer who signs a contract for a set of services will usually not start using those services right away. There is a ramp-up period in which they slowly begin using our services. What does that ramp-up look like? How long does it take to reach peak usage?
- Identify customers that are likely to reduce or increase their usage
- Identify anomalies in the data. For example, a spike in messages could be the result of a spam campaign. As another example, if a customer’s bill is significantly higher or lower this month compared to an average bill, then we want to find out about it before beginning the normal verification process.
- Do all of these things in a way that satisfies our obligations to protect our customers’ data.
The Solution
Bandwidth would like a framework for mining our usage data to answer the question, “how are customers using our VoIP network?”
- The team will develop an application to ingest large data sets and calculate various statistics about the data. This will include the ability to view the statistics in graphical form, and a way to “slice and dice” the data by various dimensions.
- The team will work with Bandwidth to come up with a set of statistics to track across the data set. Examples of the statistics include:
- Voice and messaging usage by customer in a given month
- Average phone call duration for a given customer
- Histogram of call types (interstate, intrastate, local call), etc.
- Day-by-day breakdown of the number of SMS messages sent by a customer
- The specifics will be driven by the data. If the team finds there are other interesting trends, the scope can be changed.
- The framework should support an initial set of statistics, but it should be extensible so that we can add other metrics in the future.
- Since network data is customer sensitive, the software needs to be secure in the way it stores data. Real production data is not available outside of the production environment. For testing and development, we need fake data to work with. Part of the project will involve developing a data generator tool to feed fake billing records into the system. The records will be in JSON format, and will describe individual “billable events” that occurred on our VoIP network - for example a phone call or an SMS message. The event format is proprietary to Bandwidth. Bandwidth will provide sample records and a description of the data format.
- The application should leverage open source tools where appropriate. Examples include but are not limited to:
- Data ingestion tools such as Talend or Pentaho Kettle
- Machine learning libraries such as deeplearning4j or prediction.io
- Data visualization frameworks such as Kibana
- “Big Data” tools such as Apache Kafka, ElasticSearch, MariaDB, MongoDB, Hadoop
- We would prefer a Java-based solution, but it’s not a requirement.
Recommended Student Skills
Choice of technology stack will be left up to the students, but a general recommendation for skill set would include:
- Java
- Web UIs and RESTful web services
- Data analysis
- Database, message queues, and data processing frameworks
- relational or NoSQL databases
- Apache Kafka
- Hadoop
About Bandwidth
At Bandwidth, we power voice, messaging, and 9-1-1 solutions that transform every industry.
Since 1999 our belief in what should be has shaped our business. It’s the driving force behind our product roadmaps and every big idea. It’s a past and a future built on an unrelenting belief that there is a better way. No matter what kind of infrastructure you have (or don’t have) we’ve got your back with robust communications services, powered by the Bandwidth network.
We own the APIs and the network. Our nationwide all-IP voice network is custom-built to support the apps and experiences that make a real difference in the way we communicate every day. Your communications app is only as strong as the communications network that backs it, and with Bandwidth you have the control and scalability to ensure that your customers get exactly what they need, even as your business grows.
Network Configuration Import and Transformation in Virtual Internet Routing Labs (VIRL)
Background
Most (Cisco) data networks are defined by a set of device configurations in text form. In the past, network engineers maintaining such a network applied configuration changes as individual tasks, ideally with a peer review before making changes to a live network.
In the context of “network as code” and by applying continuous integration or continuous deployment (CI/CD) principles, network engineers are moving towards a NetDevOps kind of model where the set of configurations is stored in a code repository (e.g. GitHub, GitLab etc.) and changes to the production network are only applied if testing those changes before deployment has been successful. In principle, this testing and validation process could be performed and even automated using a separate test network, but most organizations cannot afford to reserve that much networking hardware just for performing automated validation.
This is where network simulation comes into play. The configuration changes can be validated in a simulated network as part of the deployment lifecycle. Unfortunately, the virtual devices often don’t simulate all features of the corresponding physical device. Therefore, a major gap in this lifecycle is the transformation of actual device configurations to virtual device configurations. For example, the interface types and names in the configurations need be transformed to convert the device configuration from the ‘physical device’ to the ‘virtual device’.
Cisco provides two related products for achieving this network simulation: Virtual Internet Routing Labs (VIRL) and Cisco Modeling Labs (CML). Both products allow network engineers to design network topologies and then have them virtualized using "reference platforms" or virtualized instances of common device models (e.g., enterprise router, service provide router, LAN switch, etc.).
The goal of this project is to automate the process of transforming a physical network topology represented by a set of actual device configurations to a virtual topology representation that
- reflects the physical topology as accurately as possible, and
- that can be virtualized and simulated.
Description
In this project we want a tool to provide this transformation and mapping capability so that users can transition their real network configurations to VIRL in an easy way. VIRL is product sold by Cisco that customers use to run simulated networks as a set of interconnected virtual machines. VIRL provides a user interface and a web services API for starting and working with network simulations. To run a network simulation in VIRL, the user must create a file in a pre-defined format that describes the network topology (the virtual device nodes and the physical links between them) and the initial configuration of each virtual device in the network.
In practice, the user will be a network engineer who has a set of (plain text) configurations from the real devices in his production network, one configuration for each device. The user needs the tool to generate a topology file in the pre-defined format that describes the network topology represented by the set of configurations. The initial configuration associated with a virtual device in the generated file will be the (plain text) configuration of the corresponding device in the physical network with some additional transformations applied.
The team will be provided with multiple sets of sample configurations, and each set will represent a consistent and enclosed network topology.
- The tool must map out the connections between the individual devices by matching IP address information, which can be considered as a L3 mapping.
- Empirical or user guided mapping of device types will be required as configuration syntax will not be uniform across the devices in the network.
- Interface names from the physical devices must be transformed to match the interface types and numbering that are provided by the corresponding type of virtual device. Ideally, relative interface position within a device should be maintained.
- Topology generation to a defined and provided topology data model should be based on the discovered node / link relationship.
- Mappings (device type, interface names) must be stored in a file to accompany the resulting topology description.
- Finally, unused device configurations should be added to the topology by querying the user how they are related (most likely L2 devices) to the overall topology. The results of this user interaction should be preserved so that they can be used for future transformations, eliminating additional interaction with the user. The assumption is that most users would be using the tool repeatedly to test changes to the same network over time. Since the device configurations typically change more frequently than the overall network topology, the user’s device type mappings and unused device configuration choices can be applied each time the tool is run on the new set of configurations from the network. No user interaction would be required after the first run unless the overall topology changes in a way that creates an ambiguous device type mapping or an unused device configuration.
The student team will be provided with
- the file format for the topology description
- sample sets of configuration inputs
- sample sets of configuration outputs
- access to the VIRL simulation environment
Required Student Skills
- Required
- Students must have taken or be taking at least one course in networking.
- Recommended
- Experience in Python programming.
- Familiarity with JSON.
- Experience using an SCM tool, preferably git.
- Experience using GitHub.
- Some experience with VIRL (or another network simulation platform) is desirable, but not required.
Motivation
DevOps principles and techniques have become industry best-practice in the system administration community, leading to both increased reliability and agility. The networking community is increasingly adopting these practices; however, applying the techniques to the networking domain presents unique challenges.
This project looks at a critical aspect of building a Network DevOps toolchain for enterprise customers: the ability to quickly and easily import real-world network configurations into a simulated environment. This capability would enable safe automated testing, what-if scenarios, and developing network automation solutions against a model of the existing network.
Students will receive exposure to real-world network configurations, and work on tooling that is directly applicable to some of the largest networks in the world. Network DevOps is a hot topic in the networking industry, and this project will help address a key gap in existing solutions.
Through integration with network simulation tools within Cisco, students will be able to test and validate the progress of the project on large-scale network simulations of real network operating systems running advanced protocols. By integrating their solution with an existing product with a large user base, the students have the opportunity for their work to be exposed to wide section of network operators.
This project will provide a valuable tool for Cisco's customers to more quickly integrate their existing networks with Cisco simulation tools. This allows for more accurate, faster and easier customer workflows and deployment cycles that can be delivered with higher degrees of confidence. Cisco will also gain insight into key challenges and possible solutions in this important aspect of the Network DevOps space.
Deliverables
- A software utility library that can take a set of configurations and produce both a topology description file and a set of translated configurations based on the requirements listed in the Description section above.
- Code MUST be provided in a git code version control repository.
- A summary report of the key challenges or solutions identified during the project - especially for problematic configurations or topologies. It is unlikely that the solution will be able to automatically handle all real-world configurations, and providing information that can be later turned into user documentation is important.
Note: Access to the Virtual Internet Routing Labs (VIRL) product will be provided.
Text & Image Reader App
The Assignment
Banks deal with huge number of documents during normal operations. A number of work hours are spent in reviewing these documents and validating its contents. Hence a of the doc-review process.
Specifications and Requirements
- Parsing
- Use open source technology to automatically parse PDF documents (up to 200 pages long) that contain text
- Use open source OCR (optical character recognition) technology to extract plaintext from PDFs of scanned document images (up to 10 pages long).
- Upload and Storage
- Create a web app to facilitate upload of the documents and use a database to store the results.
- Comparison
- Facilitate comparison of results from 1.1 and 1.2 and show the comparison on a web page.
Recommended Student Skills
- Middle Layer : Java, Spring MVC, Spring Boot,
- Backend : MySQL would do
- UI: Angular 4 or simple template engines like Thymeleaf in conjunction with basic HTML5, CSS and JavaScript
The Fall 2018 Semester
Students will use their course knowledge, creativity, and technical expertise to create a text and image reader that will be used by all DB employees. DBGT will provide content, guidelines, and support in scoping this application to be deliverable within a semester. The DBGT team is here to aid and guide the student workflow, processes, and design ideas. We support and encourage the students’ input on this project as well as their engaging creative approaches to developing this app.
The NCSU Student Experience
Senior Design students in the College of Engineering Department of Computer Science will have a unique opportunity to partner together over the course of the semester to contribute to an exciting educational open source platform that will be used by DB employees as well as other companies potentially as well. Additionally, students will have access to industry professionals to assist in the software design, agile practices, and the overall code development and testing. Students will be allowed to share their resulting app as part of their own portfolio while job seeking.
Background
Deutsche Bank Global Technology (DBGT) is committed to an inclusive culture that respects, embraces, and leverages the diversity of our people, our clients, and our communities in order to reach our aspiration to be the leading client-centric global universal bank. We seek to attract, develop, and retain the best people from all cultures, countries, races, genders, sexual orientations, abilities, beliefs, backgrounds, and experiences. It is very important to foster an inclusive and respectful work environment where every employee can be authentic, contribute his or her best work, and succeed based on merit.
Clubly
Background
There is a huge problem with students’ groups and clubs not having high attendance rates for events, and also, the students that are still interested in joining those groups aren’t as connected to those groups as they’d like to be. With a disconnect as big as this, there’s a possible solution in having a single app and platform to connect organizations and students.
Features
- Event Planning
- Sign in / Attendance
- Find organizations and upcoming events by interests
- Achievements / Gamifying attendance
- Calendars
- Surveys
Technologies
Front End: To create a dynamic and responsive mobile application that is supported by both iOS and Android we are going to use React Native, which will allow us to use JavaScript and React. We are also going to have a website to promote our app. It is going to be hosted on github.io and be written in React.
Back End: We are going to use Firebase because it provides real-time data, has free hosting on the Google Cloud Platform, and provides authentication tools to ensure that the database is secure.
Objectives
- Create something new and tangibly useful!
- Use a technology stack that’s relevant and popular in industry.
- Understand how to grow an idea into an early stage startup.
- Create an MVP, grow a user base, iterate on feedback.
- Learn more about entrepreneurship.
Team Members
- Anastasia Egorova - Anastasia has previously interned at SnapSolv and Microsoft as a software engineering intern.
- Meghana Subramaniam - Meghana has previously interned at Cisco and JPMorgan Chase as a software engineering intern.
Both Meghana and Anastasia will be focusing on the technical and entrepreneurial aspects of this product.
FIRST Tech Challenge Event Management System (Service Project)
About the FIRST Tech Challenge
FIRST is a non-profit organization whose mission is to inspire young people to pursue careers in Science Technology Engineering and Math (STEM) through participation in competitive robot programs. The FIRST Tech Challenge is a FIRST competition with over 5,900 teams comprised of 59,000 participants ages 12-18 competing in dozens of countries around the world.
Project Description
The primary goal of this project is to develop and deploy a system to be used for event management and real-time scoring at all FIRST Tech Challenge competitions. The expectation of FIRST is that students who participate in the project will agree to license their work through a BSD license agreement.
The system includes the following features:
- Event Creation and Management
- Team Creation and Management
- Sponsor Creation and Management
- Inspection Scheduling and Status
- Judging Scheduling and Status
- Match Generation (creating match schedules for the participating teams)
- Match Control
- Real-Time Match Scoring (using handheld tablets)
- Audience, Team and Video Displays (with support for audio and chroma key video overlay)
- Cloud-based support for scoring, team ranking, and other event data
In addition to the above features, the project team will also need to address the following requirements:
- System should integrate with existing FIRST systems and processes.
- System should incorporate an automated test mechanism (such as Jenkins server or similar) for regression testing and release management.
- System be secure and only allow access to authorized users.
- System administrators
- Regular users (event volunteers)
- Teams must provide system and architectural documentation.
- Team must help develop training material (printed/PDF and video tutorials) to instruct users on how to operate the system.
Skills Required
For this project, the project team should have the following skills:
- Programming knowledge (Java, JavaScript, and SQL).
- Apache knowledge (Spark, Velocity, REST and POI).
- Experience with front-end / web interface development (HTML, CSS, JavaScript and jQuery).
- Experience with version control (git) and dependency management (gradle) tools.
- Experience with automated test tools (Jenkins or similar, JUnit, and Selenium).
- Ability to write technical documentation and training material.
Note that it is not necessary for each team member to possess all the required skills. Instead, team members with complementary skills would be acceptable.
ONTAP Security Audit and Remediation Tool (OSART)
Description
ONTAP is NetApp's proprietary operating system used to manage data whether it is stored in physical storage arrays, within the cloud or in hybrid cloud environments. Storage engineers are expected to manage and maintain data in a secure manner, throughout its lifetime cycle. Today's storage environments face a litany of threats: ransomware, unauthorized data access, man-in-the middle attacks, etc.
Faced with these threats, we want to help storage administrators by giving them tools to help assess the security “posture” of the systems that they administrate.
The Security Content Automation Protocol (SCAP), maintained by the National Institute of Standards and Technology (NIST) is a specification for evaluating how well a system conforms to a specific security profile. OpenSCAP is an open source project that implements SCAP. While OpenSCAP has support for Linux, it does not support FreeBSD (the base OS used to implement ONTAP). The goal of this particular project is to further develop and refine an existing Python server based web implementation that uses OpenSCAP to assess ONTAP. The Python-based tool, which currently has the capability of auditing ONTAP against a limited set of security capabilities will be enhanced to: 1) add additional security baselines and 2) contain a remediation phase which would result in configuration recommendations and/or changes in order to meet a predefined security baseline.
Project Goals/Deliverables
- Phase 1: OpenSCAP: Familiarize yourself with the OpenSCAP tools by customizing a Red Hat Enterprise Linux server
- Phase 2: Create/augment a SCAP security policy for ONTAP. This policy, based on the Security Technical Implementation Guide (STIG) for ONTAP, would cover the various security facing configurations of ONTAP including: firewall settings, FIPS setting, audit logging configuration, key management, etc.
- Phase 3: Modify/enhance the existing NetApp Python SCAP web server to identify and classify vulnerabilities found on the ONTAP system.
- Phase 4: Based on the scanner results from phase 3, create a set of recommended configuration changes that, when implemented, would bring the ONTAP system into compliance with the security policy.
Development Environments
- Red Hat Linux (as a target and as the OpenSCAP development environment)
- OpenSCAP tool set
- VMware hosted instance of ONTAP which will serve as the tools target.
Required Student Skills
- Python
A flexible and extensible framework for measuring machine learning performance
Problem summary
Principled Technologies administers the BenchmarkXPRT development community, which creates and maintains a number of widely used benchmarks. We are considering creating machine learning benchmark
The goal of this project will be to develop a GUI control panel for automating tests using combinations of machine learning workloads, computing a performance metric, and uploading the results to a database hosted by PT. Initially, we will use this as a lab tool to make running candidate workloads and gathering results simpler. later, it may evolve into the framework for a new benchmark. Part of the project will be assessing the impact of the control panel on the performance of the workload by comparing the results and runtimes of the workloads when run from the command line with those when using the control panel.
Project details
The project requires the following:
- The target platform is Ubuntu Linux. The target language is Python. Beyond that, the students should feel free to propose any tools or libraries they think will make their work more efficient.
- PT will provide a design for the look and feel of the control panel. The team will be responsible for implementing this design. The design mockup will be created in Adobe XD, which will allow the students to click on elements and see examples of the expected behavior.
- The control panel must be extensible. One possible mechanism would be to have a config file listing the workloads and command lines to use. The purpose here is to make it easy to different set of workloads using various sets of parameters and collect the results in the database mentioned above.
- PT will provide an initial set of workloads and associated command lines for each.
- The control panel should list the workloads that are available. Users should be able to select any combination of workloads and specify the number of iterations to use for each.
- The control panel should incorporate a way of saving a combination of workloads to use as a default test.
- We are assuming that the control panel will launch the workloads using the commands line which PT will provide. Python has multiple ways of executing a command line in Linux. We will work with the team to determine which method best suits our needs during the project.
- The control panel should record the elapsed time for each workload.
- The control panel will aggregate the elapsed times into a single performance metric using a formula that PT will provide.
- The control panel should upload the results of these tests to a database hosted at PT.
- The final paper should include information of the impact of the framework on the tests. This is done by running the workloads from the command line and comparing the results to those from running in the control panel.
If the project is successful, PT will make it available to the public on the BenchmarkXPRT Web site.
Project deliverables
At the end of the project, the students should deliver the source code for the project, as well as a paper summarizing their work. In addition to the three presentations at NCSU, the students should give a presentation on their work at PT.
As with past projects, PT will make a video about the project. Students have the option of appearing in the video, but this is not required.
Stretch Goal
Incorporate a new machine learning workload into the framework. This comprises finding a freely available workload, deciding on the parameters to use, training it, and reporting its results. Note that, once the parameters are decided, the control panel would allow the training to be automated.
Who we are
The BenchmarkXPRT Development Community has been developing tools to measure performance for over seven years. Current offerings run on Android devices, Chromebooks, Windows-based PCs, and Web-connected devices. The XPRT benchmarks are used by major technology vendors, as well as by members of the technology press, such as AnandTech, CNET, and Tom's Hardware.
The BenchmarkXPRT Development Community is administered by Principled Technologies, a world leader in technology assessment and fact-based marketing.
Students will be required to sign over IP to Principled Technologies when the team is formed, and sign an NDA.
Database as a Service (DBaaS)
SAS believes in the power of analytics to drive innovation, education, and diversity. We produce the analytics software that lets companies offer same-day delivery by ensuring they have the most efficient supply chain, helps identify and prevent fraud, aids schools in identifying at-risk students early, and more.
Database Services is small team within SAS dedicated to maintaining infrastructure that drives mission critical business processes. We support databases on the MongoDB, MySQL, Oracle, PosgreSQL, and SQLServer platforms, totaling over 2,500 actively managed databases.
Database as a Service
Database as a Service (DBaaS) refers to the automated orchestration, configuration, and management of database platforms. A DBaaS provider is responsible for managing all parts of a database deployment for the entirety of the database lifecycle, from provisioning to decommissioning. There are four distinct lifecycle phases that a DBaaS system must handle.
Orchestration – The orchestration phase is responsible for collecting and preparing required infrastructure, either physical or virtual. Infrastructure often includes compute resources, such as a virtual machine or space on a container cluster; storage resources for data, backups, and passwords; networking resources; etc.
Configuration – Once infrastructure is available, it must be configured for use. Configuration requires installing and securing database software, escrowing passwords and certificates, enabling a backup policy, and more.
Management – Management is the longest portion of the database lifecycle. It is a catch-all phase that contains all tasks needed to maintain a database or respond to customer requests prior to decommissioning. Some common maintenance tasks are creating or restoring from backups, creating users, granting user permissions, and changing passwords.
Decommissioning – Decommissioning is the final stage of the database lifecycle and requires performing a final full backup before releasing all infrastructure resources.
Many cloud platforms already have DBaaS offerings, like AWS RDS or OpenStack Trove. However, they often only support a restricted list of database platforms and, once created, leave instance management to the end user.
High Level Requirements
The senior design team will develop a suite of microservices in Python that leverage modern DevOps tools to provide database services in a platform-agnostic and cloud-agnostic manner. Services must be fronted with a REST API for use by end users. Services must not require DBA intervention to perform normal or expected tasks.
Possible actions include deploying a new database server, creating a new database or schema on an existing server, creating users, changing user permissions and passwords, and removal/decommissioning of any of the above.
Preferred Student Interests
- Database Platforms.
- Infrastructure orchestration and configuration management tools.
- Message queues.
- Container management.
Non-Functional Requirements
The system shall be fault-tolerant and shall be upgradable without requiring an outage. It must ensure that actions are authorized, auditable, and generate needed documentation to comply with corporate policy. It must also comply with SAS programming, architecture, and security guidelines.
Approach
Phase I – Framework Design/Implementation
The goal of Phase I is to implement a service architecture that supports plugging in new database infrastructure providers, where a provider is a microservice for configuring an RDBMS system like MySQL or talking to an infrastructure platform like AWS. This framework should be extensible, and may integrate service discovery technologies like HashiCorp Consul. The architecture in this phase is primarily motivated by the following story.
As a database administrator, I want to add support for a new database platform.
Phase II – Database Integration
The goal of Phase II is to implement microservices needed to support creating a new MySQL database on a cloud provider like AWS or OpenStack. Services should support full orchestration and configuration of database resources and be capable of decommissioning databases. Phase II is primarily motivated by the following story.
As a user, I want to create a new database.
Resilient Map Service
Founded in Roanoke, VA in 1932, Advance Auto Parts (AAP) is a leading automotive aftermarket parts provider that serves both professional installer and do-it-yourself customers. Our family of companies operate more than 5,100 stores across the United States, Canada, Puerto Rico and the Virgin Islands under four brands, Advance Auto Parts, Carquest Auto Parts, WORLDPAC and Autopart International. Adapting the latest in data and computer science technology, Advance Auto Parts' Center for Insight and Analytics aims to bring machine learning and artificial intelligence to the automotive aftermarket parts market to turbo drive it forward into the digital era.
Project Overview
With over 5000 stores, millions of customers, and a massive nation-wide logistics network, geospatial information is key to Advance Auto Parts team members making good business decisions. Questions such as the following need to be answered by various AAP team members and all have significant ties to geospatial data:
- When can I promise a part to a customer based on the current location/route of the restocking truck?
- Where are my current customers located and how can I most efficiently plan trips to visit them?
- Where are my competitors located and are there customers that I should give extra attention because they are close to a competitor’s store (or via other overlays/projections of competition intensity)?
To address these issues, we propose a project along the lines of a simple, well-designed and implemented Progressive Web App (PWA) for viewing maps with multiple custom data layers (e.g. professional customer locations, tracking store-hub/distribution center shuttles, and heat maps of competition intensity) on both desktop and iOS platforms. Such a capability would provide significant value to our sales force, both in-store and mobile. The primary users would be store General Managers, and Customer Account Managers who handle the relationships with our professional (B2B) customers.
Finally, just as our team members are committed to taking care of our customers even in tough circumstances, this project will need to be robust enough to continue to operate in periods of limited internet connectivity. Therefore, taking advantage of the offline capabilities of PWAs is a must.
Project Scope
Progressive Web App
The primary user interface for this project should be in the form of a Progressive Web App that will support both desktop and iOS users. The interface should not be overly complicated and should focus on the primary user tasks of:
- Viewing, moving, zooming maps.
- Browsing, creating, applying, filtering, and removing map data layers.
- A user should be able to see all layers they have created as well as those that have been shared with all users.
For simplicity, this app should leverage the Google Maps API.
Additionally, the app should take full advantage of PWA features that allow for robust offline/limited-connectivity operation such as caching map tiles and data layers.
Backend Services
This project will also require backend services to handle user authentication, account administration, and the storage, sharing, and serving of user-created data layers. These requirements can be summarized as:
- Account Administration
- Allow users to:
- Create an account using their AAP email address
- Allow administrators to:
- View, edit, promote (to administrator), and remove user accounts
- User Authentication
- Allow users to:
- Log in
- Note: we are very happy for the students to explore taking full advantage of the various alternative authentication mechanisms available on the mobile platform(s) such as touch-id, face-id, etc. as they have time/interest.
- Make authenticated calls to map API
- Access available data layers (those they created and those that have been shared with all users)
- Handle map layers
- Serve requested layers to authenticated users
- Validate user-submitted layers (ensure that they are not malformed)
- Convert (if necessary), layers submitted as CSVs into the required format (KML, geoJSON)
- Store user-submitted layers
Students will be required to sign Non-Disclosure Agreements and to sign over IP to Sponsor when team is formed. Reasonable costs associated with the project (Cloud provider and API fees) will be covered by the Sponsor.
Self-service Automation of Vulnerability Scanning Portal for Internal IT associates
Company Background
BB&T Corporation, headquartered in Winston-Salem, North Carolina, and its subsidiaries offer full-service commercial and retail banking and additional financial services such as insurance, investments, retail brokerage, corporate finance, payment services, international banking, leasing and trust. BB&T Corporation is an S&P 500 Company listed on the New York Stock Exchange under the trade symbol BBT. More information about BB&T can be obtained at www.bbt.com.
BB&T has been enhancing its cyber security program and would like NC State students to help BB&T build a Web application that enables BB&T IT associates to utilize a self-service portal for requesting vulnerability scanning of new computer systems.
Project Description
The desired self-service vulnerability scanning portal for internal IT associates will enable automation of a largely manual process that currently requires extensive staff time and resources to complete. The automated process will consist of the following tasks:
- Automatically retrieve and assess tasks from our ServiceNow work assignment queue
- Validate task details (IP, DNS, etc.) for the server(s) being scanned
- Determine the appropriate scanning appliance by searching previous vulnerability scan data
- Submit change management documentation to perform an authentication scan of the target system(s)
- Configure and perform an authentication scan to ensure appropriate service account credentials are configured on the target system(s)
- Notify the requester if service account credentials are not appropriately configured
- Submit change management documentation to perform the vulnerability scan
- Configure, schedule and run the vulnerability scan
- Automatically download the corresponding vulnerability report and manually manipulate the data to create the desired format
- Send modified data to the requester with instructions for remediation
- Rescan the systems after vulnerabilities have been remediated
- Close the scan tasks in our ServiceNow task queue
This Intranet/Web based application will implement automation through an API interface to ensure an enhanced user experience for IT associates, quick feedback to the requesting associate, and support of an agile server build framework.
Desired Outcomes
This independent project will provide BB&T associates with an enhanced user experience while ensuring the security of critical infrastructure and supporting an enhanced agile server build process.
- Intranet/Web based interface for self-service vulnerability scans requests of newly build servers. (see the steps in the process tasks above)
- Parse/Interact with API data from Qualys, BB&T’s vulnerability scanning solution, and ServiceNow, our enterprise ticketing and vulnerability tracking system.
- End-user friendly vulnerability output reports delivered directly to the requestor without manual Corporate Information Security intervention.
Platform Requests
- The front end web interface can be developed securely using technologies of the students choosing
- Backend data will be stored securely using SQL Lite or similar database technologies
- Other technologies utilized in this process will be agreed upon with both BB&T and NC State students
- API scripting will utilize primarily Python
Automated Validation of OpenAPI Documents
Who We Are
PC Core Technology (PCCT) is a technology team in Raleigh, NC that’s part of Schwab Technology Services in Charles Schwab. They build comprehensive technology offerings for end investors and for financial advisors to help them manage their business and their client’s investments. This team develops applications for desktop, web, and mobile platforms that provide industrial strength solutions using technologies and frameworks such as C#, Mongo, SQL, C++, HTML5, Angular.JS, JSON, and REST. They concentrate on the fundamentals of architecture, design, development, and quality assurance to build applications that stand the test of time which is critical in the financial industry.
What We Are Looking for In the 2018 Fall Project
Charles Schwab is offering the students an opportunity to contribute to our Continuous Integration (CI) pipeline by building an automated process for validating OpenAPI documents against our standards. This effort may consist of a few different channels:
-
Developing a utility to generate a Swagger document from a Confluence page or HTML document;
-
Developing a utility to validate the contract conforms to the PCCT standards set for REST based services;
-
Developing a utility to confirm the coded API matches the Swagger document.
Automated Validation of OpenAPI Documents
With over a dozen PC Core Agile teams developing shared services to be consumed by multiple business channels across Charles Schwab it is imperative that the teams follow the best practices for service contracts defined by our local and enterprise architects. A service contract is a document that specifies the service being provided. This can include the functionality offered, data provided, errors returned and expected response time, to name a few. The senior design team will develop utilities that will integrate into our Continuous Integration pipeline, built with PowerShell upon the Atlassian stack, to validate that a service contract conforms to the spec defined in Swagger document. The REST web service API contract will be defined in an HTML page hosted internally.
Standards Template
The senior design team will review current service contracts and standards from our PCCT’s Confluence site to propose a template for service contracts. In turn, this template will be used by the team to transform HTML pages to YAML. PCCT will verify and review the template proposed by the team.
Automated Validation
The senior design team will develop a utility that will generate the YAML document using the contract defined in the HTML page based on the standard template. The code should be dynamic to allow integration of future standards as our needs and technologies change. It should also be flexible enough to be integrated into any Continuous Integration (CI) pipeline regardless of the technology stack used. In addition to the validation of the HTML document, the utility should be able to compare a Swagger document stored in a code repository against the code for the actual service. This will allow PCCT to ensure the actual service adheres to the standards.
Project Approach and Technology
The project will be based on some of the technologies Charles Schwab has been using for product development. This list may be altered depending on the teams’ existing technology strengths. Technologies may include:
- C#, JavaScript, PowerShell and/or HTML5
- REST for web services, if required
Charles Schwab strives to develop using best practices while remaining agile. We use the SCRUM and Kanban methodologies and will run the senior project within a similar methodology used by our teams. One mentor will be selected from our development team to be the primary interface with the project team, but other members of our staff will be brought in from time to time to assist with the project.
Project Success
Success will be based on the following accomplishments:
- Participating using a SCRUM methodology to understand the benefits of agile development.
- Developing requirements (epics and user stories) based on the information provided by PCCT. The team will successfully groom the user stories to provide initial estimates.
- Breaking down the user stories into logical tasks and providing task estimation. This will be used to prioritize features within the semester’s time box.
- Architectural and design documentation produced for data and user interface components. A variety of UML and whiteboarding documentation will be used.
- Producing quality code (well organized, performant, documented)
- Developing a test strategy for unit, component, and overall quality assurance.
- Working application based on the initial requirements and negotiated prioritization completed and demonstrated to internal Charles Schwab staff.
Students will be required to sign over IP to Sponsor when team is formed.
Vehicle Network Solution for EcoPRT, a low-cost automated transit solution
Background
Personal rapid transit (PRT) is a maturing technology that could offer an alternative to traditional transit systems like bus and rail. EcoPRT (economical PRT) is an ultra-light-weight and low-cost transit system with autonomous vehicles that carry one or two passengers at a time. The system has dedicated guideways where the vehicles are routed directly to their destination without stops. The advantages include:
- Dual mode – existing roadways and pathways can be used for low install cost in addition to elevated roadways at a cost of $1million per mile
- A transit system that is much quicker and less costly than either bus and light rail
- A smaller overall footprint and less impact on the surrounding environment so guideway can go almost anywhere.
The research endeavor, ecoPRT, is investigating the use of small, ultra-light-weight, automated vehicles as a low-cost, energy-efficient system for moving people around a city. To date, a full-sized prototype vehicle and associated test track have been built. For a demonstration project, we are aiming to run a fleet of 5 or more vehicles on a section of Centennial Campus. The Vehicle Network server will serve as the centralized communications and vehicle routing solution for all the vehicles.
This Semester's Project
With the aim of running a multi-vehicle live pilot test on Centennial Campus, the overarching goal is to create a Vehicle Network Controller (VNC) to guide the vehicles and provide interaction to users. On the user side, the user clients interact with a user server that shares the same database. The user server should provide a tiered security access where nominal users would be allowed to select destinations and view their vehicle on a map, but administrative users could see key vehicle and network statistics.
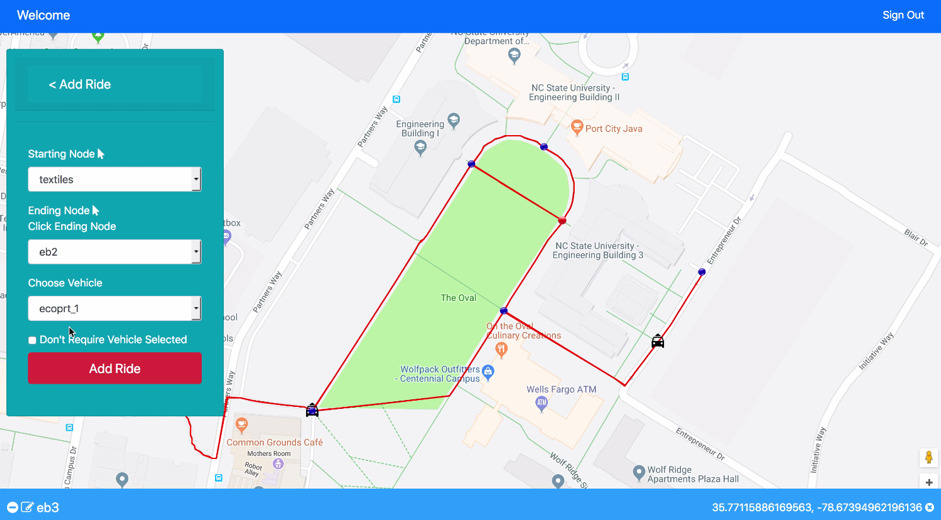
There is a need to build out the user client and user server architecture, along with demonstrating VNC with multiple (simulated) vehicles attached to it. Last semester, a CSC senior design team with the help of graduate research students put together the first draft of the system. The user server was built on Node.js, and a MongoDB database was implemented to talk both to the user server and vehicle server. The vehicle server can successfully query the vehicle state and send routing commands. The user server allows an administrative user to access vehicles, routes, and maps. The first draft also included the ability to manually setup routes and to visualize vehicle navigation. As next steps, the effort will include further development of the user interface including additional features such as:
- Interfacing with multiple vehicles
- Creating tiered user privileges
- Evaluating and identifying features needed for an improved user experience
- Saving and recalling network routes
- Operating system with live vehicles
Architecturally, the existing software solution needs to be reviewed and possibly modified for scalability.
Project Team Specification
Current Technologies
- Node.js
- MongoDB
- C/C++
Desired Competencies
- Server/client programming experience
- Server architecture experience
- User Experience Design
- Interest in Autonomous Vehicles/Technologies is preferred.
Knowledge Is Power
Company Background
Lexis Nexis is a leading global provider of legal, regulatory and business information and analytics that help professional customers make more informed decisions, increase productivity and serve their clients better. This project involves LexisNexis InterAction, which is the industry’s leading customer relationship management solution. Our legal CRM software is designed to powerfully meet the law firm’s unique needs.
Project Background
Knowledge is power. News is not.
Sally is a powerful partner of a nationally relevant law firm. She heads a practice group prominent for their work in high-profile issues in food, product and chemical safety. Her day begins very early with a workout before heading into the office, stopping at 6 pm for dinner and family, and tries to get in a half-hour of reading before truly ending the day.
She does not have much time for general news channels, where less than 0.1% of articles are relevant. One downside of general news reporting is its time-backward perspective: the reporting starts with the filing of a court case when the attorneys have already been selected.
Time-forward knowledge is relevant to Sally. She wants to know trends, innovations, and risks in her and her clients’ spaces. Her reading focuses on weekly professional journals and news summaries where 50% of the articles are seemingly relevant (think about equivalents to ACM’s XRDS).
Sally has her approach to efficiently consume journals and news. She discards obviously irrelevant sections and scans the remaining articles’ first paragraphs to select the ones she will read in full. Still, she finds herself skipping out of 80% of the articles.
To respect her valuable time, we introduce PowerKnowledge. PowerKnowledge takes a large feed of multiple sources of business and industry news and pinpoints the 3 articles that Sally should read that day. It uses knowledge of her current interests, what it has already pinpointed within the last month, and feedback from her. Her current interests could be based on industry, product category, manufacturer, and simply cases she feels excited to work on.
PowerKnowledge turns news into knowledge. And knowledge is power.
For this project:
Sally will interact with a Natural Language Processing/Machine Learning (NLP/ML) system thru a simple UI. NLP handles the textual nature of the data that is the news articles. ML generates a highly personalized selection of the most relevant new articles. Sally’s feedback should be folded back into the model using semi-supervised or supervised training to improve its performance and follow her changes in relevance judgements.
We will simulate the professional journal with open-source or free business news. Live feed is preferred but it not the primary objective. A semi-weekly pull and cache is fine.
3 business news articles should be presented to the user. It uses knowledge of her current interests, what it has already pinpointed within the last month, and feedback from her. Interests are based on industry, company, and topic.
Be mindful that this problem is different from the online shopping recommendation engine. Two seemingly similar users being presented with very different news articles is expected given the high degree individualization of PowerKnowledge. Knowing some extra relevant nugget of news gives Sally’s law firm and practice group accidental competitive edge.
Data Sources
The data sources are wide-open. Some exploratory data sets and analyses for a quick start into the ML and NLP aspects are:
- https://archive.ics.uci.edu/ml/datasets/News+Aggregator (see https://www.kaggle.com/uciml/news-aggregator-dataset/home for some pre-analysis)
- https://ahmedbesbes.com/how-to-mine-newsfeed-data-and-extract-interactive-insights-in-python.html (focus on the analysis steps, and adapt the newsapi.org datasource to this project)
Ultimately, for the demo, here are some RSS feeds:
- http://feeds.reuters.com/reuters/businessNews (more listed at https://www.reuters.com/tools/rss)
- https://www.businesswire.com/portal/site/home/rss/ (requires free registration but is highly segmented hence good for testing)
- http://rss.cnn.com/rss/money_latest.rss (more listed at https://money.cnn.com/services/rss/)
Technology
The technology choice is reasonably wide open. A good list of options can be generated from the survey at https://www.kdnuggets.com/2018/05/poll-tools-analytics-data-science-machine-learning-results.html
Python, Scala, and Java are production-ready languages with production-ready open-source toolkits, frameworks, and libraries. If you have seen them, Jupyter notebooks are good for explorations. The one requirement is that programming language is readable to LexisNexis (hence assembler and Lisp are excluded ... sorry hard-core geeks).
Critical Application and Asset Management Program
Company Background
Merck’s business focuses on innovation and scientific excellence to deliver vaccines, medicines, and animal health products that can help millions around the world.
Quick Description
Every Company has computing applications and assets that are critical to their operation. These applications and assets range from basic applications that provide Identity and Access Management capability to machines on the shop floor that produce the products the company needs to sell. The fact that these assets are extremely important forces companies to manage them more closely.
Goal
Build a web-based application that can support the management of our critical applications and assets at Merck. Technologies, tools, and languages for this project are open-ended and may be suggested by the senior design team to be approved by the sponsor.
Some basic functions of the program:
- Maintain a list of applications and assets
- Applications and assets should be editable and up to date (actively managed)
- Information is displayed such that people can easily interact with the data
- Applications are made up of assets, so there is a parent-child relationship
- Track and manage statuses for these applications and assets
- Is the application or asset being actively monitored?
- Can the application or asset be monitored?
- Is the application or asset protected by security controls? If so, which security controls?
- etc.
- Queue activity around these applications and assets
- Onboarding new applications or assets
- Offboarding old applications or assets
- Change
- Management Dashboards & Reports
- Asset Summary Report by application
- Summary Report of Assets out of Compliance
- Detail report of assets out of compliance
- Application health dashboard
Happy or Sad? NPS Sentiment Analysis for Pendo.io
Company Background
Pendo is a product experience platform that helps product teams deliver software users love.
Pendo provides insights from product usage patterns and user sentiment for making better product decisions. From these same insights, you can easily set up in-app messages, guides and walkthroughs to help users get the most value from your products.
Pendo was listed in LinkedIn's Top 50 Startups in 2017.
Problem Background
Cloud software companies and businesses of all types are increasingly relying on the Net Promoter Scores (NPS) as a key indicator of their customer satisfaction and growth potential. Yet many companies are still trying to figure out the best way to capture a reliable NPS measurement, and most importantly what to do once they have that measurement.
The NPS methodology recommends an open-ended follow-up to the specific numerical score. Organizations are encouraged to connect directly with customers who have provided a score to better understand and address their specific feedback. In this way, NPS, rather than just a stand-alone measurement becomes directly actionable as a tool to improve the customer experience. Here are a few examples of text responses (and their numerical score):
- “Pendo specializes in allowing pms to connect with their users.” (10)
- “i haven't looked for them... but are there resources re: best practices? for feature tagging, how to make page funnels, etc etc.” (7)
- “I find the documentation very frustrating.” (6)
On average, 16% of users respond to an NPS survey, and of those responders, about 30% give text responses. While numerical data is simple and straightforward to synthesize and, therefore, visualize, textual responses must be analyzed individually. With a large data set, analyzing text responses becomes difficult and time-consuming. We would like to give the Product Managers we serve a useful visualization of their textual NPS data.
Project Description
As a Product Manager and Pendo customer, I would like the ability to visualize textual NPS responses in a way that is easy to digest.
Acceptance Criteria
By navigating to a web page, I can see the following visual representations of NPS textual data (sentiments):
- whether the overall sentiment of the textual responses included in the given data set is positive or negative: color gradient between red (negative) and green (positive) in some type of widget (for example, a circle with the average value whose background color represents the gradient)
- a visual comparison of positive, negative, and neutral sentiments: pie chart
- the most used phrases for each positive and negative sentiments: circle packing with circle colors that represent positive, negative, and neutral
- Sentiment analysis over time: line chart or bar graph by day/week (whichever time bucket makes the chart most readable)
- Sentiment analysis by role: use any pie chart alternative (for example: waffle chart)
Visualization stretch goals:
- Data explorable from the visualizations above
- Any visualizations listed above can be limited to a specific date range
- Any other visualizations that represent the same data as the minimal list above
- Any other visualizations that incorporate additional metadata
Other requirements
- Links to user and developer documentation
- Sentiment analysis is retrievable via an API
Visualization examples: https://www.pendo.io/product/nps/
Data Set
- The web application must consume the data set that we provide (for example, through a file upload or an API endpoint where the payload is the data set)
- This data set will be in JSON format
- It may include fields other than the number and text (ex: role)
Technologies
Though the specific technologies used is left up to the team, we require the following base stack:
- Node
- ES6 JavaScript
- Modern UI Framework (such as Vue, React, Angular, etc)
- Git
Text Analysis
Project should leverage a third party library for sentiment analysis. For example:
Student Experience
The NCSU senior design team at Pendo consists of 5 engineers, including backend and frontend developers, as well as a data scientist.
How often will we meet? Weekly
- Every other week - demo and planning
- Opposite weeks - office hours (onsite or via teleconference)
Where? Teleconference or onsite at Pendo in downtown Raleigh
Contact? Access to team via slack
The project acceptance criteria represents baseline requirements. Feel free to go above and beyond. Also, feel free to pitch ideas for visualizations other than those we listed as minimal.
Students will be required to sign over IP to Sponsor when team is formed.
AR to Explore and Understand Dynamic Macromolecular Structures
Background
Wake Technical Community College is the largest community college in North Carolina, with annual enrollments exceeding 70,000 students. The pre-nursing program in the Life Sciences Department runs a two-course series on Anatomy and Physiology, where this project will be piloted, with enrollments exceeding 800 students annually. Additionally, this project is expected to assist over 1,000 biology students when fully implemented.
Pre-Nursing students need to understand how the body carries and regulates oxygen transfer in the blood. Hemoglobin is a huge protein found inside red blood cells and its primary function is to carry oxygen and carbon dioxide to and from cells of the body, respectively. Structures inside hemoglobin bind to oxygen dynamically at the lungs and then release the oxygen at metabolically active tissues. Several conditions in the blood will cause hemoglobin to change shape: Decreasing pH, increasing temperature, and the presence of carbon monoxide result in the release of oxygen. Conversely, increasing pH and decreasing temperature result in higher affinity/binding of oxygen and the transport of oxygen in red blood cells.
Primary Problem
Proteins are complex macromolecules that bring about many changes in the body. The structure of a protein dictates its function—when the structure changes, the function changes as a result. Understanding how structural changes are triggered and the resulting dynamics of protein structure is a complex topic to understand and to teach, especially at the community college level. Current methods to view even basic protein structure are accessible only to seasoned researchers, requiring specialized knowledge to navigate the visualization interfaces despite them being freely-available. This project will provide a natural, 3D augmented reality (AR) experience allowing students to control environmental influences and view the resulting structural changes in macromolecules, with the ultimate goal of providing a classroom tool for students at Wake Tech Community College.
Case Study
Because there are tens of thousands of macromolecules and varying amounts of knowledge exist about them, this project will focus on one macromolecule important for pre-nursing students to understand and for which a lot of knowledge exists: a protein called hemoglobin.
Technology and Technical Requirements
- Must parse hemoglobin’s macromolecular structure from existing standard CIF formats and display it in 3D inside AR application
- Must be extensible to support loading other proteins in the future.
- Must parse dynamics rules (format to be specified by team) that explain how environmental factors like heat and oxygen affect a specific macromolecule’s shape, as specified by a subject matter expert, and enable visualization of those changes inside the AR application
- Must allow manipulation of environmental factors by moving objects with QR codes through the world, and provide intuitive visualization of those objects and their effects on dynamics (e.g., a burning flame for heat). For example, when the AR app detects the QR code for heat, a flame could appear over the QR code and the macromolecule’s shape would change accordingly.
- Must provide visual cues to draw a user’s attention to the parts of the macromolecule that are important given the current dynamics, and allow pausing the dynamics until certain important parts of the structure specified by the subject matter experts are in view
- Must be cross-platform (iOS and Android), preferably via a web application; specific choice of tools will be led by the team and selected in concert with sponsors/advisors
Students will be required to grant royalty-free use of IP to Sponsor when the team is formed.
Project Archives
| 2026 | Spring | Fall | |
| 2025 | Spring | Fall | |
| 2024 | Spring | Fall | |
| 2023 | Spring | Fall | |
| 2022 | Spring | Fall | |
| 2021 | Spring | Fall | |
| 2020 | Spring | Fall | |
| 2019 | Spring | Fall | |
| 2018 | Spring | Fall | |
| 2017 | Spring | Fall | |
| 2016 | Spring | Fall | |
| 2015 | Spring | Fall | |
| 2014 | Spring | Fall | |
| 2013 | Spring | Fall | |
| 2012 | Spring | Fall | |
| 2011 | Spring | Fall | |
| 2010 | Spring | Fall | |
| 2009 | Spring | Fall | |
| 2008 | Spring | Fall | |
| 2007 | Spring | Fall | Summer |
| 2006 | Spring | Fall | |
| 2005 | Spring | Fall | |
| 2004 | Spring | Fall | Summer |
| 2003 | Spring | Fall | |
| 2002 | Spring | Fall | |
| 2001 | Spring | Fall |