Projects – Spring 2016
Click on a project to read its description.
Video games are at an interesting crossroads between becoming an increasingly public activity and a perfectly immersive, private one. We want to create a game that forces communication between two players, outside of the computer. We were inspired by games like Keep Talking And Nobody Explodes , and Space Team which rely on such communication between the players. Each player has either the information about a problem, or the ability to act on it, but never both. The game will also be accessible to people who are not hardcore gamers (as it will not be strictly console based), but will be more thrilling and engaging than casual games.
Games of this new unnamed genre are creating a subdivision of the gaming universe. The type of person who plays Keep Talking is not the same as the hardcore, competitive gamer that would play League of Legends or Call of Duty. They are also distinct from the "purely casual" type of gamer that plays Candy Crush or Angry Birds. These social PC games are a new frontier that will create completely unique experiences from anything we've seen thus far. Rather than emphasizing and subsequently rewarding any individual player for their skill, these games create a cooperative bond between two players whose only path to success lies in efficient, tactical communication.
Our game in particular will provide entertainment to an underserved and growing market of people who want a more involved gaming experience in a social, cooperative environment. Our main focus, therefore, will be tailoring the game to the needs of such players. We want to fill the social void in modern gaming while creating something incredibly unique and fun to play.
Common Healthcare Platform: Provider App for Mobile
Opportunity
In today's medical practices, Doctors typically must make decisions without the ability to quickly reference necessary information, because information is either not available, or is available only in non-mobile legacy solutions not designed for quick information retrieval. This project will focus on one specific use case, prescribing drugs and labs for patients. Doctors have shared that they prescribe drugs or labs without knowing the copay that the patient must pay. Once the patient reaches the pharmacy, they call the doctor wanting another prescription -because the prescription is more expensive than they realized, or is not covered by their specific plan.
Solution
Doctors need a simple app that lets them see what the patient's health insurance plan will require the patient to pay. This app needs to be available on a mobile device so the doctor has immediate and constant access to it. (Note: there are web based tools available but they require a laptop, and a lengthy log in /navigation to reach the information required.)
The student team will need to create a database that will contain what we call obfuscated data or non-identifiable data. This is realistic data that looks like the actual data used by BCBS, but is not attributable to any known person. This is required by HIPAA law which governs how protected health information (PHI) is used and protected. Students will be provided with a dataset of realistic non PHI data that can be used to populate the database.
So for this project, students will develop a working mobile prototype app as follows:
- Empowers a role (Doctors and medical staff) with easy access to key data.
- Make use of leading low cost or open source technologies
- The app will be designed for daily usage by doctors and medical staff.
- The app will demonstrate the ability to access and display medical data, as follows:
- Allow a doctor to look up a patient's name, and display the health insurance membership information to verify that patient's coverage.
- Allow doctor to then lookup a drug prescription or lab procedure. In response the app will display the drug or lab, and the copay the patient will pay. This will allow medical staff prescribe a drug that is affordable for the patient's needs.
- As a stretch goal, other functionality may be included as agreeable to BCBSNC and the students.
- This prototype will not contain PHI, but will use realistic dummy data that has the same characteristics as standard health information but will not be attributable to any individual. BCBSNC will provide realistic dummy data sets as needed and/or guide the students in creating them.
- Would prefer that students work on a weekly cadence. If possible we would like the prototype app to be reviewed/used by medical staff as early as possible, so that the students have the benefit of feedback from actual pilot users, and can refine the app further. BCBSNC will introduce students or otherwise make arrangements to ensure that medical professionals are able to review this app as it is developed.
Key Takeaways Expected/Questions to answer
- What functionality will be most compelling and used most regularly by doctors and medical staff?
- What are the mobile design standards for designing a secure, HIPAA compliant but compelling mobile healthcare experience?
- What set of technology capabilities are needed to enable this mobile healthcare experience?
- How does this change/improve the user experience of patients and doctors? BCBSNC is interested in comparing/validating whether or not this app truly improves the doctor/patient experience so much that it really can be a high usage app/platform on which we could introduce additional functionality to drive health quality outcomes.
Platform
Sponsor is open to leveraging the skillsets of the student team. If the team has had previous experience doing an iOS or Android app, and feel they could make it happen in the available time, sponsor is open to that. Also, Cordova/js, HTML5, Bootstrap kind of approaches could also work well.
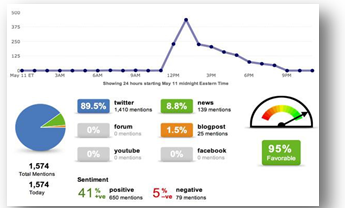
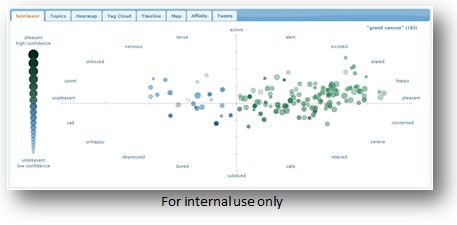
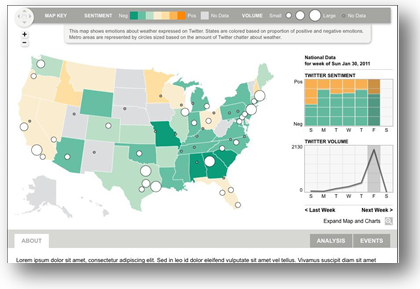
How well do you really know what's going on in a global company? If you follow the news from one publication, do you miss out on a tweet alerting you to a potential problem? What about the press release you just put out, how is that affecting the employees in the 2nd largest office? Determining what information is relevant and useful for companies is becoming critical for internal awareness. A solution to share that internally can improve the company's position on multiple fronts.
The Assignment:
We are looking for a group of dynamic students who can create a user-centric tool to help organize and view sentiment about our company in a rich and engaging way. Deutsche Bank can provide some representative data from our internal social network ( Jive ) that would be one of the data sources.. The others include Twitter and various news feeds from around the world. Students will use their course knowledge, ideas and technical expertise to create a dynamic solution that will lead to a better understanding of the big picture. For example, some of the questions that this interface could help answer are: "What is the latest external news about DB (social media etc.)? What is the latest internal news about DB (good or bad) in a quick and easy way to digest? Are there any important topics, trends happening in DB that everyone is talking about? What are the quarterly earnings for DB at a glance?"
This Semester (Spring 2016):
This semester the goal is to deploy a working version of the product in Deutsche Bank. The goal is to see the hottest topics and the mood surrounding the bank in an engaging way, which will be presented to our internal employees across the globe. Our team is here to aid and guide the students' workflow processes and design ideas. We are open to the students' input and new ideas or technologies that fit within a few technical limitations that the bank has. As far as front-end code, we recommend using openStyle, our front-end UI toolkit, which is based on Bootstrap.
NCSU Student Experience:
Senior Design students in the College of Engineering Department of Computer Science will have a unique opportunity to partner together over the course of the semester to create an information tool, as they would experience in real world product development. Additionally, students will have access to industry professionals to assist in the design, Agile/Scrum practices, and the overall developing/coding and testing.
Creation of Diagram Production Documentation
Fujitsu America is one of the top three suppliers of retail systems and services worldwide. Using Microsoft's .NET development platform, these systems offer a high performance yet open platform that retailers as diverse as Nordstrom, RadioShack and Dressbarn are able to customize.
Fujitsu's next generation POS, Market Place, has been released and Fujitsu is looking at ways to leverage its architecture to enable the creation of diagram production documentation and potentially, performance reporting.
Background
MarketPlace Store Application Design
Fujitsu's MarketPlace is a SOAP web service based product. Each use case implemented by the applications within the product requires collaboration between multiple web services. During the design phase for Market Place UML sequence diagrams were used extensively to document the messaging required between the services. This helped to define the service interface operations and parameters, as well as prioritize the development of the services.
However, over time as development proceeded and the service pattern became familiar, these diagrams stopped being maintained and fell into disuse. Now that we are entering engagements in which customer development teams may be involved, the utility of these diagrams for in ongoing documentation appears high. However, the system now has more than 450 service operations distributed across more than 230 service interfaces implemented by more than 120 services, and the task of creating diagrams, much less maintaining them, is daunting. The effort is only viable if it can be highly automated, and this automation is the focus of this project.
Project Data for Automation of Diagram Production
Two factors make automation of diagram production possible: an XML standard for the diagrams and detailed tracing that effectively documents the sequences. XML Metadata Interchange (XMI) is a public standard for representing UML diagrams and is generally supported by most modeling tools. Two variants of the standard (1.x and 2.x) are in general use in the industry. Each tool vendor can in turn extend the XMI specification to capture details specific to that vendor. The target vendor tool for this effort is Enterprise Architect.
For tracing, MarketPlace has utilized extensibility points with the web service infrastructure of Microsoft's WCF and extensibility features SOAP. The MarketPlace infrastructure assigns each SOAP message a unique identifier at the message's point of origin. This identifier is then carried as a SOAP header throughout any subsequent service interactions for the lifetime of the message. MarketPlace also provides interceptors within the WCF SOAP infrastructure that have access to the SOAP envelope. These interceptors format information including the service interface and method along with the unique identifier and publish the result to the .NET tracing infrastructure. Configurable TraceListeners can then pick up the data and log it in a variety of ways for subsequent use. As a side effect the interceptors provide high resolution timing information about the duration of a service operation.
Project Primary and Stretch Goals
The primary goal of the project in its simplest form is to reformat the trace data into a UML sequence diagrams that can in turn be graphically displayed by EnterpriseArchitect (using the Microsoft Toolset and .NET development platform).
The student team will be involved mostly in data processing, analysis, and visualization. Fujitsu America has already built the tracing into the system although it will be slightly extending for this project. Sponsors plan to provide the traced data and/or a system by which more can be collected.
Data management is a key factor as well. The traces themselves may be large and contain repeating sequences. Ideally only unique sequences produce diagrams. Current tracing data may be inadequate and new data elements may be required to achieve the goal. Where repeating sequences occur, it may be useful to collect statistical results on elapse time of the operations to identify areas of performance concern. This would be a Stretch Goal.
IBM Services Asset Program: Enterprise Exception Handler (EEH)
Open Project for NCSU: Pattern Engineering Development
BACKGROUND
The Enterprise Exception Handling pattern provides a standardized method of reporting exceptions in the organization through the Enterprise Service Bus (ESB) that may be analyzed in the future. Most application and system exceptions are reported in an inconsistent manner and often reported in logs that are distributed across every node in the subsystem. The pattern addresses this concern by standardization and centralization of system-wide exceptions in a heterogeneous environment.
Community: https://www.ibm.com/developerworks/community/groups/community/asset/eeh
Repository: https://hub.jazz.net/project/arunava/eeh/overview
Documentation: 
PROJECT SCOPE
The exception handling pattern has been one of the most effective methodologies for standardizing and reporting of exceptions for Java and Message Broker flows. However, thousands of existing applications find it difficult to manually incorporate changes to enable EEH in their applications. This project will provide the ability to scan and discover existing exception handling in the Java and Message Flows and present the developer to engineer their code with EEH by mapping these to the exceptions in the catalog. The scan and discover will present the developer with the option to accept/change and then replace the code. A simple UI will be required to accomplish this. This can be done as a stand-alone SWT UI. A stretch goal could be to convert that into an eclipse plugin if time permits. The scanned data will also be persisted in an XML so that the developer(s) can do this in multiple sessions.
The replaced code suggestions will be presented with a checkbox to the Developer. That will give the option for the developer to edit the suggested code as well and accept or reject the change. This is a safety feature. Of course the developer will also be able to "Select All" and accept all changes. The sponsor will work through the different use cases with the student team -- the goal is to make the engineering of code perfected so that very little intervention will be required.
Technology knowledge required: Java, Java Script
Preferred additional optional knowledge: IBM MQ, IBM Integration Bus
Creating Automated Tests without Automation Engineers
The Software Test Engineering field is ever changing and ever increasingly important. Many companies have moved on from the days of no tests, undocumented tests and spreadsheet tests. Today's modern software companies employ new software testing methodologies and automated tools which help reduce risk while providing reliable and reusable tests. With this dramatic shift in the field, the skillsets of testing professionals has also changed to be more aligned with software developers. The position with these responsibilities that has emerged in the last decade is known the SDET (Software Development Engineer in Test), which also has provided a viable alternative career path for computer science majors who may not want to become software developers. This role now bridges the gap between manual software testers and developers as the SDET will write code (in automated test cases) that is robust, maintainable and provides direct feedback to the health of the codebase. With the gaining importance and popularity of the SDET role, we present the following project to expose the Computer Science students' concepts and tools needed for growth in Software Test Engineering:
Students who elect to participate in this project will be first asked to dive into the world of Software Test Engineering. They will learn concepts and ideas that are not limited to: importance of software testing, terminology, levels of testing [unit, integration, functional, regression and non-functional] software testing ideologies/methodologies [risk-based testing, behavior-driven development] and automated testing tools/concepts [NUnit 3.0, Selenium and Protractor].
Once the students have spent time with learning the concepts of Software Test Engineering, their project goal will be to help develop a tool to help solve the following problem:
As an organization, we have the need to test scenarios against our application repeatedly to insure that the scenario still works as designed as we introduce code changes. There are two ways to do this, either by manually testing the application or by automating the testing effort using a test automation tool.
When using the test automation tools, the user generally needs to be an expert in programming and programming best practices; though we have users that will be creating test automation whom do not have a programming background. As such, we want to build an interface and framework that abstracts the complexities of using a test automation tool from our users and allow them to interact with the test automation tool via simple actions, such as input, output, and verify.
The application under test is web based and runs in multiple environments (Development, QA, Pre-Production, and Production). The testing tool selected must be able to interact with the objects in our application and perform actions on those objects like: select values from drop down, find record in a table, input values in edit fields, et cetera.
To ensure the application is working as expected, automated test scenarios should also be created to verify newly created scenarios within the interface.
Gamification/Training Project
Summary
Ipreo is a privately held company with a market cap of over $1 billion. We make and sell software that helps drive all core processes and activities of financial markets. Thus, we refer to ourselves as a Financial Technology company, FinTech for short.
We want to "gamify" our employee training. We want an engaging simulation, a computer game, that while playing also creates a fundamental understanding of how our software is used by the myriad people in finance, be they issuers, sellers, buyers, etc.
An engaging game that takes our employees through the lifecycle of a company from the beginning, through a potential IPO, and beyond as a company continues to thrive and grow will help our employees learn how Ipreo's many software products are key to important and successful financial services and transactions. For example, two recently large and successful IPOs, Facebook and Ali Baba, ran on Ipreo software.
Background
In the world of finance you basically have four major roles or activities.
- Issuers, typically investment banks, institutions that take companies public and/or help them borrow money by issuing (corporate) bonds.
- Sellers of financial instruments (stocks, bonds, etc.).
- Buyers of financial instruments.
- Investor relations, typically performed by a corporate investor relations officer or IRO; someone at a publicly traded company who ensures people in roles described above have information necessary to look favorably upon a company's stock, to encourage the purchase of said stock at the highest possible price, and to make available to high end investors senior officers of a company (CEO, COO, CFO) to share insight into company strategy and direction.
One of the challenges we face when we hire new people is training and so-called onboarding. It's usually not difficult to find talented developers. It's much more challenging, however, to find software engineers who are also well versed in the myriad idiosyncrasies of the world of high finance. Therefore, most of the time when we hire new talent we not only have to make sure they're fully immersed in how we develop software, but also fundamentally understand the customers who use our software, how they use it, and which features are most important depending on which persona a customer represents.
Because, of course, a "customer" is not one person. A customer typically is a company that employs many people. To facilitate understanding these different people we create profiles of what a typical role requires. We call these profiles, personas. A CFO or VP will have different needs and expectations than a line manager of a department. An analyst at a bank is very different from a stock broker who is under tremendous pressure to sell, sell, sell, etc.
The better our people understand our customers and how our customers expect our software to support their work, the higher the quality our software generally is. And the higher our employees' job satisfaction tends to be. No one enjoys doing something difficult if they don't at least have some idea how the result of their hard work is used or appreciated. It's one thing for your boss to say "good job." It's another thing entirely when a customer calls you and thanks you because your software just saved them two weeks of work and major grief.
Thus, we need a good, repeatable way of training our employees, at least at a high level, about how the world of high finance works. And we need this training to be engaging, not boring, so people want to pay attention and really absorb and assimilate the information we want them to learn.
Your mission, should choose to accept it ...
We want to "gamify" our training. We want to create an engaging simulation, a computer game, that while playing it also creates a fundamental understanding of how our software is used by the myriad personas in finance. Since IPOs are things people know about and generally pay attention to, we thought taking people through the entire IPO lifecycle using a fun and engaging game would be our best option.
And by entire lifecycle we mean from two people in their basement all the way to the opening bell on the stock exchange and beyond. When you start a company and have no or few employees your financial life is still fairly simple. However, the minute you accept money from private investors such as venture capitalists (VCs), those investors expect you to share how your company is performing using artifacts and language they're used. So almost immediately you'll begin looking for tools to help you do this inexpensively but also effectively. The last thing you want is for your board to replace you because they have no confidence in your financial management skills.
And it grows and grows. Ipreo has software products that start all the way at the beginning of a company's life, and spans the entire spectrum of the needs of a company's lifecycle, including when they go public and become a large, successful publicly traded institution.
Technology
The team that begins this project does not necessarily need to use Microsoft technology to help solve our challenge. However, it should use a technology stack that is widely used. Ipreo is mostly a Microsoft shop. There are exceptions, but many of our databases run on SQL Server, a lot of our code is written in .NET, our web servers run on IIS, and so on and so forth.
For our front end, however, we're aggressively transitioning from ASP.NET to Single Page Applications (SPA) using libraries such as Angular to create a modern, engaging user interface that easily runs in any browser on any device, be it desktop, laptop, tablet or phone. We're excited about micro-services and have embraced this important concept as well.
Moreover, since this project only runs over a semester, extensibility has to be built in up front. Ideally, you create a basic framework that teams in subsequent semesters and projects can build on and enhance. In a real way, the game itself begins as a software product; initially simple ("solve the problem") but over time larger, more sophisticated with more options and features, and with multiple teams continuing to evolve it.
At the end of the day, though, the most important part is the creation of a fun, engaging game you're proud of having been a part of, and that our new employees agree helps them get up to speed faster and without having to sit through hours of boring presentations.
Team
You will not be alone in this. We will make available to you most of our knowledge and know-how. We'll help ensure you have the resources you need to be successful. And, of course, we'll appoint liaisons who will be easily available and will spend as much time with you as is necessary to make this project fun, amazing and successful.
Thank you and good luck. We can't wait to see what you'll create ... ☺
RoadMapper
Who We Are
Schwab Performance Technology (SPT) is a subsidiary of Charles Schwab that builds comprehensive technology offerings for financial advisors to help them manage their business and their client's investments. A large part of SPT's technology team is based in Raleigh, NC. This team develops applications for desktop, web, and mobile platforms that provide industrial strength solutions using technologies and frameworks such as C#, Mongo, SQL, C++, HTML5, Angular.JS, JSON, and REST. We concentrate on the fundamentals of architecture, design, development, and quality assurance to build applications that stand the test of time which is critical in the financial industry.
What SPT Gains From the Senior Project
SPT is interested in engaging with the brightest students in top tier computer science programs. New projects have allowed us to open a number of positions for recent and upcoming graduates. We hope to establish strong ties with the best students during their senior year which could then lead to jobs opportunities when they graduate.
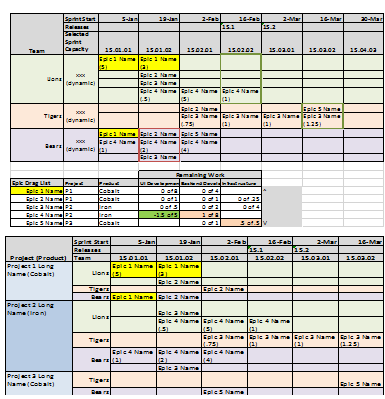
These students will build an application that will help SPT improve how the company uses agile development practices. Schwab uses SCRUM development methodologies. One of the challenges is the ability to provide a roadmap view for our business partners who require longer term planning information that is not consistent with SCRUM practices. Our development teams have created an ad hoc methodology to provide this information but it is a manual white board activity that takes significant effort to transcribe to electronic format (currently Excel) and maintain.
Project Roadmapper
Project Roadmapper was started as an NC State 2015 Fall Senior Project. That team made significant progress against the first set of requirements building the base infrastructure for Roadmapper including the ability to enter most base information and a first version of the drag and drop capabilities. The Spring 2016 project will be based on the same requirements listed below. The intent is for this team to pick up the project from its current point, enhance the visualization experience, complete the retained data, and achieve the goals of Roadmapper automatically projecting sprint assignments and providing export capabilities. The team that takes this assignment benefits from the work of the Fall 2015 team but also gain experience working on both refinement of an existing application while adding significant new functionality that will greatly improve the user experience.
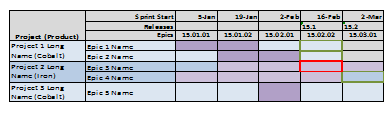
SPT is proposing a tool that allows users to create visual representations of roadmaps and team layouts for Agile projects. Most SCRUM tools focus on epics, user stories, tasks, team velocities, sizings, and backlog management. While these are all important aspects to the methodology, there is a gap between the sprint to sprint view of SCRUM and the quarterly and annual view of projects required by business and finance to plan application development and deployment. The Roadmapper application is intended to bridge this gap. The tool will allow users to create SCRUM teams with specified capacities, manage backlog epics and/or user stories, establish complexities, relationships, and development needs from specific SCRUM teams, and most importantly provide a dynamic user interface that allows a team to quickly show what is required to deliver on a loosely defined set of epics. The project will deliver a working application with the intent that Schwab will use the application for future program estimation and planning.
Functionality
Entering Base Information and SettingsAllow users to create the base information and settings required to drive Roadmapper. This will include: Sprint List Settings, Releases, Scrum Team Skills, Teams with staff and team's specific skill set, Products, Project List, and Epic Information.
Views to Assign Epics to Teams and Map to the RoadmapThe views are highly interactive and allow users to quickly build a high level roadmap.
Automatic AssignmentsHours are spent to manually populate the board. A major enhancement will be for the system to use priorities, epic information, and team information to automatically populate the board for an initial view that the users can then alter. This will include the ability automatically assign epics to teams, associate teams for epic distribution for improved velocity (e.g. team A and team B work well together so pair assignments when necessary), and provide the ability to lock "confirmed" assignments while allowing a reprioritized list to be readjusted automatically.
Export to Scrum ToolRoadmapper is not intended to be a scrum tool. Once the plan has been set, the team, epic, and assignment information should be able to export to TFS (or Jira) to speed the integration into the scrum tool for user story and task management.
Project Approach and Technology
The project will be based on some of the technologies SPT has been using for product development. This list may be altered depending on the teams' existing technology strengths. SPT technologies may include:
- C# will be used for backend development.
- REST for web services
- MongoDB for database storage
- JavaScript and HTML5 for UI Development
SPT strives to develop using best practices while remaining agile. We use the SCRUM methodology and will run the senior project within a similar methodology used by our teams. One mentor will be selected from our development team to be the primary interface with the project team, but other members of our staff will be brought in from time to time to assist with the project.
Project Success
Success will be based on the following accomplishments:
- Participating using a SCRUM methodology to understand the benefits of agile development.
- Requirements (epics and user stories) will be provided to the team by the SPT staff. The team will successfully groom the user stories to provide initial estimates.
- Breaking down the user stories into logical tasks and providing task estimation. This will be used to prioritize features within the semester's time box.
- Architectural and design documentation produced for data and user interface components. A variety of UML and white boarding documentation will be used.
- Producing quality code (well organized, performant, documented)
- Developing a test strategy for unit, component, and end to end quality assurance. Testing will likely be done manually but students can be exposed to the automated quality assurance system that SPT has in place for existing products
- Working application completed and demonstrated to internal SPT staff. The goal will be for the team to participate in customer feedback session and generate a feature request backlog.
Many NP-hard graph optimization problems can be solved with polynomial-time algorithms if the input graph is "structurally sparse," a fact that has informed significant amounts of research in theoretical computer science and structural graph theory over the last decade.
The parameterized algorithms that exploit this structure often follow a two-phase paradigm. First, the structural features of the graph are identified, frequently by computing a special decomposition of the graph. This structure is then used to guide the computations in the second phase (which often consist of dynamic programming). Unfortunately, it is often NP-hard to produce an optimal decomposition (or perfectly identify appropriate structure) in the first phase, so most practical pipelines use approximations and/or heuristics. Although a suboptimal decomposition will not affect the correctness of the solution found, it can have significant impact on the runtime of the second phase. The specific effects of variations in outputs from different first-phase constructions are not well understood (thus impeding progress on improved structure-identification methods).
This project aims to design and implement a tool to aid users in their understanding of structure-based algorithms, and specifically the way that variations in the first phase are manifested in the second phase. This tool will not implement any specific structural algorithms itself, but will instead be a general analysis engine and GUI that can interface with an arbitrary implementation of an algorithm that uses the two phase paradigm. Two such implementations of structural algorithms will be used to demonstrate the use of the tool, namely CONCUSS and INDDGO, which are implemented in Python and C++, respectively. The design team will collaborate with the Theory in Practice research group, which will provide support from the developers of both open-source pipelines mentioned above as needed.
The tool must incorporate the following components:
- An interactive graphical interface that reports changes in the decomposition caused by the changes in heuristics and allows a user to compare two runs of the algorithm.
- A set of visualizations of the graph structure which illustrate these changes
- A modular design and well-defined API which enable easy integration with additional structural algorithms in the future (which may be in one of several programming languages).
- Well-developed interface and modules for evaluating CONCUSS (including colorings and transitive fraternal augmentations), including potential identification of appropriate metrics for impact of edge addition on dynamic programming.
- Working interface with INDDGO, including proof-of-concept-level visualization and tracing modules.
At project initiation, the team will work with the Theory in Practice team to develop additional specific project requirements, and will be responsible for brainstorming to settle on a programming language and interface mechanism that will support the desired split use-cases:
- A visually engaging demo of structure-based algorithms for non-familiar audiences
- Testing and evaluation of hypotheses and/or new first-phase algorithms in an existing pipeline by knowledgeable researchers.
Building/Location Equipment Map - Managing Networks in a common location
Allied Telesis Allied View NMS (Network Monitoring System) is software solution that configures and monitors networking equipment. The NMS is primarily in use by Telecom and data service providers to manage their subscribers' home services, such as voice, video and internet access. The use of the NMS in enterprise and business settings is becoming increasingly popular. Within the business setting, the NMS is used to configure and manage data switches and routers as well as wireless access points to provide data access for employees.
There is a high demand for having a graphical representation of the location and status of network equipment. As networks grow larger and more complex, a clear map that shows the location of devices and their current state (whether they are in need of software upgrades or having any problems) is critical to maintaining smooth operations.
More and more network monitoring applications have incorporated graphical maps, such as Google Maps, to show geographical locations of equipment. While this is highly useful in a residential environment, it is a difficult solution to apply to a large business that resides in a single building.
We would like to develop a web-based client application that provides a graphical layout of a building and allows users to place icons of equipment in specified locations.
The server-side implementation of this application will be provided and will run on an existing CentOS Linux distribution using the Apache Tomcat webserver architecture. The student portion is to develop a webapp written in Java that will interact with the existing NMS server. All network device information and data will be provided by the server as well as access to a common database.
The application will work with existing equipment that has been discovered/added to an NMS in advance. There is no need for the application to add/remove equipment or modify equipment configuration. There is only the need to present a set of all equipment being managed, basic details to identify each device, the overall status of each device, and allow the user to place devices onto chosen locations of a graphical map. The map can be given any look and feel and it is encouraged that the map be made in such a way that the presentation can be dynamically changed by the user. Elements such as device icons, background images and equipment details should be able to be dynamically changed or customized.
Third-party and open-source libraries may be used, with our agreement, to implement the map. There are many Javascript libraries that provide HTML5 dynamic graphics, and these may be use to perform the rendering of the map.
The heart of this development exercise is to take existing tools and information and pull them together into a single, standalone mapping webapp. Without the app, a user only has tabular format lists of equipment to reference. With the app, the user has a rich and customizable interface that shows where equipment is located within an office building.
Corporate Background
Allied Telesis is a network infrastructure/telecommunications company, formerly Allied Telesyn. Headquartered in Japan, their North American headquarters are in San Jose, CA. They also have an office on Centennial Campus. Founded in 1987, the company is a global provider of secure Ethernet & IP access solutions and an industry leader in the deployment of IP triple play(voice/video & data), a networks over copper and fiber access infrastructure.
Intelligent Monitoring
One of the most critical components of running highly available software services is recognizing problems so that you can fix them before they become big issues. All IT operations teams use monitoring software for this purpose, which generally measures attributes of the service and compares them to known good values, raising an alarm if the attributes fall outside of the good range.
This works well for deterministic attributes of an application, but it doesn't work for less deterministic attributes. For example, a web request may generally respond in under a second, but occasionally take longer. It might be okay for a request to occasionally take 5 seconds, but not okay for it to consistently take 5 seconds. With traditional monitoring, an alarm would be set to fire at something more than 5 seconds to allow for the occasional outlier, but that wouldn't detect the scenario where lots of requests suddenly take 5 seconds. A more intelligent approach is needed.
For this project, you will implement a new type of monitoring that dynamically learns what "good" behavior looks like, and understands that occasional outliers can be acceptable. If, however, the behavior of the application meaningfully changes for the worse, alarms will fire. We will implement this solution to track web transactions as suggested above, and implement a web-based console view to illustrate the behavior over time and highlight alarm situations.
To build this monitoring, we'll use the NuPIC machine learning library. It provides the "anomaly detection" capabilities needed to learn acceptable behavior and identify true anomalies. We'll use Python as our development language, InfluxDB to store our monitoring data, and Flask for our web framework. Note that some of these technologies only run on Linux and Mac OSX, so a VM may be necessary to do this work.
In this project, you will also work closely with Bandwidth engineers. We will collaborate utilizing industry-leading agile processes, giving you a real-world experience that goes well beyond the code that you're writing. Bandwidth headquarters are located on Centennial Campus, making it easy for us to meet weekly to iterate on designs and code and to ensure we're building a great product. In the process, we're sure to have a lot of fun together.
About Bandwidth
Bandwidth is an innovative provider of next generation communication services that are helping change the way that people across the world communicate. We're the Voice Over IP platform behind services like Skype and Google Voice. We also built and operate the Republic Wireless mobile phone service, which is disrupting the mobile phone industry with it's wifi-first approach to mobile communications. We're a software company that is revolutionizing the telecommunications industry by powering the companies who change the way we communicate.
Be Your Favorite Player
Background:
Infusion is a Consultant Development company based in New York. We have offices all over the world: Toronto, Houston, Raleigh, Malta, London, and we're working on Singapore. We have a myriad of clients in different fields ranging from insurance and banking to children's toys and text books. We have received increasing interest from professional sports stadiums to integrate new technology with the intention of improving and personalizing the fan experience.
Experience:
U.S. National Soccer Hall of fame recently released plans for construction of a new building in Frisco, Texas. What if you could hold your phone up to a jersey and have that player's likeness superimposed above it? There are several use cases for this. A virtual tour of the hall of fame for instance, or just replacing your buddy's head with his favorite player.
Implementation:
This project will be a reality augmenting Android app. The basic process should have 2 steps (albeit easier said than done):
- Using the camera of the android device, recognize a soccer jersey (possibly with the help of a QR code attached to the Jersey)
- superimpose the player to whom the jersey belongs onto the shoulders of the jersey
We will start with a single player and a jersey hanging flat against a wall. Implement a system into which we can add new player data if we wish.
Stretch Goals:
Player stats:
Information about the player could be displayed along with their face. This could be static information stored at the same time as the player's likeness or pulled dynamically from someplace like wikipedia.
Handle a jersey being worn by a person:
This is probably more difficult that a jersey flat against a wall, so we'll make it a stretch goal. An intermediate step would be a jersey flat on a wall but viewed at an angle.
Amazon Public Cloud Forecasting
Background
Amazon AWS is the largest cloud provider in the United States. Organizations using Amazon services may operate AWS infrastructures across many regions in the world (and many environments per region) and see changes in loads and cost that vary with customer usage patterns over time, or with customer uptake. As clouds become elastic, costs become less predictable. While many startups and new applications have sprung up trying to solve this problem, few do it well.
The need for cloud cost reporting is magnified by the use of micro-service infrastructures which may be composed of hundreds of components, each run by separate small development teams, each deciding what compute infrastructure services to use and how much. It is important to understand both organizational aggregate measurements and a way to oversee and forecast computing usage consumed by individual autonomous teams.
Having access to fine grained data about cloud costs helps a cloud-consuming company decide when to consolidate services or consider investing in alternative technology.
About Us
Interactive Intelligence builds products for chat, audio, video conferencing, and collaboration for business organizations. One of the primary use cases if for customer-facing call/contact centers. Interactive Intelligence PureCloud is built on Amazon Web Services (AWS), and is perhaps one of the largest consumers of Amazon Web Services in the Southeast. Most of our cloud offering is developed locally in Research Triangle Park. We're wanting better insight into our cloud expenditures, but also want to see a tool developed that other organizations can benefit from.
Project Objectives
We want to provide views into hourly, weekly, and seasonal trends in Amazon costs as experienced by a company from both an (1) organizational, (2) regional/environmental, and (3) micro-service oriented perspective, showing cost break-downs and predictions not only on those axes, but also by Amazon services used. For example, what are the current monthly EC2 costs per Cloud Formation stack in each AWS environment? What are the totals? What about Dynamo costs? What were the values for last month and what do we anticipate for next year based on extrapolating the cost trends?
This project will take heavy advantage of available Amazon web services APIs and ideally be implemented in a dynamic language like Python (using web frameworks such as Django or Flask+SQLAlchemy). Ruby would also be acceptable. Web-tier technology choices (Angular, etc) are open ended and up to the project team, though some popular higher-level javascript framework should be used.
A good part of this project involves research into the ideal way to store, analyze, and present the usage data.
Ideally, this project will be run as an open source Apache-licensed project on GitHub, where other organizations will be able to contribute to the project after completion (and possibly during), with dual licensing rights to the project sponsor.
Understanding cloud costs and trends is a problem faced by many startups, and we want to build a free tool everyone can use. This will allow not only use of this as portfolio project for the teams involved ("show me your GitHub" being a common startup hiring question), but also allow anyone to take advantage and extend the project after completion.
Deliverables
The final product will be source code and documentation for a full-stack application, accepting one or more sets of Amazon credentials as input, that analyzes and reports on cost metrics, breakdowns, and trends in historical cloud computing usage.
A considerable amount of this project will be the determination of what is possible through exploration of AWS APIs andhow the data can be presented, and not exclusively just the implementation of a particular specification. Teams with an interest in graphs and visualization, and also "big data" type analysis may be particularly interested.
Expectations
Team members will work with mentors from Interactive Intelligence to further refine the requirements for the costing reporting system. We're looking for very self-driven students who want to bring a lot of new ideas to the table, and are deliberately leaving a lot of this project open ended. Good candidates will be able to surprise us and think of new ways to explore and present data beyond the basics.
Technologies suitable for a cloud deployment will be used and technical decisions will be aided by the project mentor. This should be a very good project for students who are interested in graphical visualization, API design, IaaS/SaaS, and also data analysis. The product here won't be specific to Interactive Intelligence, but we have a very large AWS infrastructure with lots of training data and use cases to supply. We are pretty flexible with meeting with you and welcome questions, demos, and high levels of involvement.
Interactive Intelligence will provide a dump of S3 billing metrics from AWS, development accounts, and other access as needed, so they won't have to simulate an active AWS infrastructure.
Health Care Blockchain
Today medical records are dispersed across many systems. Integrating these systems is difficult because they all want to be the authoritative source. This makes it very difficult, if not impossible, to get a comprehensive view of an individual's medical or personal health history. This information is vital in order to provide timely quality health care. A solution to this problem would be to provide a single, comprehensive view of an individual's health record (personal & medical), by which hospitals and doctors could have and record the most up-to-date information about a patient. However, because of the personal and private nature of health data, such a solution must be very robust in terms of data integrity, security, reliability, and accountability.
This project involves the use of Blockchain to implement a single health care record repository. Blockchain is a distributed database based on the Bitcoin protocol, and we are exploring its use for the life sciences industry. We believe this provides the level of integrity around the data that would be required for a system of this type. Specifically we would like to:
- Create a Blockchain
- Be able to add health care to the chain
- Be able to access / retrieve health care data from the chain
- Figure out a permission model for the chain so that it can be shared granularly
- Demonstrate you can grant access to the specific parts of the chain
The use case would be similar to an Electronic Medical Record (EMR) system, where you would need to give access to specific parts of the medical record but not all of it to particular parties. For example, consider the case of allowing someone to verify that a patient has certain vaccinations but you do not want them to see the entire medical history of the patient.
Merck will provide sample health data that resemble real medical records. The only technology constraint on this project is the use of Blockchain. Students working on this project are welcome to propose an appropriate technology stack for their implementation.
A System for a Direct Manipulation Interface to a Machinima Generator
Overview. This project involves the development of a novel javascript-based system to help novice machinima makers create cinematics using the existing Firebolt cinematic renderer. Firebolt is a stand-alone service that takes as input specifications for a narrative scene and returns the control directives for the execution of the story and its filming within a Unity app. One of Firebolt's key features is that it has a decoupling of the rendering/execution environment and the tools used to create the directives for the renderer.
The project will look at the use of the Blockly visual programming tool to allow novice machinima makers to script: scene set-up configurations, scene story lines and scene shot sequences to film action in the scene.
Scope of Work. The project will involve students collaborating with the project PI (Young) and two graduate students. The implementation would use Javascript, a language that many CSC undergraduates are familiar with, and integration with the Firebolt system, built in the
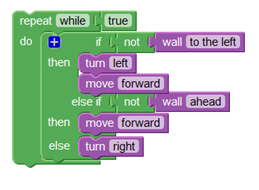
Figure 1. A sample Blockly code block.
Unity3D game engine, a tool that is also used in many of the games-specific courses in CSC. Because the project would focus on the user interface and the Firebolt tool already handles the cinematic in-game rendering, no significant 3D programming skills will be required (decreasing start-up time/learning curve) and the existing Firebolt team of developers will be available to help the Senior Design team while they are learning the tools and environment.
The project might be readily be divided into three elements matching well with a 3 or 4-person team. First, the project requires work to design the overall browser-based interface for specifying characters, sets, scene configurations, scene action specifications and the machinima player. Second, the system requires work to design, create and test a large set of Blockly blocks. In the blocky system, individual script statements are visually represented as a block resembling a Lego brick, but with user-adjustable interface elements that allow end users to set the block's parameters. Blocky blocks snap together to define sequencing. The project will require several types of blocks:
- character action blocks, that specify actions taken by characters (e.g., Character FRED moves from HOME TO CAR)
- camera action blocks, that specify shot details for a virtual camera (e.g, film FRED moving using a 50mm lens and a wide shot)
- scene control blocks, that specify additional details of the scene being filmed (e.g,. configure the set at the beginning of the scene to predefined configuration #3)
Third, the project requires the specification of custom XML code generation linking blocks to Firebolt specification. Finally, the project requires connectivity to and communication with Firebolt, either through embedding as a Unity web player or via access to a service.
At project initiation, the Senior Design team would work with the Firebolt team to develop project requirements and be responsible for brainstorming to settle on a UI, list of blocks and their connectivity and parameters and to learn about Firebolt capability. At the completion of the project, the Senior Design team could be included in the design and execution of an experimental evaluation for the system (assuming that the system is functional in advance of semester end). This work could involve input on experimental design, data collection and statistical analysis.
Configurable Security Analysis Tool
Summary Description
We have a large number of systems/applications within Boeing Business Systems, each with their own set of security configuration to define user access. Configuration includes usernames, which access the users have (i.e., list of tables and web pages they can access), whether they have update or read-only access, etc. This can make it difficult to quickly address questions regarding access to the applications and the underlying databases.
This project is to design and develop a configurable tool that can display information regarding user security. Information will be provided (see below for list of items) regarding the underlying meta-data (table schemas and data) for the security configuration which should be utilized to address the inquiries regarding access. The meta-data will vary by application and will involve multiple levels, including parent/child relationships.
This should be a web application and the students would be expected to choose the technology stack (with input and guidance from Boeing). Students should feel free to leverage any open source tools or code.
The tool should be able to address questions such as:
- What access does a user have?
- Who has access to a particular page in the application?
- Does a specific user have access to a particular page?
- Who has read-only access to a specific table in the database?
- Who has update access to a specific table in the database?
- Etc.
Key components of this project include:
- Build a flexible, configurable tool that has the capability to show detailed information from multiple levels and about multiple objects, including parent/child relationships.
- Configuration should be savable and persistent. The tool will be for reporting/analysis purposes, but will not update the actual security configuration.
- Configuration Interface should be intuitive.
- End-user interface should present itself dynamically based on configuration (no hard coded configuration).
Information provided by Boeing will include:
- List of Application or Database names to be included
- Table schema information for the security configuration (list of tables and fields that define the configuration)
- Sample data for the security configuration
ElasticQueue
Bronto Software offers a sophisticated marketing platform for its corporate clients, tracking billions of events per month. Customer events such as opens, clicks, and purchases (conversion) are recorded and analyzed in real-time and displayed to our customers to give them a clear view of how their campaigns are performing.
Bronto takes in billions of behavioral events per month. The rates of ingestion vary by hour of day, day of week, seasonally, etc. Our queuing systems buffer this input so that our servers which apply business logic to respond to these events may process them asynchronously and just get behind by a few minutes/hours rather than crashing or rejecting some portion of the traffic.
An example response to these events, at the human level, would be an email automatically sent to a shopper to offer them a discount on a product they've viewed but not purchased.
Our main queueing solution is Redis. This project will implement a cluster of Redis servers that is Highly Available.
The students will build on existing Bronto technologies to implement a queueing system that can automatically shrink/grow the queueing cluster as machines are added/removed/crashed. The EQ will have to orchestrate the efficient utilization of available hardware, ensure enough redundancy to lose no data when a server dies, and rebalance loads as servers are added or dropped. A REST API will also be required for manual cluster management tasks, e.g., making configuration changes and polling for status to be displayed on a monitoring dashboard.
The project may be developed locally on whatever hardware the student team has available to them. They can run each Redis instance in a container on one machine, VMs, or network their machines together, whatever works. The speed and capacity of the cluster aren't important as those properties will scale up when placed on real servers. What needs to be demonstrated is the ability of the students' software to respond to changes in network topology (addition or loss of a Redis instance) and any monitoring/dashboard features that are implemented.
Technologies: Redis, Java
Large Scale IoT System Simulation
Program proposal: Discussion of large scale IoT Sensor deployment with Cisco SME's and understanding the IoT deployment landscape from real world use cases. We propose that the students model a large scale IoT system and measure a limited number of options in deployment architectures and the related results. This will require domain specific research and understanding by the students as well as collaboration with Cisco SME's. A simulation program will be a necessary tool to quantify and qualify the differences in deployments taking into consideration several configurable variables. This simulation will provide a basic representation of the trade-offs for logic decisions to be made on architectural deployments. E.g., Fewer more accurate sensors are better than more expensive more accurate sensors in large scale deployment. [Consider smart building deployments or clean power generation].
Requirements: Data/measurements. Leverage open data sources. We encourage NCSU to leverage real data from campus or existing use case. Cisco will help in terms of providing guidance and sensor data. Programming for modeling and simulation.
Premise: Very large scale deployments are coming roaring our way (literally, drones and autonomous vehicles). No matter how well designed the individual components, their interfaces, and the communication infrastructure; something will fail in the system all the time. Hence, the issue is how to design and manage systems under failure. The toy example is Google - when it decided to use off-the shelf servers, Google realized that failures would be the rule, rather than the exception. Hadoop was an environment to make a large scale system work, and work well, under failures. I am talking now about systems that will more than order of magnitude more massive and more complex.
Consider a massive deployment of IoT sensors - to measure pollution, humidity, nitrogen, temperature ... your pick - over a large area. Consider the sensors prone to failure (matter of measurement and reliability). Also, to a larger degree, the sensors acting as a "system" which may be prone to regular problems (power, network, failure, interference, etc). The issue is how to design the overall system to generate reliable data even in the face of failures. Some possibilities: use fusion techniques; to produce reliable (with error bounds) data over each sector; model the whole area as a random field, an use statistical techniques. Trade-offs of high cost, high functioning sensors with lower deployment numbers vs high density sensor deployment using lower cost, lower accuracy sensors (trade-offs). What is the cross-over line between cost/function?
Tech focus areas:
- Data Fusion
- Machine Learning
- Statistical analysis
- Time-series
- Random fields
Additional Resources: TBD
Break the Ice Social Graph
Visualizing social web to understand human interactions
Description. In a previous senior design project "Break the Ice" we implemented an API that would analyze tweets and categorize them into areas-of-interest (such as sports, entertainment, politics) enabling users who are intending to interact to have an idea for topics for conversation (hence breaking the ice).
The goal with this project is to extend and expand the idea of breaking the ice to provide a visualization of the social graph. A core concept with social graphs is who-know-who (WKW). Being able to infer WKW and provide the context for that inference visually is the primary requirement. The context will be derived from the classification/categorization of the content in the social graph. The content will be the original posts from users, the other user they follow, or the users that follow them, the posts that they like (thumbs-up or heart icon), the posts they reply to, the depth of the reply chain and so on.
More complex information can be gathered by extracting geographical nature of the relationships - if two users following each other are in the same geographical vicinity, then there is a higher chance of them having a face-to-face meeting or other forms of communication beyond online social tools (which would be important in pursuing a business lead).
The social graph will extend across the popular social networks. For the context of this project let us limit interfaces to Twitter, LinkedIn and Facebook. These products have public APIs that provide mechanisms to navigate and extract content from the graph.
Technologies. As a part of implementing this project a few technologies will come in use. The following is a list of some potential (but not limited) technology choices.
- Programming language and platform
- Java/J2EE
- C# and .NET
- Python
- Graph Databases and APIs
- Apache TinkerPop and Gremlin
- Refer to this thread: https://news.ycombinator.com/item?id=10434372
- Webserver
- Tomcat or TomEE (enterprise edition)
- ASP.NET 4.5
- REST library
- RESTeasy is a good Java library
- ASP.NET 4.5 has great support for REST in .NET
- LinkedIn, Twitter, Facebook APIs
- The APIs are available for various programming languages
- JSON serializer/deserializer
- Java: Jackson is the best Java library
- JSON.NET for C#/.NET
- Database
- NoSQL databases such as MongoDB
- SQL database such as MariaDB, Postgres, MySQL
- IDE
- Java: IntelliJ Community Edition or Eclipse
- .NET: Visual Studio (open source edition is available)
Interactive Dashboard for IT Operational Support Teams
Overview
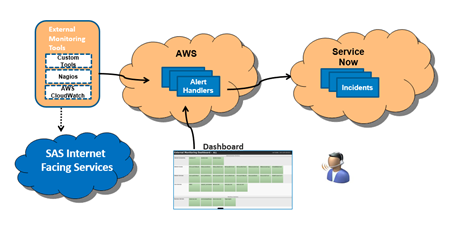
SAS has the need for an interactive dashboard displaying the monitoring state of critical external facing resources. The dashboard is a component of our overall IT Event Management Process, based on ITIL best practices. ITIL is an acronym for Information Technology Infrastructure Library, which is a set of practices for IT Service Management (ITSM) that focuses on aligning IT services with the needs of business. It is the foundation for most IT organizations.
The Project
Utilizing technologies such as Amazon Web Services and ServiceNow, design an interactive dashboard that can be used by IT Operational Support teams to view the state of critical resources (aka configuration items) as well as drill down and help diagnose incidents as they occur. Examples of configuration items are routers, servers, applications, databases, etc. An example of an incident is when the server becomes unresponsive and the resulting service is unavailable to the users.
High level requirements
- The dashboard is to be an alert and notification receiver for critical configuration items.
- It should be able to receive alert messages from monitors external to it (e.g., Nagios, Zabbix, Panopta, etc).
- It should allow for users to dynamically work with specific details about a configuration item (e.g., incidents, changes, etc.) and therefore have the ability to drill down into ServiceNow for this additional information.
- Overall Service Level Agreements (SLA) statistics should be available where applicable.
- The dashboard should have an administration feature to allow for easy setup and changes.
- The monitoring tools, feeding in the resource events are not part of this project but in order to integrate successfully the dashboard should allow RESTful web posting of status changes.
- The dashboard needs to be designed with High Availability Principles in mind. Use of network load balancer, multi-region failover will be need to be considered. No one component should be designed with a single point of failure.
Technology Available to Use
Utilize AWS services such as S3 storage, Lambda and RDS for construction of an event router and then ServiceNow as the User Interface layers for display of resources. The construction of dashboard will require analysis by the student for best fit for purpose components from the available options. A Nagios monitoring install into an AWS EC2 instance would be used as an example of one of the many monitoring tools that would be used to feed alerts to this dashboard. The work can be handled remotely since these are all cloud based or software as a service options.
SAS would provide a separate standalone AWS account and the student would be able to obtain a free personal developer instance of ServiceNow so the work would be isolated from SAS's corporate network.
We have decided to extend this proposal by doing a comparison of two differing approaches, one based upon a mixture of various technologies within AWS and the other being the extension of an existing monitoring product that provides dashboarding capabilities. This is a typical exercise that we would go through to determine the best approach to a problem based upon existing technologies. A review and research spike would kick us off.
Deliverables
The outcome will be a Highly Available interactive dashboard that we can install and use at SAS. Hence it needs to be able to be packaged up (with documentation) for install. Besides the software components for installation there would need to be documentation covering operational components and user interface documentation.
Benefits to Students
Project exposes the Students to cutting edge industry technologies such as:
- AWS Cloud and AWS services
- ServiceNow IT Service Management Tool and custom application design
- Experience with Open Source tooling (Nagios)
- Use of scripting languages such as python
- Designing for High Availability and redundancy.
Project would also require the Student to gain valuable experience in the operational side of producing an application such as:
- Installation of designed software (AWS CloudFormation and/or ServiceNow plugin design).
- Source Code control
- Documentation creation (User and Operational Support).
Toolshed
Business Need
WebAssign has many "behind-the-scenes" tasks that are run through various internal tools. These tasks involve everything ranging from changing ebook prices to updating question assets. These tools currently live in different locations on various systems which all have their own authentication methods. We need a system that will bring all of these tools together under one roof with a singular authentication method.
Target Audience
- Internal WebAssign employees that want a more efficient and centrally located platform for their various job related tools
Requirements
Authentication
- Ability to authenticate user access to the system against an Active Directory server
- Ability to control an individual user's access to specific tools through Active Directory
- Ability to control an individual user's CRUD access within a specific tool through Active Directory
User History
- Ability to track a user's every action within the system (i.e. the user logged in)
- Ability to track the context of a user's action within the system (i.e. the user changed value A in tool X to value B)
- Ability for users with correct Active Directory permissions to view user actions within the system
Tool Management
- Ability for users with correct Active Directory permissions to enable and disable specific tools
- Ability for users with correct Active Directory permissions to modify a specific tool's name, description, and any other field that is deemed relevant (based on your design!)
Tool Access
- Ability for a user to see which tool(s) they have access to
- Ability for a user to interact with the tool(s) that they have access to
General
- WebAssign adheres to Agile principles of development, using Agile roles, artifacts and ceremonies
Stretch Goals
- Usage Statistics Tool
- Implement a tool that provides statistics about usage of the system. These statistics can include what tools and functions within a tool used most, what time users typically access a tool, and how long users typically interact with a tool. This tool would be useful for determining areas of improvement that can be streamlined to improve employee efficiency.
- Job Queue
- The ability for a tool to schedule an action to take place at a certain time, and allow tasks to run outside the realm of a page request would provide immense benefit for the system. A companion example tool would be useful for showing off this functionality.
Your Task
You will design and implement a microservice based system that will host various WebAssign internal tools and authenticate WebAssign employees' access to said tools. The system's backend will be written in Go, and the frontend written in AngularJS. The system will use Active Directory via LDAP for authentication purposes. Your code should include tests and be extensible, maintainable, and well-documented. We recommend using an iterative Agile development style in order to ensure you meet the project goals.
You will not be expected to write, integrate, or adapt any existing WebAssign tools for this project. However, including a User History tool and Tool Management tool is a suggested way to meet parts of this project's requirements.
While we don't want to dictate how you design the system, we envision that each tool will be its own microservice. It is assumed that existing tools will be adapted or rewritten before being integrated into the system.
Skills
The team will be working with the following technologies and tools:
We expect team members to have the following:
- Familiarity with Web Development Principles
- Understanding of unit testing strategies
We would be pleased to have team members with the following:
- Web Application Development experience
- Go experience
- Docker experience
Aardvark-Driven Dashboard
Healthcare firms are focused more than ever on agility. But tactically cutting costs while launching new market strategies requires a data-driven approach to planning and managing numerous IT projects. To help, Blue Cross Blue Shield (BCBS) of NC has created Aardvark, a mobile/web app that provides a common interface for collecting, updating, and managing information about various, ongoing IT projects.
Although Aardvark offers a straightforward interface for collecting data, the problem of navigating and visualizing this data appropriately remains. Working with developers from BCBS of NC, the NCSU Senior Design team will help to solve this problem. Using the same agile/scrum methods practiced at BCBS, the NCSU team will create an interactive dashboard interface with the following features:
- Alternative data visualization models suited to the data collected by Aardvark.
- Impact analysis views to permit the user to explore relevant what-if questions associated with ongoing projects.
- Support for subject-area extracts and analysis of data, both scheduled or on-demand.
- Authentication and access control and for different classes of users.
BCBS will work with the NCSU senior design team to create sample data for use in designing, implementing and testing this project. We will work with the team to select suitable technologies (e.g., D3) that enable flexibility and creativity in what the dashboard can display and how it displays it.
Stream Management in Backups
Background
Data Domain is a line of backup products from EMC that provide fast, reliable and space-efficient online backup of files and databases comprising terabytes of data via a variety network protocols (CIFS, NFS, OST). Using advanced compression and data de-duplication technology, gigabytes of data can be backed up to a Data Domain server in minutes and reduced in size by a factor of ten to thirty or more.
Customers must be able to backup their data efficiently to meet constantly decreasing backup time periods. Multiple customer systems may be backing up data to a single Data Domain system simultaneously. The different backups may require different resources from the Data Domain system. One critical resource is streams, representing the number of files being actively backed by the backup application. Streams are a limited global resource provided by the Data Domain system and shared by all backup applications using the Data Domain system. Previously there was no means for different backup applications to coordinate their usage of streams, or any way for users to allocate streams among different applications. Streams were allocated to backup applications on a first come, first served basis. A previous project implemented a prototype version of the library used by the backup applications that could monitor stream usage among multiple applications so that stream usage information could be known and shared among backup applications. This prototype provided only very simple capabilities for allocating stream resources to an application.
The focus of this project is to enhance and extend this initial prototype library to perform more complete stream allocation and management. The team will devise and implement management policies and algorithms that take advantage of the streams tracking mechanisms provided to enable stream resources to be shared efficiently among competing backup applications. Factors that may need to be considered include the number and types of streams available, the current and projected streams required by each application, the priority or other service requirements of the applications, the time(s) by which the backups must complete, and the current load on the client and server systems. The purpose of the enhanced prototype is to demonstrate how stream resource usage might be best monitored and managed to improve overall backup performance without requiring any changes in the backup application software or to the Data Domain system.
Project Scope
This project will extend the previous project's C library sources and use the existing Data Domain loaner system (currently in place at NCSU). The existing shim layer adds the ability to monitor the stream resources available from the Data Domain system, keeps track of the streams used, and shares the information on streams used and needed with other backup applications. The goal is to use these basic mechanisms to apportion the streams among the applications so that all the backups receive the needed number of streams to complete their backup in an efficient manner, based on user defined parameters such as backup priority, deadline, required minimum and maximum number of streams, and possibly others defined by the project team.
When the backup application opens a file for writing a backup or for reading to restore a file, the shim layer will decide whether to allow use of another stream, based on the application's current stream usage, the stream usage of other applications, the streams available on the Data Domain system being used for the backups and various defined configuration parameters. When a file is closed the shim layer may make the stream available to the backup application closing the file, or to another application depending on the current stream allocations, usages, and configured parameters. A backup/restore application that calls the new shim layer will be provided. Source code from the previous project will be provided that will be used as a starting point for the extended shim library. These sources can be modified appropriately to incorporate the new stream management features.
The project being proposed consists of two phases: (1) extending the existing library that monitors stream usage to manage stream allocation according to defined policies, and (2) evaluating the performance of the new library to measure the effectiveness of the implemented policies. The team will participate in defining the policies to be used in phase 1 and suggesting further improvements or changes based on the performance evaluation of phase 2.
Benefits to NCSU Students
This project provides an opportunity to attack a real life problem covering the full engineering spectrum from requirements gathering through research, design and implementation and finally usage and analysis. This project will provide opportunities for creativity and innovation. EMC will work with the team closely to provide guidance and give customer feedback as necessary to maintain project scope and size. The project will give team members an exposure to commercial software development on state-of-the-art industry backup systems.
Benefits to EMC
The managing stream layer will serve as a prototype for a more efficient Data Domain backup library and will allow evaluation of architectural and design decisions in current and future versions of Data Domain backup software. Performance results will aid in estimating expected application performance customers would experience in backing up and restoring their data.
Company Background
EMC Corporation is the world's leading developer and provider of information infrastructure technology and solutions. We help organizations of every size around the world keep their most essential digital information protected, secure, and continuously available.
We help enterprises of all sizes manage their growing volumes of information-from creation to disposal-according to its changing value to the business through big data analysis tools, information lifecycle management (ILM) strategies, and data protection solutions. We combine our best-of-breed platforms, software, and services into high-value, low-risk information infrastructure solutions that help organizations maximize the value of their information assets, improve service levels, lower costs, react quickly to change, achieve compliance with regulations, protect information from loss and unauthorized access, and manage, analyze, and automate more of their overall infrastructure. These solutions integrate networked storage technologies, storage systems, analytics engines, software, and services.
EMC's mission is to help organizations of all sizes get the most value from their information and their relationships with our company.
The Research Triangle Park Software Design Center is an EMC software design center. We develop world-class software that is used in our VNX storage, DataDomain backup, and RSA security products.
Heads-up Transaction Monitor
Summary
The student team will create a real-time monitor that displays a visual representation of transactions traveling through a system. The project team could start with two transactions and add a third if time permits to show the extensibility of the solution. Transactions can include reads and updates that are initiated by the system and tracked by the monitor. Solution should be designed in a generic way such that transactions can be 'framed' and defined in terms of arbitrary steps/phases/states. The transaction is green if all is well but turns yellow or red if certain classes of problems occur. Such a monitor could also have higher-level views of overall health - e.g., for the system as a whole, by subsystem, or health by subcomponent - with a consistency of green/yellow/red indications for 'at a glance' status info. The audience for this project would be 1) Operations personnel monitoring system health and 2) application developers who support the system (understand the logic of the code and transactions being monitored)
More detailed information
"Heads-up" refers to an application that can be continuously running in an operations control room such that problem situations can be easily spotted by operations personnel. The application may also be made available to individuals via a web browser for on-demand status/information gathering.
The monitor itself is 'real-time' in the sense that at any given time it displays an indication of the current status of a particular system using a simple color coding. System here refers to an application that supports transactions such as read and update. For the purposes of this project the team isn't required to build this system, rather they can create the output that this system would generate if were being used. That output can then be polled in a continual manner to populate the information rendered in the Monitor display. The default state of the display may show a single shape representing the system as a whole. The user may click on an entity in the display to 'drill down' to a lower level of detail; in this way, clicking on the system as a whole might display multiple shapes indicating the system's subcomponents, and clicking on a subcomponent might show individual transactions being handled by each subcomponent.
Students would not be expected to modify an existing system; rather, students would design this application to be a monitoring service with which any application/system can be integrated. "System" refers to any software system (or subcomponent thereof); the simplest form of such a system might be a small application, while more complex forms might be a suite of applications such as NetBenefits. The monitoring application can be made aware of a given software system or application via the log records written by the 'client' system/application - i.e., the monitoring application continuously monitors the messages that are logged by the client system/application, making logical sense of those messages (log records) by relating them to each other. A critical component of this project is the specification of a logging standard that specifies how entities being monitored (i.e., represented in the monitoring display) are framed/recognized and how the status of those entities are determined. For example, the project may define a standard 'language' that identifies subcomponents by name, defines the beginning and end of transactions, and signals abnormal termination of a transaction - 'transaction' being any arbitrary operation (as defined by the consumer/client application/system integrators) for which such state monitoring is desired. Examples of potential problems might be: an update transaction that fails because a database is off line, or a read that times out due to an unexpected network slowdown. The monitoring application should be able to track multiple entities and/or transactions (and their states) simultaneously.
Voice Navigation of Web Applications
Based on reading DOM elements, dynamically provide a utility that enables voice navigation by the user.
- Provide a utility that can be employed across various websites that allows voice initiated control, action and shortcuts
- Use Natural language processing capabilities to translate voice to text and a semantic framework that interprets/translates voice commands to a set of predefined actions.
- Examples: "Go to the Profile Section of this site" (navigates to Profile landing page), "Change my display name to Ben Franklin" (completes a transaction to update display name)
This project will create a mechanism or framework to voice-enable web pages, including pages that weren't initially created with this interaction mode supported. We have examples like Ok Google, Siri and IVR that have become much more widely accepted and in certain use cases preferred over typical touch interaction. There may be richer support for this interaction mode coming through the HTML standard via W3C, and leveraging any existing mechanisms to support this functionality would be welcomed by the project team. Additionally, supporting voice interaction could potentially benefit persons with disabilities and increase the accessibility of web applications.
This solution could also be used on a variety of different devices that support rendering HTML and that possess a microphone for voice input. The project team can select the target device to demonstrate this functionality.
The scope for the project will be to handle Navigation of an existing site using Voice Input. This could involve specifying literal and/or pre-defined library of terms that can be matched via voice recognition. For example the project team could specify verbs for Navigation: e.g. "Navigate," or "Back."
Stretch goals could include:
- Accepting loose matches with Voice input: e.g. "Go to Profile Page," "Navigate to the Profile landing page," and "Open Profile" would all complete the same action of navigating the site to the Profile landing page
- Completing a transaction supported by the site: e.g. a form submission. For example, open amazon.com and allow the user to say "Search for the Minions Movie" would enter that text and submit the search in the browser.
- Providing a way for this solution to be utilized by web application developers within the sites they are building to extend the Voice command library to complete specific actions that are custom/unique to their site. E.g. amazon.com could extend this solution by adding a command to "Re-order my laundry detergent" that would complete the '1-click' order transaction via voice input.
Love Lock Bridge
Background
Infusion is a Consultant Development company based in New York. We have offices all over the world: Toronto, Houston, Raleigh, Malta, London, and we're working on Singapore. We have a myriad of clients in different fields ranging from insurance and banking to children's toys and text books.
Experience
The Pont des Arts bridge in Paris, France is what people around the world refer to as the "Love Lock Bridge". Couples would purchase a padlock, close it on a link of the guard rail, and then often throw the key into the river below. Recently, Paris authorities had all of the panels of locks removed, effectively ending the practice. Your mission is to recreate this bridge virtually with an android application. This project will serve as a mobile tech integration POC for our partnership with Samsung.
Implementation
This project will consist of 3 parts. A "bridge" UI that might be displayed on a TV in an airport or mall, a "lock" app on an android device, and a server that facilitates communication between the 2 clients.
Server
The server should implement the REST pattern and store information like keys and messages in MongoDB.
"Lock" Client
This is the phone portion of the project. Users should be able to generate a lock, include a message "hidden" in the lock, attach the lock to a "bridge", and then send the key to another user. The lock is stored permanently, and whoever has a key should be able to revisit the lock anytime. Sent keys are copies, but perhaps unique keys can be added as a stretch goal.
"Bridge" Client
This will also probably be an android app that can cast to a TV. This portion of the project will represent the bridge. A user will be able to attach a lock to the bridge if they are in physical proximity to it. They should then be able to send that key to another user who can use it to open the lock and read its message. All bridges are connected to the same database, and can be thought of as a single bridge. Someone in Rome could send a key to someone in Singapore who could then open their lock in Sydney or Beijing. The bridges should display a set of generic locks like a screen saver most of the time but have some animation to bring any locks with keys in proximity to the bridge forward in the view.
Stretch Goals
UI Improvement
Some sort of animation based on proximity. If you have a key to an unopened lock associated with your user, the lock should move around on the screen.
NFC Support
One of the challenges for making this project something people will actually use is user experience. Transferring a key to someone by tapping phones together would be helpful in this endeavor.
Multiple Hypothesis Tracking
This project involves both design and implementation and a research component. Fundamentally, the problem is to create different kinds of synthetic data and then to run that data through the well-known Multiple Hypothesis Tracking (MHT) algorithm. The team will examine the performance of this algorithm, in terms of both its computational speed and its accuracy.
The team will build a simulated Air Traffic Control (ATC) system using the Multiple Hypothesis Tracking formalism of, e.g. Reid (1979). This will include two primary components: 1) the simulated trajectories of the observables, and 2) the MHT algorithm for tracking objects. Part 1 invites a sequence of successively more complicated goals: generating real-valued data in 2, 3, and higher dimensions (for example position, velocity, color, etc.); building a library of different motion models [for example, simple individual motion, group motion, interacting motion (crossing paths)]. Part 2, the MHT problem has been shown to be NP-hard in its computational complexity. For this problem the goal will be to implement for full MHT solution, explore the performance of the algorithm under successively more complicated data scenarios, and identify the computationally expensive parts of the algorithm.
This is a straight-up implementation of the MHT (which is well referenced) and the creation of different kinds of synthetic data to explore its performance. The team will be able to choose their implementation language (e.g., Matlab, python, perl), but the MHT should be flexible to the kinds of synthetic data.
End-to-End Storage QoS
Note: This project will require students with the interest/ability to make changes to the Linux kernel (particularly NFS).
Background
Storage consolidation has allowed for increase performance (more spindles available), enhanced protection (snap shots, replication, RAID) and greater storage efficiency (de-duplication, compression, thin provisioning). With consolidation of storage came consolidation of workloads accessing the common storage pool and the problems of sharing a resource among different workloads with different storage requirements i.e. insufficient bandwidth to satisfy all demands. Enter Storage QoS.
Storage QoS manages workload demands so as to limit the interference of low priority load (e.g. user directories) to high priority load (e.g. payroll processing). The idea is relatively straightforward; queue low priority work allowing it to trickle in as resources are available. This works well enough to smooth out demand bursts but has some poor behavior if sustained demand is above the system capacity:
- Queuing times increase leading to protocol failures.
- Queued requests tie up resources needed to on-board priority requests.
- Clients with mixed priority workloads can suffer delays due to priority inversion.
Now suppose the client participants in Storage QoS. Instead of the Storage Processor (SP) queuing requests and tying up resources, the client does the throttling. This would reduce the queuing delay experienced by the client protocol engine and make resources available for priority requests on both client and SP.
Purpose: To create an end-to-end Storage Quality of Service (QoS) based upon Linux systems.
Server Component
- Configure Client based SLA - Service Level Agreement describing attributes of the storage provided. Attributes can include: Maximum IOPS (I/Os per second), maximum throughput, minimum IOPS, minimum throughput, maximum latency (response time).
- Monitor Compliance (throughput, latency, IOPS, etc.)
- Send adjusted throughput limits to all connected clients to meet SLA (throughput/IOP throttle). [RPC?]
Client Component
- Accept throttle settings from two or more Storage Servers
- Enforce limits on per server basis
Suggested implementation environment: Linux NFS client/server. Should have at least one server and at least three clients.
Extensions
Volume (filesystem) based SLA, balancing throughput among all clients accessing the volume using offered load for determining the individual client settings (requires feedback from the client to the server).
Enhance control to encompass different request types e.g. Read, Write, Other.
Labeling requests with identifier and completion deadline. Allows for mixed workloads from a single client and enables latency targets. Likely requires extension to NFS protocol.
Design and Implementation of a Scalable, Adaptable Multi-stage Pipeline for Medical Applications
There are two major technologies that have been used by researchers in the field of High Performance Computing (HPC). First, Message Passing Interface (MPI), a library for distributed memory parallel programming, which is a language-independent communications protocol; second, Apache Spark, a fast and general engine for big data processing with built-in modules for streaming, SQL, machine learning and graph processing.
In the domain of distributed systems, one of the main challenges developers face is to choose an appropriate technology for their applications. Data and operation are the key entities in selecting an appropriate technology. Decisions would be different based on whether the application sends data or operations to computing nodes. Generally speaking, MPI is suitable when the size of messages is small, and there is no need to shuffle significant amounts of data between computing nodes. On the other hand, the map-reduce paradigm that the Apache Spark supports is useful when many shuffle operations are issued between processes. Other factors, such as being fault-tolerant, also impacts developers' decisions in choosing an appropriate technology.
Considering the abovementioned factors in advance without running the application is laborious, and it requires sophisticated modeling techniques (e.g., modeling the communication cost of underlying network, etc.). One more cost-effective approach would be to experimentally test the applications under different input configurations using different technologies.
This project focuses on three existing medical applications provided by our collaborators at Duke and UNC shown in Figure 1: (1) DNA Sequencing, (2) a knee cartilage MRI processing, and (3) a brain MRI processing. As illustrated below, these applications feature a sequence of stages, currently run serially via a shell script.
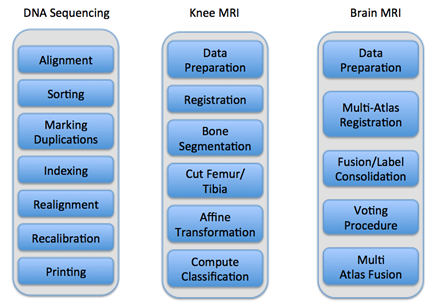
Figure 1: Processing stages making up the three target application areas for this project.
Pipelining these applications offers a flexible way of improving performance across multiple inputs. We can run multiple stages in parallel, with data from each input progressing through the stages as the sequence of inputs is processed. We've completed pipelined implementations of two of these applications using MPI, and we expect the third to be completed soon.
Our long-term objective is not just to create a single pipelined implement for these three applications. We want to develop generic, expandable technologies for creating pipelines suitable for a variety of medical big data applications running on a variety of hardware and software. This requires the exploration of the space of alternative parallel implementations and development of mechanisms for tuning the behavior.
For the senior design project, our first objective is to develop competing Spark implementations of the three pipelines depicted in Figure 1. These new parallel implementations will be based on the existing serial implementations created by domain experts and the parallelized implementations created with MPI. The Spark implementations will be a first step in exploring the space of possible, high-performance implementation alternatives.
The research phase of the project will focus on comparing the performance of MPI versions with the Spark ones under a variety of input configurations. The outcome of this research subtask would be the to identify the most important parameters affecting performance and the overall decision in choosing an appropriate technology. For example, if the number of testing images is less than twice of the number of computing nodes, MPI is a better option because the amount of communication overhead is less; therefore, for this simple example, the key parameters are number and size of images.
After identifying key parameters, the fourth phase will focus on writing a Python/Scala script that receives input parameters for these pipelines [e.g., pipeline stages (input, output), size and format of input files, etc.], and recommends which technology is most suitable for each phase of the pipeline.
Although not absolutely essential, familiarity with the Python programming language and an interest in medical applications and high-performance computing would help team members to contribute to this project. This team will be working with researchers at NC State, UNC and Duke.
- Dr. Frank Mueller, Professor of Department of Computer Science at North Carolina State University
- Dr. Marc Niethammer, Associate Professor of Department of Computer Science, UNC Chapel Hill
- Dr. Kouros Owzar, Professor of Biostatistics and Bioinformatics and Director of Bioinformatics, Duke Cancer Institute
- Dr. Martin Styner, Associate Professor of Psychiatry and Computer Science, UNC and Director of the Neuro Image Research and Analysis Laboratory (NIRAL)
- Amir Bahmani, CSC Ph.D Candidate, NC State
We expect the development effort for this project will be organized as follows:
| Sub-Tasks | Note | Timeframe | ||
| Phase 1 | Spark Implementation of DNA Data Preprocessing Pipeline | MPI + Python | Completed | |
| Spark + Scala | First month | |||
| Spark Implementation of Imaging Analysis for MRI Knee Cartilage Segmentation Pipeline | MPI + Python | Completed | ||
| Spark + Scala | First month | |||
| Spark Implementation of Imaging Analysis for MRI Brain Segmentation Pipeline | MPI + Python | In Progress | ||
| Spark + Scala | First month | |||
| Phase 2 | Performance Evaluation | DNA Data Processing | MPI vs. Spark | Second month |
| Knee MRI | ||||
| Brain MRI | ||||
| Phase 3 | Load balancing | DNA Data Processing | Parameter Extraction | First half of the third month |
| Knee MRI | ||||
| Brain MRI | ||||
| Phase 4 | Self-tuning | Writing scripts supporting self-tuning for the three applications based on the extracted parameters | Second half of the third month | |
* Amir will help students to learn Spark/MPI/Scala
Project Archives
| 2026 | Spring | Fall | |
| 2025 | Spring | Fall | |
| 2024 | Spring | Fall | |
| 2023 | Spring | Fall | |
| 2022 | Spring | Fall | |
| 2021 | Spring | Fall | |
| 2020 | Spring | Fall | |
| 2019 | Spring | Fall | |
| 2018 | Spring | Fall | |
| 2017 | Spring | Fall | |
| 2016 | Spring | Fall | |
| 2015 | Spring | Fall | |
| 2014 | Spring | Fall | |
| 2013 | Spring | Fall | |
| 2012 | Spring | Fall | |
| 2011 | Spring | Fall | |
| 2010 | Spring | Fall | |
| 2009 | Spring | Fall | |
| 2008 | Spring | Fall | |
| 2007 | Spring | Fall | Summer |
| 2006 | Spring | Fall | |
| 2005 | Spring | Fall | |
| 2004 | Spring | Fall | Summer |
| 2003 | Spring | Fall | |
| 2002 | Spring | Fall | |
| 2001 | Spring | Fall |