Projects – Spring 2020
Click on a project to read its description.
About Advance Auto Parts
Founded in Roanoke, VA in 1932, Advance Auto Parts (AAP) is a leading automotive aftermarket parts provider that serves both professional installer and do-it-yourself customers. Our family of companies operates more than 5,100 stores across the United States, Canada, Puerto Rico and the Virgin Islands under four brands, Advance Auto Parts, Carquest Auto Parts, WORLDPAC and Autopart International. Adapting the latest in data and computer science technology, Advance Auto Parts' Center for Insight and Analytics aims to bring machine learning and artificial intelligence to the automotive aftermarket parts market to turbo drive it forward into the digital era.
Background and Problem Statement
AAP knows a lot about cars – but it doesn’t know a lot about robots. The next generation of retail distribution centers and potentially stores will need an army of robots on the ground to provide endless streams of information back to a central repository feeding data science models. This project will focus on a prototype based on an Arduino-controlled robot kit designed to gather photographic data while following a path that simulates an AAP retail store or distribution center and is controlled through the AAP AWS IoT back-end and local Raspberry Pi access point. Exploration of autonomous operation is also encouraged.
The robot journey will start from a charging station where the robot will receive tasking jobs from AWS-IoT. The robot will then drive a path to simulate a store and periodically capture images. At the end of the path, the robot will return home to the charging station and upload the data to an AWS S3 bucket again using AWS IoT and wait until the next tasking job dispatch.
Project Description
The bulk of this project should center on the design and implementation of the robot but also incorporate a secure, cloud-based command and control structure. The project will build off an existing NC State-developed, AWS-based, IOT backend network that is centrally managed by deployed Raspberry Pi(s) that deliver instructions and updates, download and upload data, as well as manage memory and compute resources. Using this communications platform, students will design an Arduino-controlled robot (resources provided) to gather frame grabs from a USB webcam that is uploaded to the cloud. For the purposes of this project, the path followed may be static and determined a priori, but autonomous operation is enthusiastically encouraged for investigation. Assembling the robot will require some minimal work with hardware; most of the focus will entail developing the software-controlled motion and communications with the Raspberry Pi and AWS.
The next generation of retail distribution centers and potentially stores will need an army of robots on the ground to provide endless streams of information back to a central repository feeding data science models. This will help provide new insights to the business on space optimization, inventory optimization, and labor management, just to name a few.
Technologies and Other Constraints
- AWS
- AWS/IoT
- Raspberry Pi
- Arduino
- USB Webcam
- Web Design
- Python is the preferred coding language, where applicable
Robot Manipulation. The initial functionality of the robot will be motion manipulation to drive the robot around a store or DC environment and return to the robot’s home. The path the robot will need to navigate can be considered deterministic. Unforeseen obstacles will not be handled in the scope of this project. Autonomous functionality is encouraged, but may require the additional hardware.
Image Capture and Data Handling. A second primary function of the robot will be image capture. The robot will need to be designed to accommodate settings including a manual software button trigger, configurable time-capture, and video. The resulting data will need to be uploaded to an AWS S3 bucket, through the Raspberry Pi.
Management & Resiliency. Command-and-control of the robot will function through the AWS-IoT and Raspberry Pi infrastructure. Students will need to integrate the existing AWS-IoT and Raspberry Pi infrastructure. Students will also need to extend the existing AWS-IoT and Raspberry Pi infrastructure to incorporate necessary command-and-control to accommodate the mechanisms for manipulating the robot. Additionally, the robot will need a minimum capacity for self-management to overcome minor issues and minimize downtime (e.g. the device may have set thresholds for unresolved errors and automatically shut down processes or reboot, as appropriate). AAP administrators will interact with the robots through the interface to manage the tasking, updates, configuration, and security settings of all, some, or a single device. While individually administering the robots through the user interface is required, command-and-control of the robots should be as automatic as possible and handled through tasking jobs. The tasking interface should be designed as modularly as possible to extend from the function of image capture and motion to other potential robotic tasks (e.g. moving items from one location to another). Communications for the robot will need to be secure, extensible, and bi-directional. Communications will use the existing AWS-IoT architecture (e.g. MQTT). Given the asynchronous, distributed nature of the data flow, students should consider how to test new tasking/update scripts before deployment to minimize this risk.
Students will be required to sign Non-Disclosure Agreements and to sign over IP to Sponsor when team is formed.
About ARG Lab
ARG Lab is an NC State Computer Science researching laboratory focused on developing innovative and effective educational interventions to assist lower-performing students improve their understanding of the course material. This particular branch of the researching lab focuses on improving practice exercises while students are learning Computer Science through the use of novel exercise types and determining when to best deliver a particular exercise type to a particular student.
Background and Problem Statement
TYPOS is a CS Exercise Delivery Platform currently in use at NC State. TYPOS is built with Python's Flask web framework and student data is stored in a PostgreSQL database. The entire system is hosted on a Centos OS 7 server at NC State. The system has been deployed into several of NCSU's CSC courses, including CSC 111, 216, and 316. Our prior research on TYPOS has led to a poster at SIGCSE 2019 and publication at ACE 2020. The current implementation of TYPOS and its current features can be found at https://github.ncsu.edu/TYPOS.
The ARG Lab team is seeking to expand TYPOS’ current functionality to support a variety of novel practice exercises, including traditional small-program coding exercises. However, allowing students to submit arbitrary code to be executed on a remote server opens TYPOS and other similar systems to potential vulnerabilities from malicious code or students seeking to circumvent the system.
Project Description
In order to test student submissions on TYPOS, a ‘sandbox’ (or ‘code vault’) creates a contained environment in which the student’s submission code can be executed without impacting the integrity of the system’s current settings. The student team would be responsible for developing design recommendations for reliable sandbox services for multiple languages and runtimes. These recommendations should be configurable, and should defend against calls to system libraries (such as the ‘sys’ library in Python), undesired file creation, resource allocation threats (such as memory seizure or deliberate loops), attempts at privilege escalation, and attempts to access the underlying file structure of the system. The proposed system must also be extensible and reusable to allow for modifications in the face of novel threats. Finally following discussion with the PIs the students will be responsible for implementing the service for Java and Python for use in courses at NCSU.
This solution will allow student end users to use the system without threat of privacy violations, while protecting the TYPOS system from malicious users. Further, this solution will allow ARG Lab researchers to begin investigations into optimal exercise activity sequencing, leading students from learning their first CS concepts to executing designing, developing, and integrating complex systems.
Technologies and Other Constraints
Operating System: CentOS (or REHL); Programming Languages: Python, Java (knowledge in addition languages is not preferred, but beneficial)
This should be a primarily CLI service that takes code submissions over a network connection from the TYPOS platform along with execution parameters. No human interaction should be necessary to execute the code, evaluate the outputs, or provide feedback from the execution.
Functionality
In particular the system will support the following key functions:
- Load and execute student code in instructor-configured sandbox environments built on virtual machines.
- Support instructor-configuration of operational parameters including the inclusion and exclusion of specific libraries, functions, or system calls.
- Support hard resource limits e.g. stack depth, execution time, and memory parameters, which cap execution.
- Support bundling, storage and loading of in-memory files for text, graphics, and data manipulation.
- Storage of operational statistics, code, and output in configurable logfiles.
- Intercept standard input and output streams for the purpose of analyzing compilation errors and providing feedback to students
About BCBSNC
Blue Cross is committed to being a leader in the transformation of healthcare, and seeks to use advanced technology and analytics to better serve the needs of our members and the medical providers who care for them.
Background and Problem Statement
Decades ago we realized that everyone should know CPR. But we have been slow to destigmatize mental health, and to empower people to help when someone reaches out. A CSC Senior Design team started this project in Fall 2019 and created an initial prototype. The goal for this semester is to create an implementation that can have a strong positive impact for students at NCSU and beyond.
Project Description
We seek to deliver a personal solution which meets 2 needs which are 2 sides of the same coin:
- everyone needs behavioral health support at one time or another
- everyone should know how to provide basic behavioral health support if needed.
The goal of MindRoom is to enable privacy and be always available. That is why we focus on a mobile enabled solution. In times of crisis people need resources and guidance they can access and use immediately. End users of MindRoom will be able to learn about CPR for Mental Health, at the times and places of their choosing. They will be able to gain insights and resources for their own use, or to share with others. By positioning the product as a "CPR training" we help to reduce the stigma that would be a factor if the product were positioned solely as something to be downloaded when one is personally seeking help. Users will feel empowered and prepared for anything, whether it is an issue arising in their own lives, or within their circle of friends or family.
This semester’s work on MindRoom will focus on creating:
- Authentication/Authorization for different end-user types
- Progress tracking per user account
- An admin interface for creating training materials with export and import functionality
- Improvements to the navigational system
- Making the assessment data influence the training
Technologies and Other Constraints
ReactJS/Native, etc.
Mobile
Short Description
Today, when it is time to deploy, upgrade, or scale Linux applications, developers and systems administrators typically use commercially supported vendor tools like Docker+Kubernetes, Ansible, Puppet, Terraform, CloudFormation, and other vendor-produced software systems.
Unfortunately, these tools are always rapidly changing and can be time consuming to learn and maintain. If left unattended, automation that worked yesterday may not work a year later. It is very easy for a developer who is wanting to write code to spend much of their day fighting and relearning automation systems. The demands are largest on small projects and small teams of developers - which is also why many projects from this class do not see fully automated cloud deployments, or otherwise, those deployments are often not fully automated.
We aim to create a simple and reliable system, Cloudinator, that combines the automation features of modern IT tooling with the simplicity of deployment methodology from previous generations - it should be possible for a single developer to write automation to cloud-deploy and manage a new service in minutes, and single-handedly maintain dozens or hundreds of different services in production.
The project will be implemented in Python 3, with a very strong ethic of code review and object oriented modular development. Better code and error handling will always be more important than getting more scope accomplished, as we want to set the right foundations as the project grows.
Interested students should ideally have a few people on their team with previous cloud experience and some with previous Python experience, though these don’t have to be the same people. Folks interested in learning about how web app architecture works in production, or IT lifecycle needs in general are very welcome to pick this one up. The scope is reasonably unbounded beyond the required features below, based on how far we want to go, though we would in many cases rather hone the initial use cases before adding breadth.
Sponsor Background
This project is being sponsored by CSC492, with hopes that it will be useful to future projects, research, and the larger software development and IT operations community. Michael DeHaan (who created Ansible) will be leading this project.
Possible Workflow
(Please ask us if you have any questions!)
To understand the project, assume a user wants to deploy a real-world application they wrote using Cloudinator. For purposes of this project, this should be a hello world app that minimally reads some value from a database - proof of deploying, scaling, upgrading, and retiring this app can be considered success for a particular cloud.
This application may be something like the CSC492 website software, but it could also be a commercial stack made out of 200 microservices. The idea is this is not a tool for small deployments or big deployments, it should work fairly well for both. Typically, we could see a tool like this being executed by a CI/CD system like Jenkins, but in this case, no CI/CD setup is required for this project.
The user (or another script) will launch the program something like as follows (this can change, of course):
cloudinate <foo.cfg> deploy -t <tier-name>
We are using the word “Tier” somewhat abstractly. A tier might be a horizontally scaled set of cloud instances, or it might be a configuration of a cloud service, like Amazon RDS or an S3 bucket.
This is the command the user will run when rolling out the tier for the first time, but also when upgrading it (if the tier was not marked to be immutable, meaning instances can not be simply replaced).
There should also be a way to remove a service tier.
cloudinate <foo.cfg> retire -t <tier-name>
To best understand the purpose of the program, it is best to understand what foo.cfg must represent structurally. foo.cfg describes part of a cloud environment, composed of multiple named tiers. In a classical web application, there may only be a couple of tiers, but in many datacenter topologies, an application may be composed of hundreds of web services (aka “microservices” - small applications either speaking REST and possibly using a common message bus and multiple databases). Application tiers are often horizontally scaled, or “load balanced”, where requests are routed to one of many server instances.
So, let’s assume we have defined in a foo.cfg (conceptually, again this can and probably will change to something better), a config file like so, describing these tiers:
- appFoo:
type: aws/asg
region: us-east-1
load_balancer: appFoo-elb
tags: [ ‘appFoo’ ]
key_name: ssh-key-pair-name
size: 10
image_id: asdf-12345
machine_type: t2.small
content: [ ‘src’, ‘/opt/deploy/appFoo/src’ ]
init: [ ‘appFoo/init/’, ‘init.sh’ ]
upgrade: [ ‘appFoo/deploy/’, ‘upgrade.sh’ ]
upgradeable: False
check: [ ‘appFoo/test’, ‘check.sh’ ]
- database:
type: aws/rds
region: us-east-1
flavor: postgresql
size: …
backup_interval: …
upgrade_tier: appFoo
upgrade: [ ‘ schema/’, ‘upgrade.sh’ ]
We have probably left out some important things, but that’s a general sketch. For instance, if defining a set of physical (non-cloud) machines in a tier we might have this:
- appFoo:
type: physical/address
Machines:
asdf-101.example.com
asdf-102.example.com
asdf-103.example.com
load_balancer: None
content: [ ‘src’, ‘/opt/deploy/appFoo/src’ ]
init: [ ‘appFoo/init/’, ‘init.sh’ ]
upgrade: [ ‘appFoo/deploy/’, ‘upgrade.sh’ ]
upgradeable: False
check: [ ‘appFoo/test’, ‘check.sh’ ]
To better understand, let’s walk through a lifecycle scenario using the above hypothetical config file (which can change!):
cloudinate <deploy.sh> deploy -t appFoo
First off, assume there was no autoscaling group attached to the app foo ELB. In this scenario, cloudinate will create a new cloud autoscaling group, perhaps named “appFoo-asg” and attach it to the given load balancer (“ELB”). It will then request 10 images be created under the autoscaling group with the requested machine size and image. Next, it will push the content in src to the remote machine in the /opt/deploy/appFoo directory. It will then transfer the content of the “init” directory to /opt/cloudinator/init/ on the remote machines, and then run the “init.sh” command as root on the remote machines. Any errors on any of the instances will be shown, and result in a failure of the program.
Later, let’s assume the user wants to add more capacity, and changes “size” to 15. When run, the application will notice that it needs to deploy 5 new instances. Since the tier is marked non-upgradable, to do this, cloudinate will create a new ASG with *15* new instances (using the process above), run a provided check script to make sure the new instances are ready to switch over, and then attaching the new ASG to the ELB “appFoo-elb”, and then *delete* the previous 5 instances. This is typically called a “blue/green” deployment because it atomically replaces the application with a new version, which the user never seeing a mix of versions.
Sometimes machines in corporate deployments must be upgraded rather than replaced. If the tier was instead marked upgradable, this would be treated differently. Instead, we would add 5 new machines, run the content and “init” steps on them, and then run the “upgrade/” step on the other 10 machines, taking 1 machine out of the load balancer each time as we do the update. Finally, we would put the new 5 machines into the load balancer. This is typically called a “rolling” upgrade, and is typically what is done on bare metal hardware.
If we are upgrading in-place, we also can’t *just* replace the software (replacing files that are in use could possibly break applications that are not well coded for it), what we really need to do is deploy it to another location and symlink it… then “flip” the symlink of the actual application to the new version.
As we build this system, there should be a generic “LoadBalancer” class with subclasses for Amazon, Google, and so on. The test application for integration tests can be a real “hello world” application that reads a simple key/value pair from a database.
So, we’ve talked about updating compute nodes, but what about the databases or other abstract services (like perhaps S3?). Let’s give a database example.
cloudinate <dpeloy.cfg> deploy -t database
For creation of the resource? If the database is not there, it should create it using AWS API library calls. If any parameters need to be changed, it needs to change the ones it can, and report back on the ones it cannot.New versions of the application also often require schema migrations that cannot always be run directly on the database machines. In this case, the “upgrade_tier” directive will look for one of the machines in “appFoo”, push the “upgrade/” directory to that machine, and then run “upgrade.sh”.
What about this “check” feature?
The “check” in the above example can be used to push a test program to the remote machines and see if the test program returns a valid exit code. Any remote output should be reported.
What about retirement?
cloudinate <deploy.cfg> retire -t appFoo
This is pretty simple, we just delete any machines beneath the attached ASG and then remove the ASG.
We’ll also need a few more commands to make life easier, and probably a lot of different options in the config file and command line, and we can figure this out as we go along.
We see we can control all the tiers manually, so to make this really simple, we should also be able to do:
cloudinate <deploy.cfg> deploy -t ALL
Additional Cloud And Bare Metal Support
The first step is supporting AWS, but we should also support a manual list of IP addresses (such as running against two or three NCSU VMs) and Google Cloud. Supporting creation of S3 buckets as a “tier” also seems easy. The NCSU VM project doesn’t require load balancing, but the application should be expandable to also use things like F5 hardware load balancers with the appropriate plugins added by a future team.
Constraints/Preferences
This may sound like a lot to work with, but APIs and common Linux are provided to make most things easy, and your sponsor has decades of experience building IT automation systems.
- The application will be written in Python3
- All cloud communication for manipulating resources will happen through cloud libraries like boto, rather than using vendor tools like ansible, puppet, CloudFormation, or Terraform. The application will not use docker or containers.
- Everything should be very modular and well abstracted with a strong emphasis on code quality and error handling for all foreseeable error paths.
- Files will be moved to the remote machine using a configurable SSH/synchronization method, though the first one should just use rsync and pdssh for simplicity, and alternative methods don’t have to be implemented. If ambitious - perhaps if we complete scope and want to spend time improving performance, we can try making a config option to use “mitogen” instead. (I can lend some example code).
- For simplicity, machine authentication will assume the user has already added SSH keys via ssh-agent. Cloud authentication will go through vendor-suggested means, like AWS Credentials Files.
About Microsoft
For more than 40 years Microsoft has been a world leader in software solutions, driven by the goal of empowering every person and organization to achieve more. They are a world leader in open-source contributions and, despite being one of the most valuable companies in the world, have made philanthropy a cornerstone of their corporate culture.
While primarily known for their software products, Microsoft has delved more and more into hardware development over the years with the release of the Xbox game consoles, HoloLens, Surface Books and laptops, and Azure cloud platform. They are currently undertaking the development of the world’s only scalable quantum computing solution. This revolutionary technology will allow the computation of problems that would take a lifetime to solve on today’s most advanced computers, allowing people to find answers to scientific questions previously thought unanswerable.
Background and Problem Statement
Currently, we have a Python implementation of OpenCensus tracing and telemetry. This gives us the ability to track how our users use our Python applications with specific data on tool runtime, user options passed at runtime, error and exception reporting, collating, and more. We then use an exporter to take that data at run time and send it to Azure Monitor - this lets us build reporting views, queries, etc using existing Azure tools like Azure Data Explorer queries and Power BI dashboards.
In addition to the implementation above, we have built a desktop Electron application that we would like integrated with telemetry. This application runs as a Node.JS application written in Typescript, from which we implement React as well as Microsoft Fabric UI to build an application with many different kinds of user input (buttons, combo boxes, text fields, tables, etc). There is a lot of value in tracking user engagement and activity within this application and would like to have telemetry integrated with this data as well.
Project Description
This project would be to enable OpenCensus telemetry from a Node.JS/Javascript/Typescript client (the user interface) exporting to Azure Monitor. The goal is to add this exporter to the existing OpenCensus set of exporters for Node.JS on GitHub for Microsoft and others to benefit from.With this exporter, our data can live in the same Azure Monitor instances and we can collate information between the various programs (via spans and other OpenCensus concepts).
Additionally, OpenCensus has the concept of a “zPage”, which is an in-process web page to display collected data from the process they are attached to. This allows for development with OpenCensus without requiring a backend such as Azure Monitor to determine if the data collection is working as intended. Currently, OpenCensus does not support Python for zPages. A goal for this project would be to also create a zPage for Python processes.
Features include:
The addition of an Azure Monitor exporter for Node.JS usage (as an NPM package)
The ability to export “traces” as well “stats/metrics” to Azure Monitor
Creation of a zPage for Python 3.6+ applications
Potential to use React plugin for telemetry (stretch) --> https://github.com/microsoft/ApplicationInsights-JS/tree/master/extensions/applicationinsights-react-js
There is a lot of value in tracking user engagement and activity within this application - this allows us to understand how the user is using the application. Should we be making design changes based on these interactions and if a user runs into issues, we can easily retrace steps to understand where to start looking for errors, etc.
Technologies and Other Constraints
- Typescript/Javascript
- Python 3.6+
- Node.JS
- OpenCensus
- React (optional)
Flexible
A Microsoft Azure account with an Azure Monitor account set up to receive telemetry (free accounts can be set up)
About NetApp
NetApp is a hybrid cloud data services and data management company. Most of NetApp products use Ontap operating system that is a combination of NetApp proprietary kernel, customized FreeBSD kernel, and many kernel services. This project is to understand and improve the performance of the firewall in FreeBSD kernel.
Background and Problem Statement
‘ipfw’ is FreeBSD on-box firewall through which network admin can control ingress and egress packets for various protocols such as TCP, UDP, and ICMP. NetApp uses ‘ipfw’ to selectively allow connections into and out of NetApp Controller. NetApp also uses ‘ipfw’ (with ‘dummynet’) as a traffic shaper for experiment and internal testing. The usage of ‘ipfw’ in NetApp is currently limited to non-performance critical connections such as ssh and snmp for historical reasons, but it is our desire to use ‘ipfw’ for mainstream connections such as NFS, CIFS, etc.
Unfortunately, preliminary investigation within NetApp showed that there was sizable performance degradation when using ‘ipfw’ for controlling mainstream traffic such as NFS. The performance penalty mainly came from sequential rule search that ‘ipfw’ had to perform to match each packet to a firewall rule to apply. NetApp supports deployments with thousands of IP addresses, which may require a large number of firewall rules. With more firewall rules, it is expected that the performance penalty will be even larger.
Because of the complexity and diversity of firewall rules that include different fields and properties of packets and can be of wildcard and/or subnet match, it may not be possible to avoid sequential search of rule set to match a packet to a rule. Therefore, it is required to reduce sequential search as much as possible. We may achieve this by reducing the number of firewall rules to install for a given number of IP addresses (> 500) using items such as an ipfw lookup table. Another option, which is more relevant to this project, would be to do a sequential rule search for connection setup packets (i.e. SYN, SYN-ACK, and ACK in TCP case) but avoid sequential rule match for data packets via stateful functionality of 'ipfw'.
Project Description
The goal of this project is improve 'ipfw', FreeBSD firewall, to perform better. Detailed work to be done is as follows:
- Set the performance baseline of 'ipfw' with several thousands firewall rules. iperf can be used to measure performance.
- Modify 'ipfw' to use stateful firewall feature (called dynamic rules in 'ipfw') first and then fall back to sequential rule search only when stateful rule search fails. Measure performance of this change and compare with baseline.
- Modify 'ipfw' stateful firewall implementation to scale better so that it can perform well with 100K connections.
- With stateful firewall used first, we will avoid sequential search for data packets. However, it may still be too slow to do sequential search for connection setup packets. As a stretch goal, we need to find a way to reduce firewall rules to install for a given number of IP addresses (> 500)
The work can apply to stock FreeBSD and enhance FreeBSD performance with firewall protection. This will give end users stronger security without major performance penalty.
Technologies and Other Constraints
- The most important or most challenging part of this project will be understanding of FreeBSD network stack, how ipfw is used by the stack, and design/implementation of ipfw. As the mentor of this project, I will make a good presentation explaining the above and also have in-person sessions to guide students.
- Kernel and networking knowledge in general
- Strong C. No C++ knowledge is required though.
- Being able to use iperf on FreeBSD machines
All work will be done inside FreeBSD kernel. No CLI or GUI change will be required.
About physIQ, Inc.
PhysIQ is a company dedicated to enabling proactive care delivery models through pinpointIQ™, its highly scalable cloud-based platform for personalized physiology analytics. Our FDA 510(k)-cleared data analytics platform is designed to process multiple vital signs from wearable sensors to create a personalized dynamic baseline for each individual. By mapping vital sign relationships this way, PhysIQ’s analytics detect subtle deviations that may be a precursor to disease exacerbation or change in health. With applications in both healthcare and clinical trial support, physIQ is transforming continuous physiological data into insight for providers, health systems, payers and pharmaceutical and medical device companies.
Background and Problem Statement
There are several technology trends converging in healthcare right now: miniaturization of electronics, battery improvements, wireless coverage/5G, and cloud computing. The result will be huge advancements in the possibilities for real time analytics of physiological metrics.
While this is exciting, there are many challenges productizing these types of systems. Among those is testing the performance and resilience of systems that consume data from a large number of IoT clients. Many open source projects exist for performance and load testing (Gatling, JMeter, Locust, et al.) but there are not yet many good ways to extend them to simulate stateful streaming data sources with real world connections.
Project Description
The engineering team at physIQ currently uses the open source Locust framework (https://locust.io/) to stress test our data platform. Locust has a number of advantages among load testing tools
- Rather than processes or threads, it is built on gevent and uses lightweight coroutines to simulate users
- Virtual user behaviors are defined in code instead of config
- It is easily extensible to different types of tests and protocols
- Load can be easily scaled up by adding additional clients to distributed tests
However, there are specific challenges when simulated IoT workloads like the ones that physIQ deals with.
* The data that is uploaded is binary time series data and is stateful
* The source of data is a phone that is connected to one or more healthcare sensors over bluetooth. The phone can be out of range of cellular networks, the phone can be out of range of the sensor, or a combination of the two. Both can have different caching capacities and buffer flushing strategies.
* We may want to have different cohorts in a test. For example, half of the virtual users might be sedentary and always connected to a cellular network and their sensor, but the other half might (for example) be randomly out of cell range N times a day with a duration following a Poisson distribution.
* We may have better or worse cellular connections, and may want to simulate bandwidth throttling at random intervals for some virtual users.
Assignment
PhysIQ will supply an environment, binary time series test data, and a Python SDK to run performance tests on. The goal of this project is to:
- Extend Locust to create a reusable IoT locust that will simulate workloads described in the overview
- Configuration describing the frequency and duration of out of range events between phones and cellular networks
- Configuration describing the frequency and duration of out of range events between bluetooth sensors and phones
- Configuration buffering flushing behavior on phones and sensors (FIFO? LIFO? Interleaved with new data that has priority over buffered data?)
- Configuration describing the throughput rate limits between the sensor and the phone, and the phone and the server (and implement bandwidth throttling)
- Configuration dividing the total virtual users into groups with different configurations (by percentage or specific number)
- Locust stores allow for exporting test results as .csv files. Design a database schema to save test results and extend Locust to save performance test data to a database (sqlite or Redis)
- Locust does not support analyzing results between tests. Design a lightweight web app to pull test results from the database you designed, present results from individual tests, and visualize changes in test results between multiple tests
- Extend the database you designed to export basic system metrics from a monitoring system (Grafana or Prometheus), a schema to store them in your test results database, and visualize them along with data from Locust
- A basic way to orchestrate running a distributed test with an arbitrary test environment, configuration, number of runners, duration, etc.
For stretch goals
- Automate the deployment and execution of a distributed test with a continuous build (CI) system in Kubernetes (for example, https://github.com/GoogleCloudPlatform/distributed-load-testing-using-kubernetes)
- Define a way to configure and trigger fault injection events (eg https://github.com/mlafeldt/chaosmonkey)
This should reduce the overhead to simulating generic IoT workloads for performance testing.
Technologies and Other Constraints
Base load testing framework: locust.io (mandatory, and it is in Python). For persisting test results, PostgreSQL is suggested. Visualizing test results would probably be a Flask server and D3 for visualization (though, consider integrating this with the existing locust web interface), optional otherwise. Automating deployment is flexible and up to students, but should work for static linux instances and be compatible with container based tests running in Kubernetes.
Locust has a web interface, but primarily would be run via linux cli. For presenting tests and comparing them, a web based application would be preferred.
This will be a general purpose solution to a problem we have internally. We will consume the results as OSS, so MIT or Apache 2.0 licensing of the results is all we ask for.
Background
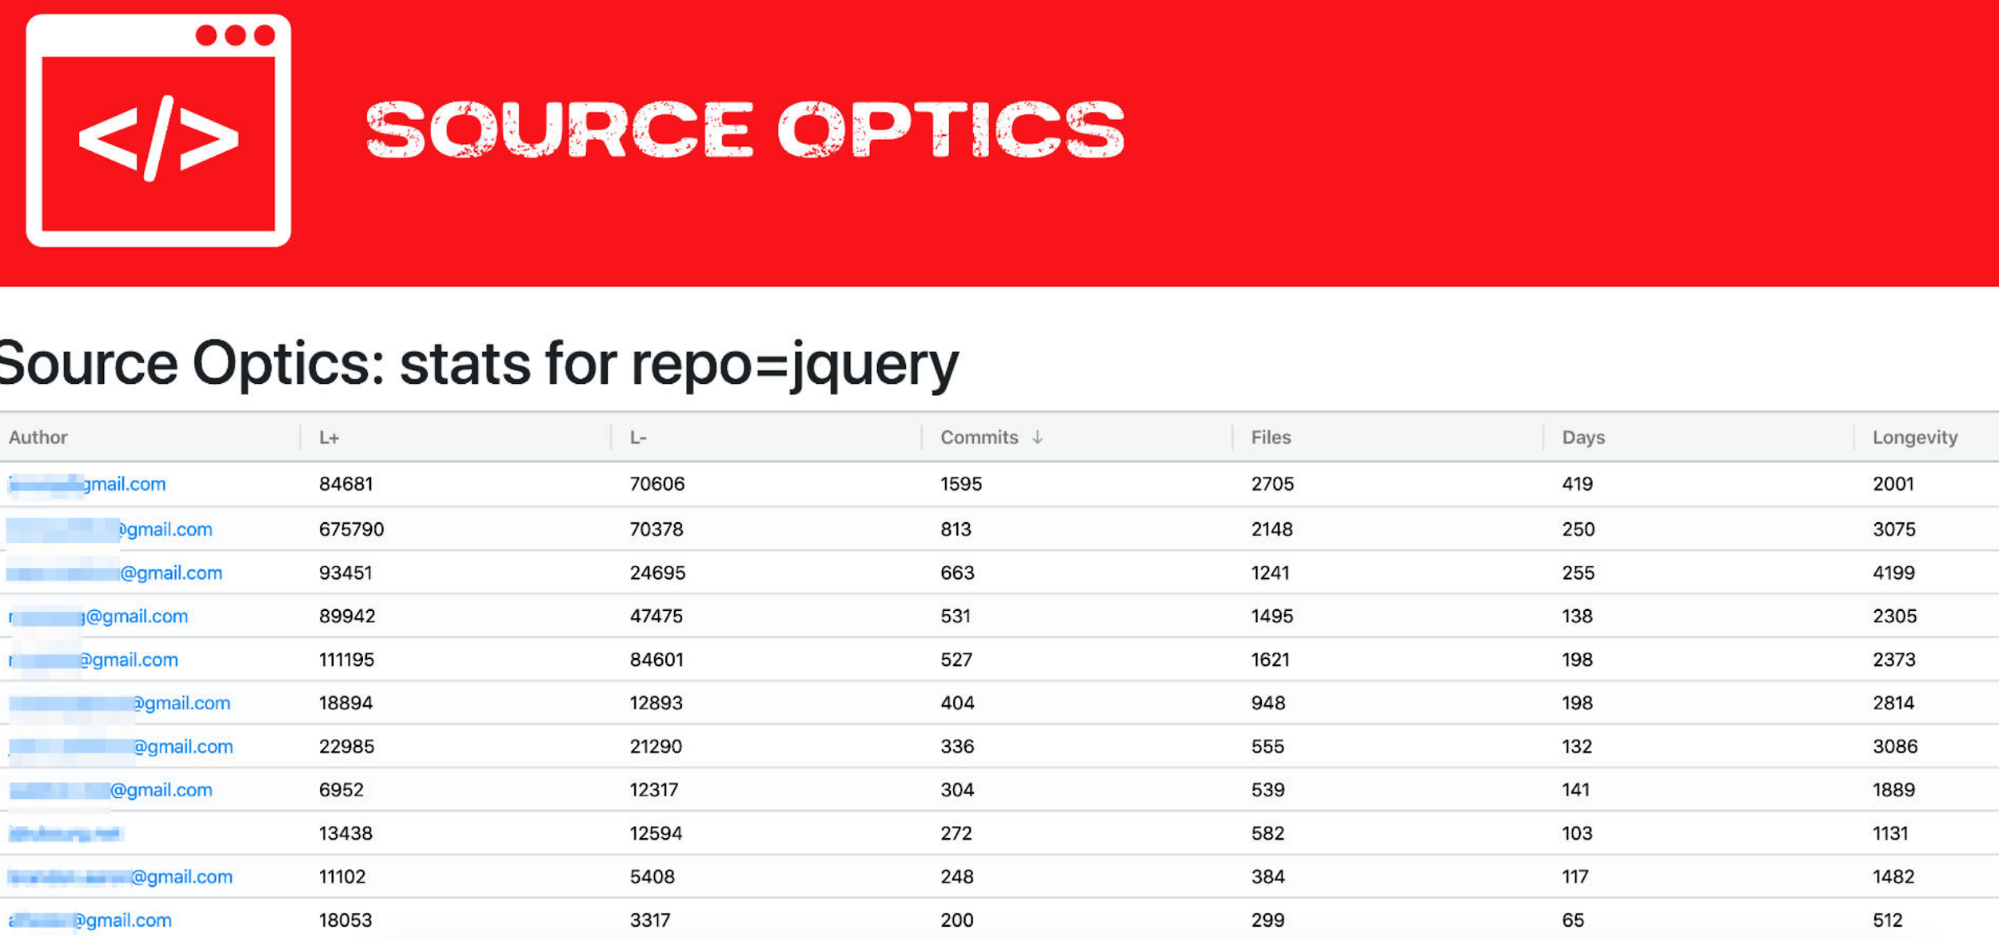
Source control history is an incredibly rich data set that is also not studied frequently or in great depth. Source Optics is a software application that can help managers, developers, and educators visualize and expose patterns hidden in that history. By understanding how software teams operate we can help them to be more productive, and by understanding how teams work on applications, we can tell what areas of those applications are more expensive to maintain.
While useful for generalized research or industrial awareness of source code activity, the foremost purpose of SourceOptics is to keep tabs on all of the exciting projects going on in CSC492. The project was started by the NCSU Senior Design Center as a class project in Spring 2018. In the Fall of 2019, we used a version of SourceOptics to study a section of our class and decide how the program needed to adapt to be more effective. For Spring 2020, we’ll be using another iteration of this class project to improve on the application based on that experience.
Our goals for this semester are all around making SourceOptics an excellent program for tracking team dynamics in CSC492.
A team interested in this project should be one who is possibly interested in statistics, database-backed applications, graph visualization, and production web application architecture. All ideas below are reasonably open ended, and *better* suggestions than the ones below will be considered. If the team is able to get through with some of the earlier tasks quickly, the potential for where this project can go is reasonably unbounded, allowing some room for some deeper data analysis, among other ideas. If we find some particular parts of the data are more interesting we may take more time in exploring those areas.
For more information on SourceOptics (including the code itself), see http://sourceoptics.io/
- Team Punchcard View
We have found that the existing tabular views and 2D graphs don’t provide humans with a good way to visualize evenness of contributions in student projects.
We propose implementing a punchcard view for the entire team that shows what days each developer has a commit (or ideally, how many commits on that day), shown at the same time with other developers on the team.
Keep in mind SourceOptics can be used in teams of 1000s of developers, so this UI will require pagination and search capabilities to avoid overloading the browser. The page should also show the total number of commits per developer as an integer, along with their number of days each user was active, and some other aggregate stats.
The existing REST API for SourceOptics may need to be extended to make implementation of this view easier and efficient.
- Log Imports and Log Import View
The SDC system (as you will soon discover) has a feature that allows recording log entries - a user can indicate how many hours, a type of activity, and a description for each log entry.
SourceOptics already has a commit feed, which shows commits per author on a repository.
What we would like to see is a side by side view, either infinitely scrollable or paginated, that shows commits side by side with log entries. In having this available, it will be easier to understand development and non-development activity in context.
This will require adding a new “UserLog” table to the database, and a new Django management command to load the logs from a JSON file. The actual interaction with the CSC492 submissions software (aka sdc.csc.ncsu.edu) may be sorted out at a later date and will remain external to the project.
In addition to recording the logs, the “scan” process should count the user logs and calculate how many hours (as well as total log entries) are made in each period, allowing the log entries to appear in the 2D graph views and statistical views.
For instance, it may be useful to show on the new “data explorer” view below (3), a mapping of hours worked vs commits and show how both change in proportion over time.
- (3D?) Data Explorer View
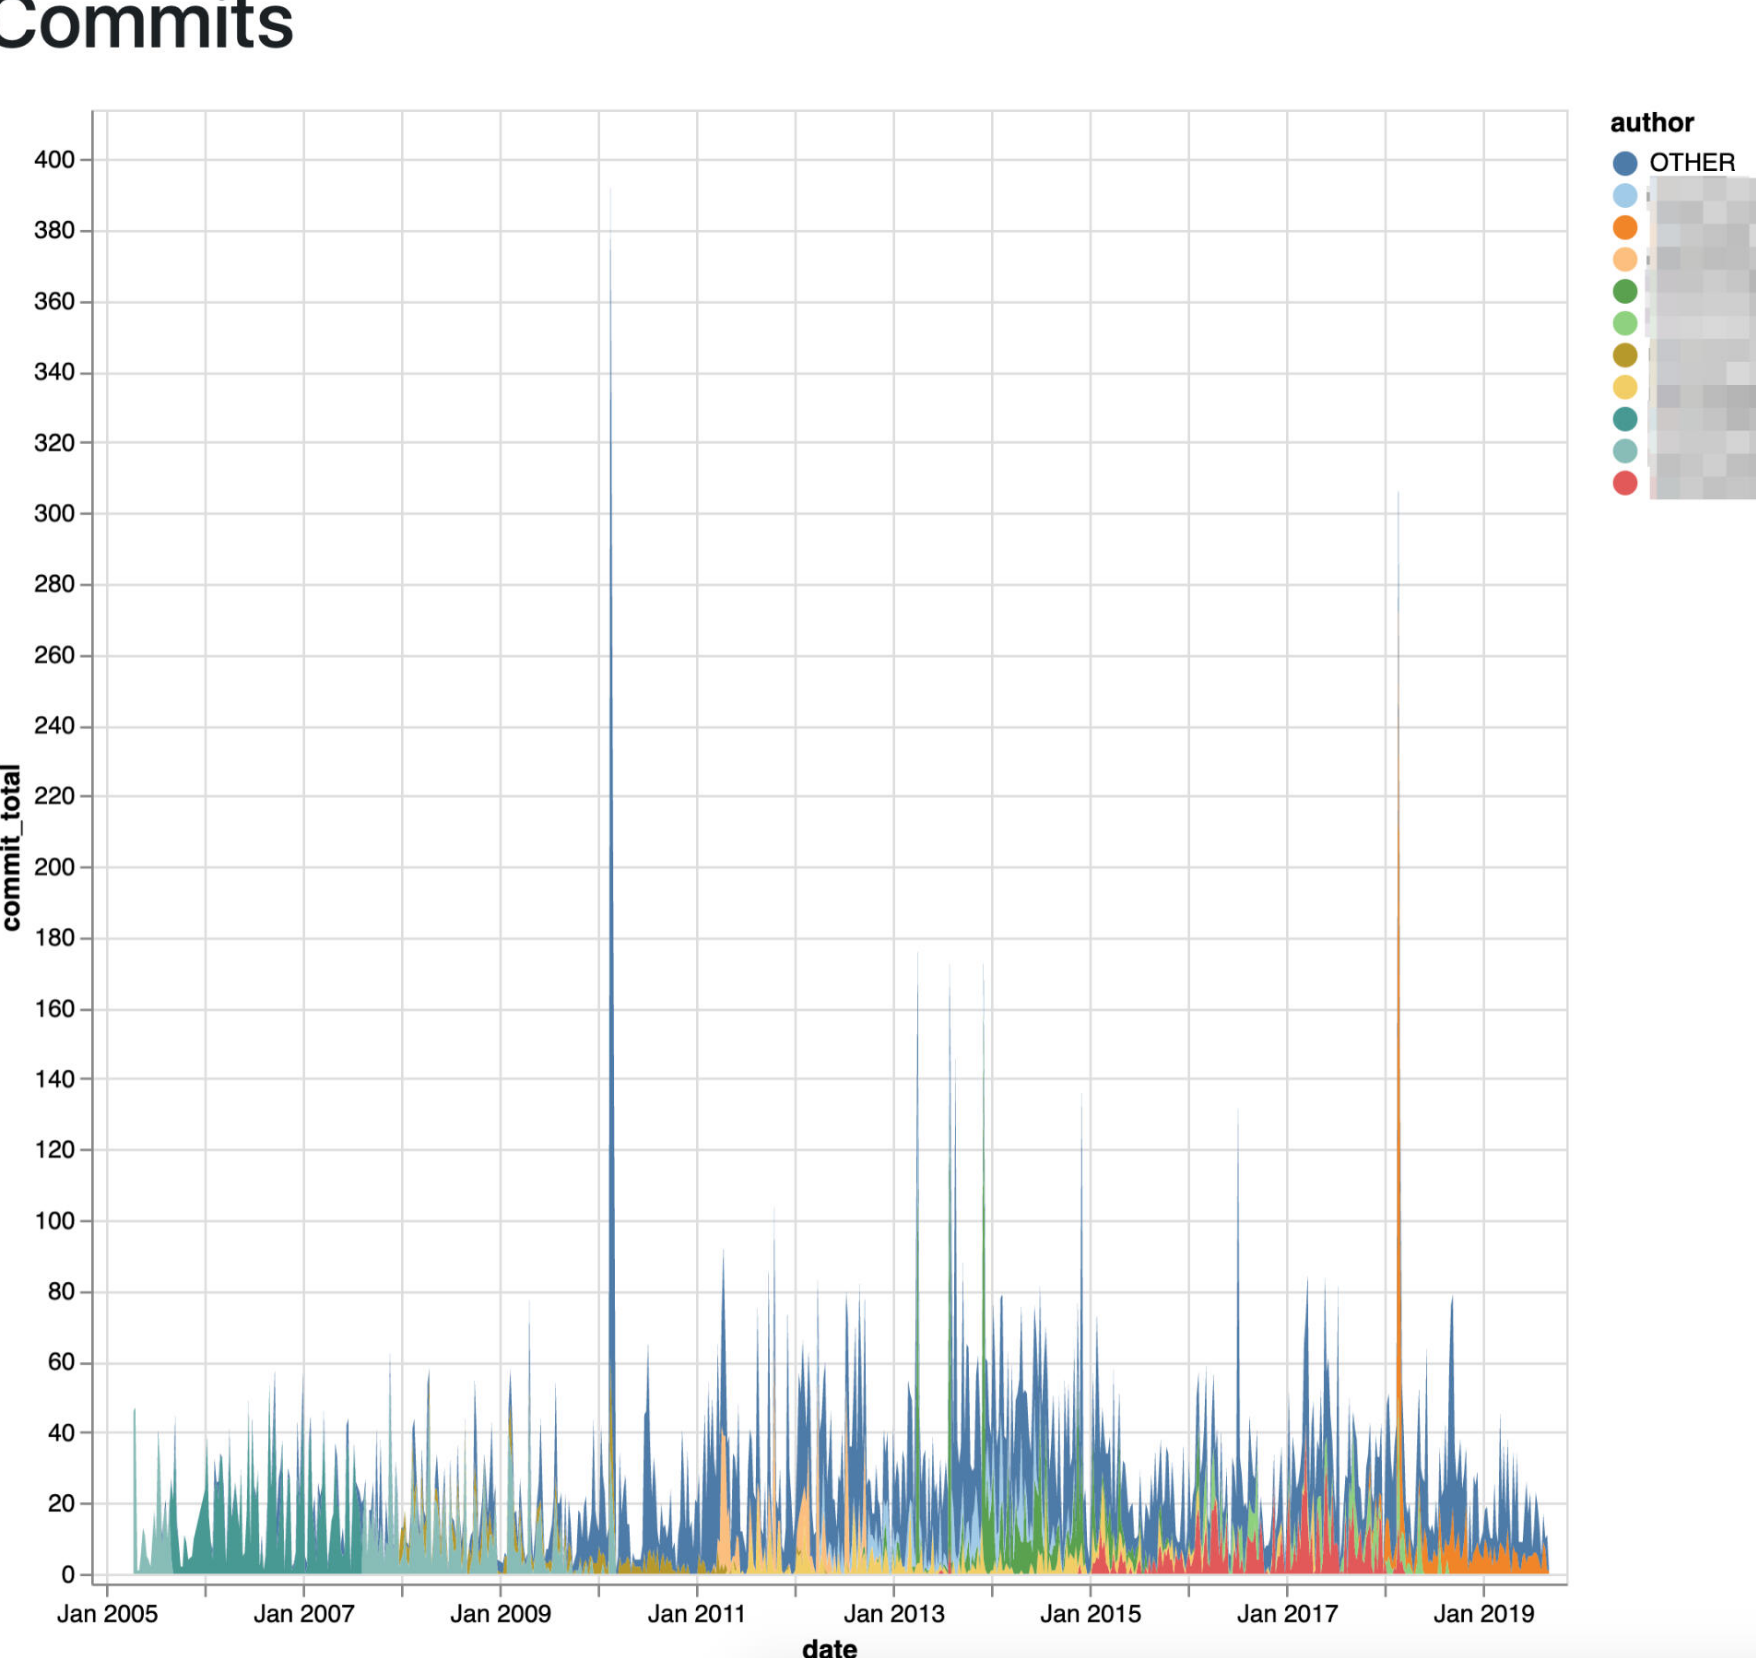
The SourceOptics system exposes a lot of statistics which are less meaningful when shown as a single developer “X over time” graph that presently exists, but “X vs Y vs time” becomes very interesting. We’ve already experimented with 3D graphs and scatter charts but haven’t found a perfect solution.
As an example, to understand work applied by a developer, “commits vs unique files edited per period vs time” becomes an interesting graph. This becomes even more interesting when showing traces for multiple developers on the same graph. However, with a large number of contributors or erratic patterns, this is hard to visualize in a 3D graph, particularly with a screenshot.
This task involves finding a way to augment the existing graphs page with three dimensional data, finding out whether a different approach to 3D graphs work best or 2D scatter plots with a widget to change the time axis.
After discovering what graphs are the most meaningful, SourceOptics should dipslay the top 4 or 5 most interesting variants in this new view.
- File Activity Explorer
The system contains a fairly rudimentary report that shows the change history of each file in a hierarchy as a graph over time. (Or at least, the database has all of this - this UI has some current problems).
However, what we really want to see is a “time scrubber” style view that shows the most active list of files - with their most active developers - over time. The user could scrub across the timeline and tell what areas of the app were most active.
This would help us see how a project evolved - was most work done on the front end vs the backend in the beginning, and did it shift more towards the backend over time? Who are the most active developers in each component as we adjust the “time scrubber”?
What are the best ways to present this data?
The REST API for the system should most definitely be expanded to make this feature easy to implement.
As with the other features, mockups should be used during the design phase to come up with a most optimal way to find conclusions about the data.
- Access Control and Org Admin Views
The SourceOptics is already designed with the concept of “organizations” (which allows grouping software repositories by class or industry department), though in a deployed-to-cloud capacity, we would want to make sure that certain precautions are taken to make this more secure.
The most basic feature is that we should require a user to login to view all pages in the system, as well as administer the system.
We need to continue to allow a (Django) superuser to create organizations - but there should also be a way to designate users as less-powerful organizational admins, and organizational admins need to be able to do everything inside of their organization, but not create and delete organizations.
Some level of trustworthiness is still assumed. Our goal here is to allow *trusted* users of a department to share a system, not to create a web system that would allow users from different universities or companies to share.
In implementing these features, it is important to make sure the REST API is also authorization restricted, to protect student data.
(Actions with side effects, like imports of student repos or kicking off a new scan will likely remain a manual process for now, but might be a feature depending on how far the team gets)
It may be possible to create these views using Django Admin to avoid adding a lot of extra code, and if so, a pragmatic approach to this feature is quite acceptable.
- Basic Deployment Automation
SourceOptics is easy to run from a laptop but we cannot expect many professors to set it up, so we want to move towards having a common install for the department.
This would involve creating deployment automation that would assume a list of IP addresses for web servers, database servers, and worker nodes (all different) and both be able to install the application and upgrade the database schema.
This deployment automation should not be cloud specific, as it is most likely going to be used against the NCSU VMWare cluster.
While it is quite possible to use a popular deployment framework for this exercise, to keep things simple and easy to work on, this should just use simple bash scripts and ssh, and target a minimally configured install of the latest Ubuntu LTS release.
- Stretch Goals: Existing UI Upgrades
Revisit the tabular views such as the commit feed pages and developer stats, and improve them as you would suggest.
How should the 2D graphs be improved? Give your recommendations based on analysis of both large and small projects, to make them more useful and informative.
- Stretch Goals: Web Based Organization Import and Repo Sync
It should be possible to import organizations from GitHub from the web interface and also sync repositories, browsing any history or output from the sync command, without using the command line tool. This will involve moving the management commands, most likely to celery. In the event of any repository errors or other exceptions, the status and history of any errors should be clearly viewable from the web interface. Because some of the SSH and git operations *may* go interactive, some extra care may need to be taken to allow these to be backgrounded.
Testing
Currently SourceOptics does *not* have active tests. Any tests produced should largely be automated python functional tests against the REST API and web page data. These can work off of skeleton commit data, rather than tracking existing real-world repositories, which are difficult because they are often constantly changing.
Constraints, Approach, And Preferences
This project uses Python 3, PostgreSQL, and Django.
To keep things simple to understand and maintain, we avoid large-scale web frameworks like Angular or React, but do use framework-agnostic components like Altair (Python graphing through vega-lite) and AgGrid (a table component). We want to minimize javascript where possible (hence altair), but using javascript is ok as long as it is well written. Any visualization tools that doesn’t bring in complexity on the level of Angular or React or Vue can still be considered - such as adding new graph libraries.
Maintainability and reliability is very important - changes that edit the existing codebase should be done in such a way to make them easy to merge, and ideally merges with upstream should happen multiple times in the course of a semester with seperate feature branches used for the major stories/themes.
All code should be commented at a *basic* level (a line or two per file and function at minimum), but mostly implemented to make sure it is exceptionally easy to understand. Small methods and well-named variables are strongly encouraged. Code quality is more important than development velocity, and code review with the project sponsors (us) will be pretty frequent.
There are a fair amount of features on this list, and if necessary we do not need to complete all of them, but it should be possible to build up a “divide and conquer” approach to work on multiple features at the same time.
BlackBerry QNX
About BlackBerry
BlackBerry is an enterprise software and services company focused on securing and managing IoT endpoints. The company does this with BlackBerry Secure, an end-to-end Enterprise of Things platform, comprised of its enterprise communication and collaboration software and safety-certified embedded solutions.
Based in Waterloo, Ontario, BlackBerry was founded in 1984 and operates in North America, Europe, Asia, Australia, Middle East, Latin America and Africa. For more information visit BlackBerry.com
About QNX
Customers rely on QNX to help build products that enhance their brand characteristics – innovative, high-quality, dependable. Global leaders like Cisco, Delphi, General Electric, Siemens, and Thales have discovered QNX Software Systems gives them the only software platform upon which to build reliable, scalable, and high-performance applications for markets such as telecommunications, automotive, medical instrumentation, automation, security, and more.
QNX software is now embedded in 120 million cars that are on the road today. Automotive OEMs and tier ones use BlackBerry QNX technology in the advanced driver assistance systems, digital instrument clusters, connectivity modules, handsfree systems, and infotainment systems that appear in car brands, including Audi, BMW, Ford, GM, Honda, Hyundai, Jaguar Land Rover, KIA, Maserati, Mercedes-Benz, Porsche, Toyota, and Volkswagen.
Background and Problem Statement
BlackBerry QNX technology includes QNX Neutrino OS and many middleware components. BlackBerry has decades of experience in powering mission-critical embedded systems in automotive and other industries. As the leader in safety-certified, secure, and reliable software for the automotive industry, BlackBerry currently provides OEMs around the world with state-of-the-art technology to protect hardware, software, applications and end-to-end systems from cyberattacks.
For Self-Driving Cars, functional safety is part of the overall safety of a system or piece of equipment and generally focuses on electronics and related software. As vehicles become increasingly connected and reliant on software, new threats emerge. Therefore, it is imperative that it operate safely, even when things go wrong. A self-driving car is an extremely complex system with state-of-the-art technologies. Proving that the system does what it is designed to do is a great challenge. And it must do so in a wide range of situations and weather conditions. This requires a stable, secure and efficient operating system.
To ensure mission critical reliability, BlackBerry QNX continually performs extensive automated testing of their software components by executing hundreds of thousands of tests daily. Virtual machines are used for testing when possible, but hardware targets generally perform faster and are necessary for many tests configurations. However, it is not feasible to provide every developer and tester with their own hardware because of the diversity of customer hardware and development boards that QNX OS supports, and economically – with board cost ranging from $50 to more than $15,000 each. To facilitate the sharing of hardware, a simple booking system was quickly setup many years ago, but as the company has grown, we realize that the features of this rudimentary booking system needs an overhaul to facilitate higher utilization of the hardware.
Project Description
BlackBerry would like to work with an NC State senior design team to design and develop a new booking system for managing hardware development board reservations. The system should implement a modified FIFO queue, allowing for high priority requests to be approved and take precedence over normal pending reservations request, as well as allowing automated test systems to locate and utilize development boards that are sitting idle.
The user interface will be implemented into the BlackFish Web Application that BlackBerry QNX has implemented with the help of previous NC State senior design teams over the last few semesters. BlackFish is a micro-frontend application composed with OpenComponents in Angular 7 for the front end, with a Node.js/Express backend, connected to a MongoDB server.
Other desired features to be incorporated into the new booking system include:
- Reservation of either specific hardware or hardware with specific attributes
- Restricting reservations of an individual board to specific users or a group of users
- Regularly scheduled windows of time where boards cannot be reserved
- Time limited reservation windows
- Options to extend reservation time under certain conditions
- UI for managing boards, reservations, approvals, etc. with real-time updates (website automatically refreshed).
- Notifications (emails) sent to users and admins
- Statistics collected and visualized in the UI showing utilization of hardware
This improved booking system will allow BlackBerry QNX to more efficiently utilize the limited test development board resources available. It will also reduce the amount of manual work currently required by users who need to escalate testing for a high priority customer and reduce the instances when a user forgets to release a board after they are finished with their work.
Technologies and Other Constraints
Some prior experience developing web (server-client) applications is strongly recommended for this project.
Members of the team would be expected to have or learn the following skills:
- JavaScript/Node.js
- Angular
- JSON
- HTML
- REST API
- MongoDB (Basic database experience suggested)
- Version Control System (Git)
The UI must be written in a language supported by modern web browsers; a modern JavaScript framework is strongly suggested. Any additions or updates to current code base must run on Linux and Windows OSes.
Web-based
Students will be required to sign Non-Disclosure Agreements and sign over IP to BlackBerry when the team is formed.
What is Bugle: Bugle is an application and website that enables volunteer event organizers to easily manage volunteer events. Bugle provides a robust suite of project management tools to simplify the unique challenge of organizing a volunteer event. Bugle also helps volunteers find service opportunities within their community. Volunteers can search for events by category, location, and time. Bugle’s services are free for organizations hosting volunteer events as well as volunteers looking for them. Bugle is a non-profit organization committed to making volunteering easier.
Users:
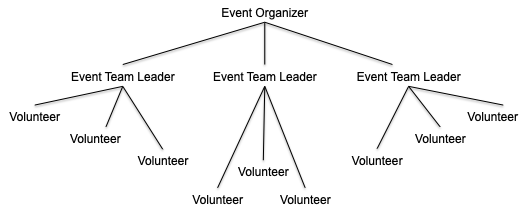
- Event Organizer (event host)
- Event Team Leaders (volunteers who are selected to assist with organizing an event)
- Volunteers
Concept: The senior projects student team will develop Bugle’s Interactive Tracker and continue where the previous Senior Design team left off. The Interactive Tracker is a feature of Bugle’s project management software that helps Event Organizers communicate the needs of a volunteer event with their Event Team Leaders and Volunteers. The software fulfills two basic demands of organizing a large volunteer event, pre-event coordination and during-event coordination.
Pre-Event Coordination
Prior to the beginning of any event, it is necessary to address the event’s logistical requirements and determine who will be responsible for them. Who will bring the chairs and tables? Who will submit for the city permit? Who will coordinate for medical coverage? The Interactive Tracker allows an Event Organizer to list all of the tasks that need to be completed prior to an event’s start. The Event Organizer can then assign each prerequisite task to an Event Team Leader. Once a task has been assigned, the Event Team Leader can update the task’s status (Complete, In-Progress, Not Started) as well as provide additional information by leaving a comment. In this way, each task will also serve as a bulletin board, updating users on what complications may be impeding progress and/or what challenges have been overcome.
During-Event Coordination
During a volunteer event, the Interactive Tracker allows the all users to track progress of an event. This feature will be particularly helpful for larger events like Relay for Life, where an event coordinator is managing hundreds of volunteers and a wide range of resources. As the Event Organizer creates tasks to be completed during an event, the Interactive Tracker will consolidate these tasks and build an event itinerary. The Interactive Tracker will annotate the status of each task that has been completed up until that point, and which tasks are remaining. Each task can either be set to start at a particular time, when other tasks are completed- requiring tasks to be completed in sequence. When a task, in sequence, is completed, the Event Team Leader responsible for the upcoming task will receive a notification to begin their task. For example, at Relay for Life, an Event Team Leader responsible for coordinating with the medical coverage team marks the task, “Medical Tent Set-Up,” as complete. Immediately, the Event Team Leader responsible for overseeing Relay for Life’s opening lap receives a notification that it is time to begin the opening lap. This sequencing is designed to cut back on the constant walkie-talkie chatter and replace the clipboard carried checklists that are prevalent during large volunteer events.
Purpose: The interactive tracker seeks to reduce the number of meetings required to put a volunteer event together and provide greater organization during large volunteer events.
Functionality
- Event Organizers select Volunteers who have signed up for an event to serve as Event Team Leaders
- Event Organizers can assign tasks to all users
- Event Organizers and Event Team Leaders can assign themselves to tasks
- All users can view event tasks and their statuses
- All users can select to only see the tasks that have been assigned to them
- All users can leave comments on tasks and tag other users within the comments
- Users tagged in task comments will receive a notification
Pre-Event Coordination
- Event Organizers and Event Team Leaders can create tasks
- Event Team Leaders can assign tasks to other Event Team Leaders as well as any Volunteer within their team
- Event Organizers and Event Team Leaders are notified when a task they’ve assigned is completed
- Each task will reflect one of three statuses: Complete (Green), In-Process (Amber), Not Started (Red)
During-Event Coordination
- Event Organizers can create tasks
- Event Organizers can give Event Team Leaders permissions to create tasks
- Event Organizers/Event Team Leaders will select whether a task will begin at a set time or contingent upon the completion of other tasks
- The Interactive Tracker will generate an event timeline
- Event Team Leaders will be notified when it is time for their task to begin
- The Interactive Tracker will display the overall status of the event, listing the tasks that have been complete, the tasks that are in progress, and the tasks that have yet to begin
Technology: Mobile-app developed for Android and iOS written in React Native.
Overview
In this project, students will research and implement several approaches to using Spark to
process large amounts of data. Spark is a popular system for managing data processing across a
cluster of machines, and there are many ways to use it. The goal of the project is to provide
IBM with a comparison of several approaches and recommendations for key architectural
decisions of using Spark. In particular, students will consider options for loading data,
componentization and maintenance of code, and overall data processing performance, among
others. A key part of the project will be measuring and visualizing the operation of the Spark
cluster as it processes large amounts of data.
Spark provides 2 main approaches for loading data: 1) from a file, 2) streaming via a queueing
service, such as Kafka. In the file-based approach, all data is provided up front and split across
the number of nodes in the system. In the streaming approach, data is provided on demand via
a queue.
In addition, data that has already been loaded into memory (from a file or by streaming) can be
shared within the Spark cluster via “dataframe” references. This approach requires the Spark
application to be provided as a library to the caller. There is presumably a performance benefit
with this approach as the data is already loaded into memory. However, a downside is that the
libraries must be versioned and managed as an asset rather than be provided as a service.
This project will help IBM understand the ramifications of these choices in a way that is backed
up by actual measurements of a running Spark cluster as it processes a large data set.
Data
In our use case we have tens of millions of header records and each header record has dozens
or perhaps several thousand sub-records. In all, 15 billion records is a good target for
measurements. That is why it is important to study different approaches to processing data,
providing status insights, and recovering from failures when processing these large amounts of
data.
The team should consider various options of public data to use for this project that is similar to
the data described. One option might be data about public Github repos, where each repo is a
header record, and each file (or directory?) is a sub-record. In other words, while IBM cannot
provide actual data or the code to process it, a reasonable substitute would be to use public
data (such as source code) and a relatively CPU-intensive processing step (such as extracting
certain features from source code files).
Students will be required to sign over IP to IBM when the team is formed.
Background
Siemens Healthineers
Siemens Healthineers develops innovations that support better patient outcomes with greater efficiencies, giving providers the confidence they need to meet the clinical, operational and financial challenges of a changing healthcare landscape. As a global leader in medical imaging, laboratory diagnostics, and healthcare information technology, we have a keen understanding of the entire patient care continuum—from prevention and early detection to diagnosis and treatment.
At Siemens Healthineers, our purpose is to enable healthcare providers to increase value by empowering them on their journey towards expanding precision medicine, transforming care delivery, and improving patient experience, all enabled by digitalizing healthcare. An estimated 5 million patients globally benefit every day from our innovative technologies and services in the areas of diagnostic and therapeutic imaging, laboratory diagnostics and molecular medicine, as well as digital health and enterprise services. We are a leading medical technology company with over 170 years of experience and 18,000 patents globally. Through the dedication of more than 48,000 colleagues in over 70 countries, we will continue to innovate and shape the future of healthcare.
Managed Logistics
Our service engineers perform planned and unplanned maintenance on our imaging and diagnostic machines at hospitals and other facilities around the world. Frequently, the engineers order replacement parts. The job of Managed Logistics is to make the process of sending these parts to the engineer as efficient as possible. We help to deliver confidence by getting the right part to the right place at the right time.
Operational Intelligence
In order to keep our logistics operation running as smoothly as possible, the Operational Intelligence (OI) team automates tasks, develops user-friendly software, and gathers as much relevant data as possible for all parts of the supply chain. Over time, the team has collected a wide variety of data sets and is receiving inquiries about the data from both inside and outside the department. While the OI team is capable of provide data analysis, the number of requests are growing. In some cases, the most efficient solution is to give the requestor the data and let them analyze it themselves. The big problem with this, a problem we’re asking you to solve, is that figuring out how to use the data is too complicated for most of our users.
Schema Exploration Tool
We are looking for to provide potential data users with a delightful-to-use tool that helps them dive into the relevant tables and fields. In order to encourage our users to perform their own data analysis, we need more than a dry, boring data dictionary – we need to create a comfortable and intuitive learning experience.
Useful Knowledge
We are open to the tool being either web-based or a stand-alone application. While no knowledge of any specific programming language or framework is required, basic knowledge of SQL is strongly recommended.
Weekly Meetings
Students will get the opportunity to communicate frequently with the OI team, and will also be able to get feedback from a potential end user. We are committed to providing the clarification and feedback necessary to make sure this project is a success.
About Bandwidth
Bandwidth lives for innovation! Our technology powers brands like Google, Microsoft, GoDaddy, Arlo, Netgear, Zoom, Rover and more of the most exciting leaders in technology. Our intelligent voice, messaging, 9-1-1 access, and phone number services— all backed by Bandwidth’s own nationwide, all-IP voice network—allow us to power the way people communicate, connect, and do business.
Background and Problem Statement
Facebook (shared timeline) and Twitter (microblogging) have introduced new modes of communications. Do you want to try to do the same? Slack may be the seed of another potential change in the way we communicate, but is currently constrained to be group text chat with bots. What would it be like if it included more of the media that we use to communicate? What would it be like if Slack channels allowed voice (and video?) communication also, where all voice is transcribed, and all text is spoken to text-disadvantaged users?
Project Description
This project would be about building a system to take in both Voice and Text sources simultaneously to build a common transcript and a new way to communicate. For example, given a shared Slack channel, users could choose to either type directly into the channel as normal, or they can join it via a Voice call. Regardless of their decision, what they say (with their mouths or their keyboards) would be transcribed into the Slack channel to serve as a common ledger. If they’re in the chat as a text user, no problem: they’ll see all the communication (including from the voice users) as text. As for Voice users, they will get it all as Voice read back to them. Either way, it’s all documented, and the communication barrier is reduced even more.
If you’re brave there is more ground to cover… GIF content with sound - sonic emojis, support for other platforms beside Slack (ex. Microsoft Teams, Discord, etc.), integration with third-party services (ex. connecting Jira to understand/interpret Jira task numbers and create hyperlinks), and who knows what sort of bot integration.
Technologies and Other Constraints
We prefer this to be a Slack app written in Python, Java, or Golang, but we are open to all.
Please don’t run afoul of any known licensing, legal or IP constraints that would prevent this project from being used commercially.
About Bank of America
Bank of America provides banking services to millions of customers. Within the security division, we are responsible for protecting the assets for those customers against all possible forms of cyberattack.
Background and Problem Statement
Adversaries that have compromised the credentials of a single user may need to compromise the credentials of other users to reach their target objective. This is sometimes done via lateral phishing attacks–sending phishing emails from the compromised account to people who know the user, and thus are more likely to click on any links, open attachments, etc.
Project Description
The objective of this project is to build a system that detects lateral phishing emails (and therefore that an account has been compromised). This project has the limitations that ground truth is not known (there is no training data) and that only email header information can be used (no email content). This means that previous work on phishing detection generally, and lateral phishing specifically, cannot be directly applied.
This project was started last term by a Senior Design team, who applied machine learning techniques, specifically, knn (k-nearest neighbor) and LOF (linear outlier factor), on header information, including the subject, using the publicly-available Enron email data set. The students will be provided with the code and all associated documentation from last term. Given that the Enron dataset does not contain lateral phishing emails, the team also wrote a script that would allow them to automatically generate such emails with configurable parameters. They found that their approach, using k=5 and looking for outliers using LOF, worked well (> 90% accuracy). As part of this project, they also developed an initial user interface and initial integrations with the graph database Neo4j to provide graphing capabilities demonstration relationships between users (nodes).
This project needs to be extended to include:
- Graph analytics and social network analysis: While the previous students focused on an unsupervised machine learning approach (kNN), the project needs to be extended to include a graph analytics approach leveraging the capabilities of Neo4j. The hypothesis is that a compromised account sending lateral phishing emails will demonstrate differently in terms of social relationships. For example, Alice might often email Bob, and also Eve, but never both together, so suddenly seeing an email to both Bob and Eve might be suspicious. The goal is for the team to leverage the graph analytics capabilities of Neo4j to see what they might be able to extract in terms of social analysis and related anomaly detection.
- Increased scalability: The previous team was able to process 25,000 emails per minute. The current team is challenged to determine if they can improve the scalability of the approach. The desired scalability should be at twice that volume, and preferably 10x that volume. This is for testing only – the training phase can be slower. That is, the use of data to determine the initial algorithms can be slower, but once those algorithms have been established, examining current emails as they are received should be much faster.
- Enhanced user experience leveraging visualizations: The current approach does not leverage advanced visualization capabilities to allow people to see the results, and so the team is challenged to determine advanced visualization capabilities that will allow an end user to understand the data they are using. (For example, see L. van der Maaten and G. Hinton, “Visualizing data using t-SNE,” Journal of Machine Learning Research, vol. 9, pp. 2579–2605, 2008. Available: http://www.jmlr.org/papers/v9/vandermaaten08a.html)
- More rigorous testing: The previous team created a script that would generate lateral phishing emails for test cases, however testing was still ad hoc. This team is encouraged to perform more systematic testing to determine the boundaries of what can be detected as phishing email based solely on header information.
If successful, this project may be applied to bank data in order to provide additional protection against account compromise.
Technologies and Other Constraints
Last semester’s web-based system is containerized in Docker and uses Python, Neo4J, Flask and Jupyter Notebooks. We expect this team to continue using this tech stack, and to recommend other tools as needed.
Students working on this team will need to sign an NDA and release IP rights to the bank.
About Dell EMC
Dell EMC Corporation is the world's leading developer and provider of information infrastructure technology and solutions. We help organizations of every size around the world keep their most essential digital information protected, secure, and continuously available.
Durham Center of Excellence is the premier lab in Dell EMC. Over 40% of all equipment allocated to labs in Dell EMC is at the Durham Center of Excellence. Hundreds of thousands of servers, arrays, and networking switches are tested with millions of manual and automated tests by thousands of engineers every day.
Background and Problem Statement
The IEO Team is charged with configuration management and the ticketing system that is used to maintain that data. Routing tickets such that they get to the person that can address them through the shortest possible path is critical and a complicated task since our infrastructure scales to hundreds of labs and millions of configuration items. Misrouted /delayed tickets are a common problem.
Project Description
The focus of this project is to implement an AI that finds patterns in customer-generated semi-structured ticket data and device data in the Configuration Management Database (CMDB) and outputs ticket routing recommendations. We will provide access to a test instance of ServiceNow with sanitized data. The project being proposed consists of two phases:
Phase One - Routing Recommendation System
The ticket routing recommendation system will work off of a copy of historical ServiceNow ticket/CMDB data on its own database. ServiceNow is a software-as-a-service provider that encompasses a lab ticket management system, asset management, configuration management, and discovery. It has multiple REST-based APIs to pull/post ticket/equipment information from. Using this closed ticket routing history and data associated with them, the system will train an AI with the goal of defining rules that correctly route new customer generated tickets to the correct group/person.
The initial project will pull ticket info like problem descriptions, assignee, etc.. and Configuration Item (CI) data such as owner, device model, type, and category from the lab ServiceNow instance.
Phase Two - ServiceNow integration
Phase 2 is about integrating the recommendations from the AI trained in phase 1 directly into dashboards in ServiceNow. High-level goals of these dashboards are to monitor usage and accuracy of the models as they provide integrated routing recommendations.
About the Game2Learn Lab at NCSU
The Game2Learn lab at NCSU focuses on creating and evaluating educational technologies (games and tutors). Led by Dr. Tiffany Barnes, the Game2Learn group researches the impact of games and data-driven adaptation on learning through a number of innovative approaches. We are particularly motivated by finding ways to embed data-driven artificial intelligence and educational data mining techniques into game and learning environments to support learners and improve our understanding of learning.
Background and Problem Statement
This Counting tutor will be used to provide support for students learning counting and probabilities in discrete mathematics at NCSU, and available to be used for other universities. The goal of this project is to utilize the existing Deep Thought Tutor framework to build a Counting Tutor for students learning combinatorics in discrete math at NCSU. The Counting Tutor will be used to research generalizable intelligent components, so it must share much of the Deep Thought Tutor’s framework. Therefore, the primary challenges of this design are creating a web application (UI and model) that can aid students with and model the solution of combinatorics problems within an existing intelligent tutoring system framework (datalogging, student modelling, and other help).
This system will be used to show that the design of the Deep Thought Tutor, currently used in CSC 226, can be extended to other domains, and allows for easy incorporation of intelligent components. The importance of showing this generalizability is that other researchers and tutoring system designers will be able to use the framework to more easily create their own tutoring systems. The main issues for designing this tutor will be creating the interface and functionality in such a way that supports a variety of counting and probability problems while still being intuitively designed. The modular framework for incorporating intelligent components and logging the student’s actions is already partially designed, but the interface/functionality will need a lot of focus. The framework provides a general guide for how each component within the system should interact, and we can provide examples of the database design of DeepThought to help tailor the database for the Counting Tutor. After the tutor is ready to be deployed, it will be used by 250+ undergraduate students every semester and support multiple people’s dissertation research by allowing them to experiment with new features (hints, worked examples, reminders) and analyze fine-grained student data to determine the impacts of the experiment.
Project Description
The students will be creating a system based on the Deep Thought framework as a reference. The interface and functionality of creating and solving counting and probability problems will be the majority of the work involved. Some problems require multiple rules to be used, which presents problems in designing an interface that can be used for more complicated problems. Furthermore, each action(mostly click-based) a student takes in the tutor will need to be logged. These two tasks will need to be carefully planned to ensure that the student can easily solve the problems, and that the researchers can easily tell what the students were doing in the tutor.
The most important aspect of the tutor will be that it is designed in such a way that will be easy to modify for future research. For example, the tutor may initially be designed to provide the same, static set of problems to each student. In the future, we may modify the tutor to provide specific problems to students based on what would benefit them most (based on output from an AI agent). Another example is that we may provide and add different types of assistance to students, such as hints or worked examples. As researchers experiment with different methods of providing assistance, the modularity of the system will be extremely important to ensure that the system can be updated quickly and with minimal impact to other parts of the system
There are two types of end users: 1) the students who will use the tutor and 2) the researchers who will be conducting experiments within the tutor. The students will benefit from the tutor by having a system that is able to help them practice and learn quicker than self-guided studying
The researchers will benefit from the system by enabling cross-platform research between the already existing tutors such as Deep Thought. Furthermore, this research will help advance educational technology research.
Technologies and other constraints
This will be a web-based app. The current system has a MySQL database, and is written in PHP and Python. We expect students to use these same server-side technologies. Client-side, familiarity with HTML, CSS, and JavaScript will be advantageous. We would like this tool to be easy to maintain by researchers who may not be familiar with much front-end development, but we welcome the use of React (primarily) and similar frameworks (if needed).
At the minimum, this tool should run on current versions of Chrome and Firefox, and is expected to be usable both on desktop and mobile platforms.
About LexisNexis
LexisNexis® InterAction® is a flexible and uniquely-designed CRM platform that drives business development, marketing and increased client satisfaction for legal and professional services firms.
Background and Problem Statement
Maintaining accurate contact information is a time consuming activity. Transcribing contact details from business cards (and from email signatures) is laborious and error prone. An automated mechanism to capture and normalize contact details would streamline the process and increase the quality of the captured data.
Project Description
You should provide a service (or suite of services) to extract contact data from an image of a business card and/or email. LexisNexis will provide test data (images & emails). Here are some use cases:
- A user takes a photograph of a business card at a client meeting. The client's name, role, business name and address, telephone and email details are all captured by the system.
- A user receives an email from a client. The same details as above are collected from a signature block embedded in the email.
Clients could be a) US based, b) based elsewhere in the English-speaking world, c) based in a non-English-speaking country that uses a Latin alphabet (e.g. Germany). We expect that the automated capture of contact data will allow greater data integrity & quality, which in turn will reduce the cost of data management and simplify business processes.
Technologies and other constraints
We expect this to be a service-based solution, with a web-based test framework. Students are welcome to use any open-source OCR and any machine learning techniques for data extraction and normalization. The preferred programming languages to use on this project are C# and/or Python.
The resulting service should have no licencing or IP constraints on use as part of a commercial software product.
Students will be required to sign over IP to Sponsor when the team is formed.
About PRA Health Sciences
PRA Health Sciences provides innovative drug development solutions across all phases and therapeutic areas. But innovation just for the sake of innovation isn’t why we do it. Side by side with our clients, we strive to move drug discovery forward, to help them develop life-saving and life-improving drugs. We help change people’s lives for the better every day. It’s who we are. Innovating to help people is at the heart of our process, but it’s even more than that. It’s also our privilege.
PRA Health Sciences Cybersecurity Team is a small group of professionals that share a passion for the topic. The team is excited to cooperate with NCSU students on the second Phase of the RePlay Honeypots. This semester the goal is to develop a system ready for beta release, that can be deployed at PRA during a summer internship. After a successful test deployment, PRA intends to release this Project to the community under Open Source License.
Background and Problem Statement
Honeypots are systems that behave like production systems but have less attack surface, less resource requirements, and are designed to capture information about how potential attackers interact with it. Their intent is to trick an adversary with network access to believe that they are a real system with potentially valuable information on it. The adversary’s effort to break into the honeypot can reveal a lot of information about the adversary and enable defenders to detect and gain an advantage on this threat.
Project Description
In this project, students will continue the work on low-Interaction production honeypots, which can be configured and deployed easily, remaining cost effective in large numbers. There are two parts to this project: 1) an automated configuration and deployment tool that will create honeypot configurations based on existing systems, and 2) improvement of the honeypots and management system to increase the number of supported protocols and improve data analytics capabilities.
Central Management System
The central management system provides a way to monitor and control honeypots and serves as a central repository of data collected by each honeypot it controls. Users should be able to view, modify, and create honeypot configurations. Students are encouraged to leverage existing technologies, such as Modern Honey Network (MHN).
In Phase 2 the following features are requested:
- Honeypot Monitoring: Using MHN, create an overview of Honeypots that are deployed and basic health/performance information (e.g. Online/Offline, Error Messages, Configuration)
- Log collection: Using MHN collect event logs from active Honeypots. Define and implement event log format that can be extended in later phases of the project. Make Logs available for collection by an external SIEM
- Alerting: Create Alerts based on collected Logs and present them in the MHN GUI. Define and implement an alert format that can be extended in later phases of the project. Make Alerts available for collection by an external SIEM. In order to prevent false positives,
- Deployment: Using MHN (and other technology as necessary) create an automated way to deploy Honeypots using multiple configuration. This system needs to be able to deploy honeypots on virtual hosts using all kinds of virtualization technologies and support a wide variety of hardware such as Server, Arduino Boards or Raspberry Pis
- Configuration Management: Using MHN, create a way to centrally manage configuration of Honeypots. This function needs to support the viewing of configuration and allow for changes (e.g. change of payload, port or hostname), it also needs to support export and import of configuration
Honeypots
The initial configuration of a honeypot will be based on an Nmap scan of another system that the honeypot must attempt to replicate. With this input, the honeypot should configure its simulated services so that a Nmap scan to the honeypot produces no detectable differences, while having as little attack surface as possible. Additional configuration options will allow:
- Activation/deactivation of port/protocol simulation on a per port/protocol basis
- Configuration of IP address, hostname, MAC address
- Configuration of “payload” to be send after successful connection
- Log collection and retention settings (e.g. whitelisting and local storage)
- Stretch Goal #1: Ability to obtain DHCP configuration
To be effective, a honeypot must allow connections and simulate protocols from different layers:
- Fully participate in layer 1-3 traffic to appear as normal network device
- Engage in TCP, UDP and ICMP traffic and
- Replay recorded “payload” after successful connection (e.g. after TCP 3-way Handshake)
- Stretch Goal #2: Engage in commonly used encrypted protocols that Nmap supports, such as TLS
Each honeypot is expected to have data collection capabilities to be able to detect when it’s scanned or connected to and report the follow information to the central management system:
- Hostname
- Timestamp
- Source and destination port
- Protocol
- Source and destination IP
- Type of connection (e.g. 2-way Handshake only)
The Honeypot must be able to detect and log all network traffic, including terminated TCP connection attempts. Log creation and retention on the honeypot must be configurable to allow the exclusion of unnecessary logs and preserve resources, including “whitelisting” of specific network traffic or sources.
The Honeypots Management Interface, used for health monitoring, logging and configuration needs to be hidden from adversaries’ scans (e.g. separate interface).
Stretch Goal #3, a single hardware instance or virtual machine should be able to execute more than one honeypot in parallel using different physical or virtual network interface.
Stretch Goal #4, Honeypots should be able to register with Microsoft Active Directory.
Additional Requests
Modern Honey Network is the preferred central management system and Python the preferred development language. Students should use best practices for the development of secure software and document in great detail. Students should also strive to design honeypots to be modular so that additional protocols can be introduced, and additional functionality can be created, e.g. RDP, SSH, SMB Honeypots, Honey Websites and active beaconing. This Project is intended to be released as an open source project on GitHub and continued after the team has finished.
Students are required to have a strong understanding of network principles such as the OSI Model. Prior successful participation in “CSC 405 – Computer Security” and “CSC 474 – Network Security” is recommended for this project. Previous experience with Nmap and OS configuration is an advantage.
Students will be required to sign over IP to Sponsor when the team is formed.
About SAS
SAS provides technology that is used around the world to transform data into intelligence. A key component of SAS technology is providing access to good, clean data, and the processes needed to transform it to make it ready for analysis. The SAS Data Management business unit is responsible for helping users create standard, repeatable methods for integrating, improving, and enriching data. This project is being sponsored by the SAS Data Management business unit in order to assist users in managing the processes they develop to work with data.
Background and Problem Statement
GitHub is the most popular version control system for user collaboration. The default method for interpreting differences between commits to the system is based on text differences between files. Process flows however, such as scheduling flows, are best expressed as a directed graph of multiple code steps, where the graph is expressed in JSON. These types of files are also useful to store in a versioning repository, but there is no easy way to understand what has changed when the content being stored goes beyond simple text.
Project Description
The goal of this project is to design and implement a method for differencing versions of a text-based representation of a directed graph in GitHub. Students should invent a way in GitHub to difference a process flow of multiple steps so that users can easily understand what has changed. We want this to be fully integrated into the system so that users will be able to access it when they select differencing for this type of file in the GitHub repository. You should invent an interesting visualization that shows the differences in a hierarchical way that is more understandable that simple text-based differences.
Objectives
This project has the following objectives:
- Come up with a visualization method for differencing directed graphs of content.
- Integrate this method into a GitHub repository so that the differencing viewer is used when differencing this type of file
- Demonstrate your ideas using the sample data provided in a working GitHub system
Dataset
We will provide a JSON representation of a graph to use as version 1, and an updated version of this JSON to use as version 2. Below is what the graph looks like when visualized.
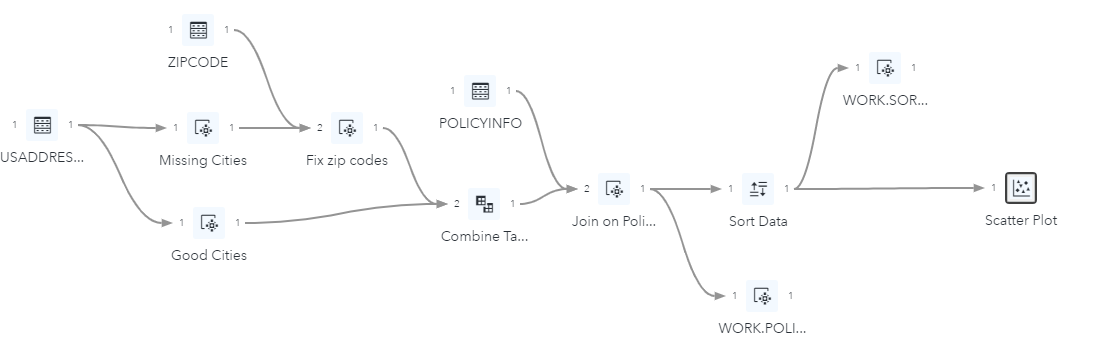
Technologies and Other Constraints
To ensure the success of this project, an interest in visualization techniques, including methods for building graphics into applications, would be helpful. Since GitHub is a web app, your solution will also be web-based. You are welcome to recommend languages and frameworks for both the front-end and back-end components of your project, but you should plan to use JavaScript (or TypeScript) for the visualization itself. Finally, there are a number of free, existing graphical libraries that you could incorporate into your design, such as D3, or GoJS, to help with the visualization, but you are free to recommend others as well.
Reference info, other examples, etc.
GitHub has documentation here: https://developer.github.com/apps/building-github-apps/creating-a-github-app/ describes how to write apps. You can contribute your solution as a part of a project in your own repository.
You can also contribute directly to GitHub itself, which is an open source library. Instructions for how to do that are documented here: https://github.com/git/git/blob/master/Documentation/SubmittingPatches
Here is an example visualization for this project that is not integrated but is interesting: https://community.alteryx.com/t5/Alteryx-Designer-Knowledge-Base/Visually-Compare-Workflow-Versions/ta-p/88887
Here are a few other links that may be of interest:
- JavaScript – is the programming language of the Web. This is a good starter link
- GoJS is a graphical library for building process based diagrams
- React is a JavaScript library for building user interfaces
- D3 is a JavaScript library for manipulating graphical documents based on data
You will learn about working with open source projects, and you may want to contribute your design back to the system. Finally, this project can help you learn how to leverage external libraries and incorporate them into your own code projects.
About Wake Technical Community College
Wake Technical Community College (WTCC) is the largest community college in North Carolina, with annual enrollments exceeding 70,000 students. The pre-nursing program in the Life Sciences Department runs a two-course series on Anatomy and Physiology, where this project will be used, with enrollments exceeding 800 annually. Additionally, this project is expected to assist over 1,000 biology students when fully implemented.
Background and Problem Statement
Biology and pre-nursing students need to understand how the body carries out and controls processes. Proteins have a diverse set of jobs inside cells of the body including enzymatic, signaling, transport, and structural roles. Each specific protein in the body has a particular function and that function depends on its 3D conformation. It makes sense, then, that to alter the activities within a cell or body, proteins must change shape to change function. As a beginning biology or pre-nursing student, this is a difficult process to imagine from a 2D image in the textbook, and we wish to create a tool that helps visualize protein dynamics in 3D. One important example of a protein is hemoglobin. Hemoglobin is a huge protein found inside red blood cells and its primary function is to carry oxygen and carbon dioxide to and from cells of the body, respectively. Structures inside hemoglobin bind to oxygen dynamically at the lungs and then release the oxygen at metabolically active tissues.
Project Description
Over two semesters, Senior Design teams created an Augmented Reality app that allowed WTCC biology students to view the structure of any protein under various conditions. The proteins and conditions are specified in a database that is populated by WTCC instructors using an admin portal. This semester, Senior Design students will expand this technology from a tool that permits visualization of a single protein to a tool that’s usable in the classroom and permits instructors to guide their students’ exploration of the concepts of protein dynamics. The main functionality of the software for visualizing protein structure under different conditions exists and biology instructors can populate the backend database with protein structures; however, guided exploration of the protein structure and affordances for assessment are not yet available.
This semester’s project aims to tailor visualizations of those structures to learning goals, and add additional instructional content including the ability to create multi-format assessments which will help students navigate structural features in a more meaningful directed way. One part of this will be re-incorporating AR tag functionality so that students can quickly toggle back and forth between alternative environment-specific 3D conformations
Functionality improvements
- Support additional AR tags to enable collaborative annotation of macromolecular substructures
- Users shall be able to select from a set of tags associated with instructor-specified environmental factors
- Users shall be able to place environmental factor tags and the protein molecule tag in view of the camera simultaneously
- The system must support a total of four active tags simultaneously (one molecule tag and three environmental factor tags)
- Improve stability of tag detection to enable 360 degree rotation
- Allow for more types of visualization: space filling vs ribbon
New functionality
- Expand upon the instructor web interface to enable instructors to specify
- tasks for students to perform and the conditions that indicate completion of those tasks
- multiple choice questions for students to answer
- short free-text response questions
- Expand the backend DB schema to support collecting students’ task responses for instructors to view
- Provide support for rendering students’ task instructions in the 3D scene or within the mobile app UI
- Provide support for rendering multiple choice questions within the 3D scene or within the UI, and support for users selecting answers to those questions
- Provide support for rendering free response questions within the 3D scene or within the mobile application UI
- Provide support tracking answer correctness over a series of questions during a session
Senior design students will also work with Wake Tech Community College Biology instructors and existing or former students to conduct usability testing at three or four sessions during the semester, which will require transportation to Wake Tech’s Perry Health Science Campus in Raleigh.
Technologies and other constraints
The current system uses MySQL, Spring and Thymeleaf on the backend, and Three.js, AR.js, and LiteMOL on the front-end. The browser-based app will be hosted on a Windows server, and aimed at running on mobile browsers. iPhone must be supported, Android should if possible be supported as well.
Students will be required to grant royalty-free use of IP to Sponsor when the team is formed.
Abstract
Duke Energy purchases billions of dollars in fuels per year. Multiple systems are used to manage the process of gathering invoices and ensuring that they are paid in a timely manner. Although the majority of the invoicing cycle is fully automated, there are some aspects that are still performed manually. For example, in the Duke Energy payments system, contract administrators are required to manually attach invoices to their related payment record. This process consumes up to forty hours per month. Automating the attachment process would save Duke Energy money and free resources to work on higher-value assignments. The student team will implement an application that will search a directory structure for files, read the file for relevant metadata, move the file to a destination server and update the receiving system appropriately.
Background
Fuel data is sent to Duke in multiple forms, primarily FTP and email. The data consists of delivery method (train number, tonnage, number of cars to unload, etc.), logistical information (GPS data), and payment required. The data is extracted and fed into a commodity-tracking system. Analysts generate RFPs (Requests for Payments) in this system that are sent to the accounts payable (AP) system. The invoice terms are recorded and eventually payment is sent to the vendor. Although this process is fully automated, the invoice attachment still must be downloaded from the initial delivery and uploaded into AP.
Students can assume that the invoices will be downloaded into a file directory that is subdivided by vendor and year, as follows:
The invoice files can be either Excel, Word, PDF, or text. Each file (regardless of format) will have the following naming convention:
- Four to six character alphanumeric vendor code
- Underscore
- Eight character numeric invoice
- Underscore
- 6 digit numeric date (MMDDYY)
- file extension (txt, docx, xlsx, pdf)
Examples of this naming convention are 123CC_10005678_010520.txt and 123CC_10005695_011620.txt.
Additionally, the contents of each file will contain the keywords “Amount:” and “Contract:” with their appropriate values, as follows:
Amount: $20,345.00
Contract: 123CoalCoWVa (consider this a 15 digit alphanumeric string)
Duke Energy can have multiple contracts per vendor. Fuel deliveries can happen multiple times per month. Assume multiple invoices per month, per contract, per vendor.
Requirements
The students will create an application used by contract administrators (Invoice Automator) to attach invoice files to the AP system and update it appropriately. The students will also create a shell AP system. The Invoice Automator should be able to do the following:
- Iterate through a specified file directory. Search based on key values (Contract Number, Vendor Code, Invoice Number, Payment Amount, Date).
- Once the specified file is found, contact the AP system via a web service call. Pass the parameters above.
- Read the response and act appropriately, i.e., move the file to the specified destination. Log a successful move or any error received.
The Invoice Automator will have the following features:
- Admin screen that where users will maintain invoice information, such as:
- Vendor name
- Vendor code
- Location of invoices (file share)
- Contract Number (assume this is unique)
- Active Flag (indicates if the contract is still active)
- Reporting: Every run will generate a report that includes status of each file processed
- Update success or failure, per file
- Specifics of update failure
- Any other errors encountered
- Reports will be emailed to users and archived for audit purposes.
- Search screen to find previously submitted invoice files.
- User maintenance: Access to this application is restricted. Users must be granted permissions to log in. UserID and password will be required. User rights to be specified as
- General: Can maintain the administrative screen and kick off the process
- Super User: Has all General rights plus can add new users to the system.
The shell AP system should be very simple. It should consist of a web service that receives the key file values, then checks the following:
- Presence of all five key values
- If the key values are present, check for location of destination folder.
A response will be sent to the Invoice Automator. The response will either include the location of the destination folder, or an error message (i.e., some or all of the key values are incorrect or missing; there is no destination folder; etc.).
Technology
Technology choices will be at the discretion of the project team. As an additional challenge, consider implementing the following features:
- Ability to run the invoice processing feature on a predetermined schedule via Windows Scheduled Task or CRON job
- Ability to run Invoice Automator server components on Linux or Windows
- Ability to access Invoice Automator UI on a mobile device.
Documentation
Full documentation of the system is required. This includes:
- Source code documentation
- A User’s Guide, in the form of a Word Document, fully describing the features of the system. This is to be a “how to” guide for the users.
- A Technical Guide, in the form of a Word Document, that describes the architecture and major components of the system from a technical standpoint. The intended audience will be software developers who will be providing support for the application in the future.

Background
Autonomous vehicles technology is maturing and could offer an alternative to traditional transit systems like bus and rail. EcoPRT (economical Personal Rapid Transit) is an ultra-light-weight and low-cost transit system with autonomous vehicles that carry one or two passengers at a time. The system can have dedicated guideways or alternatively navigate on existing roadways where the vehicles are routed directly to their destination without stops. The advantages include:
- Dual mode – existing roadways and pathways can be used for low install cost in addition to elevated roadways at a lower infrastructure cost than existing transit solutions
- A smaller overall footprint and less impact on the surrounding environment so guideway can go almost anywhere.
The research endeavor, ecoPRT, is investigating the use of small, ultra-light-weight, automated vehicles as a low-cost, energy-efficient system for moving people around a city. To date, a full-sized prototype vehicle and associated test track have been built. For a demonstration project, we are aiming to run a fleet of 5 or more vehicles on a section of Centennial campus. The Vehicle Network server will serve as the centralized communications and vehicle routing solution for all the vehicles.
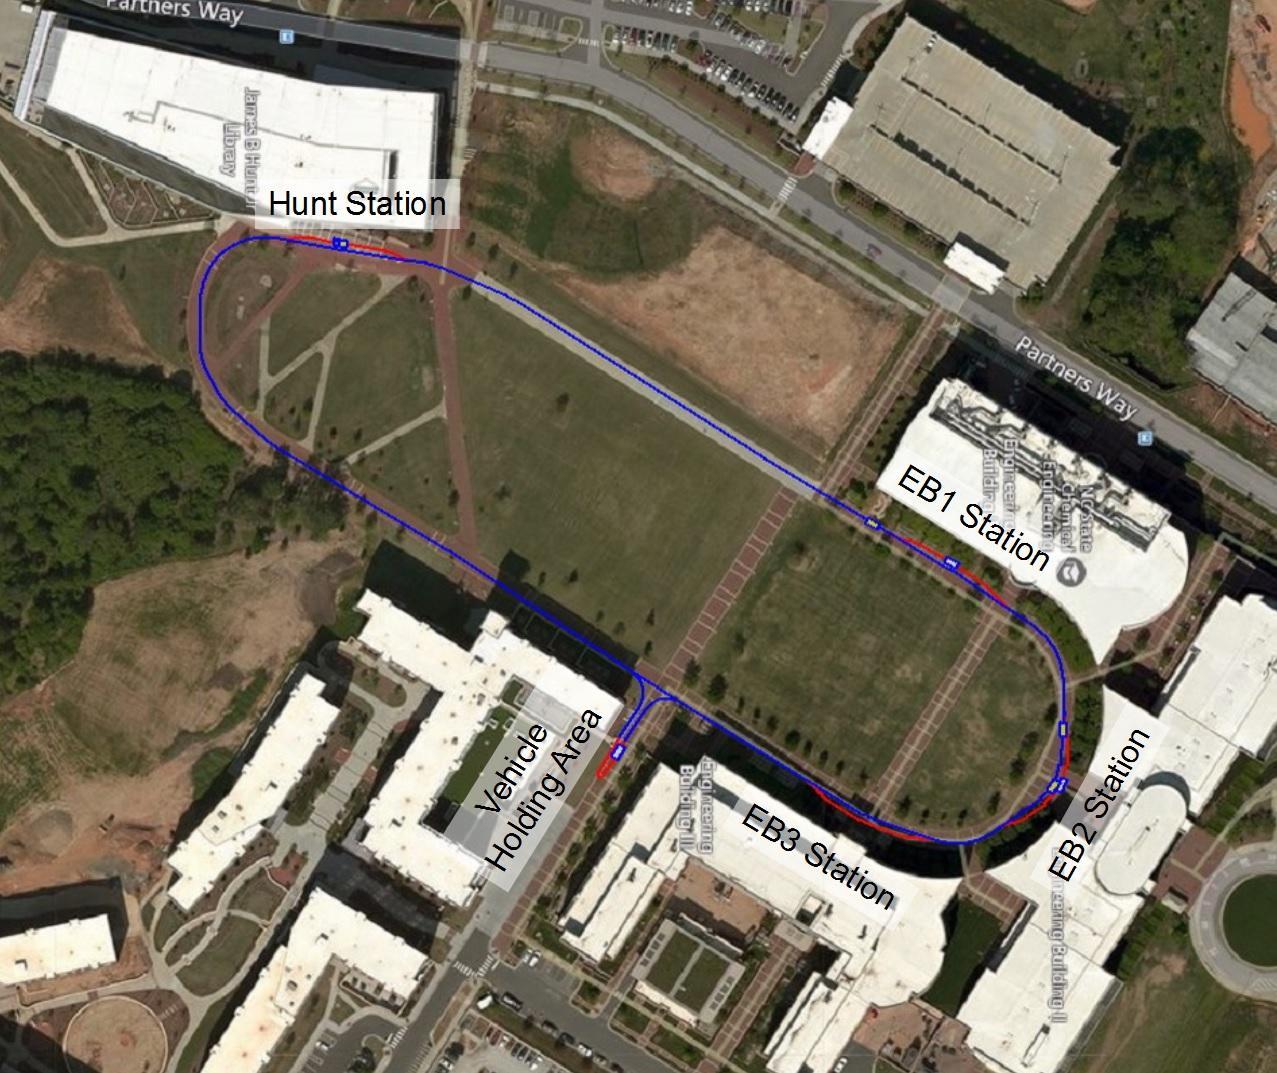
The Problem
With the aim of running a multi-vehicle, live pilot test on Centennial Campus, the overarching goal is to create a Vehicle Network Controller (VNC) and the associated ROS vehicle client software to guide the vehicles and provide interaction to users. Please refer to the architectural diagram below showing the server architecture of the solution. The VNC will manage a fleet of cars, dispatching them as needed for ride requests and to recharge when necessary. It will also provide interaction to users to both make these requests and manage the network itself.
The work on the VNC would be a continuation of the work from another senior design team from Fall 2018. The current VNC solution provides a means for administrators/users, and vehicle clients to interact with the server in different ways. Though still considered an alpha stage at this point, there is a need to further develop the VNC to make ready to be used with physical vehicles.
As a follow on to this project there are two main goals. The first is to create a Robot Operating System (ROS) Package to easily communicate with the VNC controller. This ROS module will need to operate with other modules with the autonomous vehicle ROS environment and further provide the key information that needs to be transferred to the VNC.
Secondly, the VNC controller needs to be adapted and tested to interoperate successfully with the ROS package initially and ultimately with real vehicles. It is recommended that the team works with the EcoPRT group to understand the limitations and usages of the current VNC solution and identify elements that can be improved upon the current solution that reflect real-life usage scenarios.
In addition to code/documentation from previous CSC teams, the EcoPRT actively maintains a ROS environment for testing the vehicle both physically and in emulation mode.
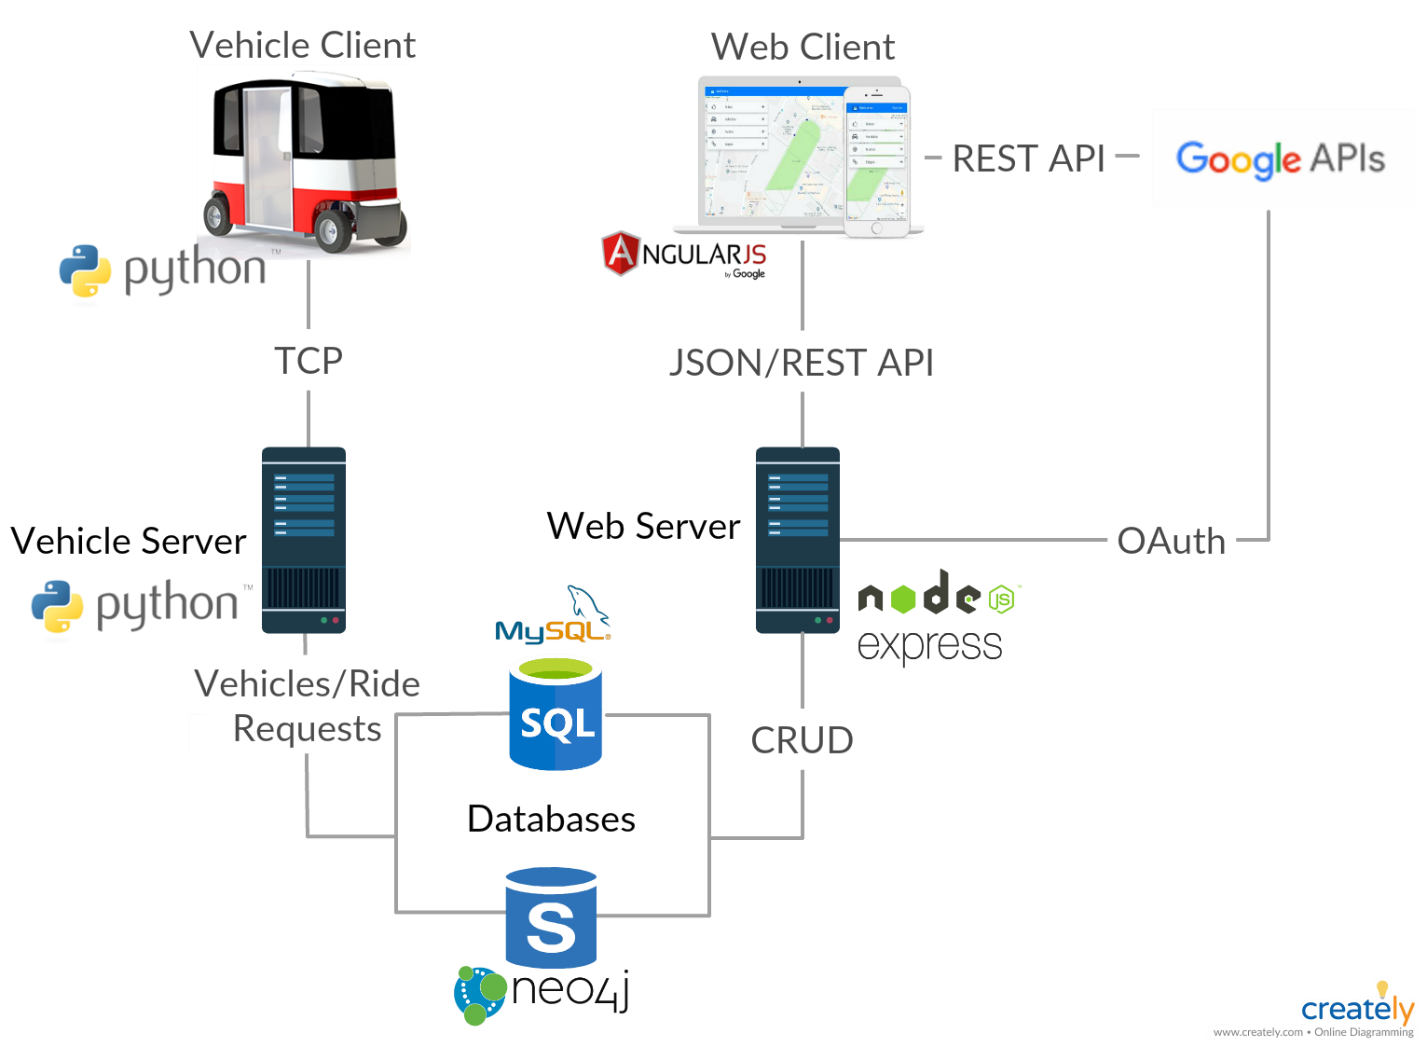
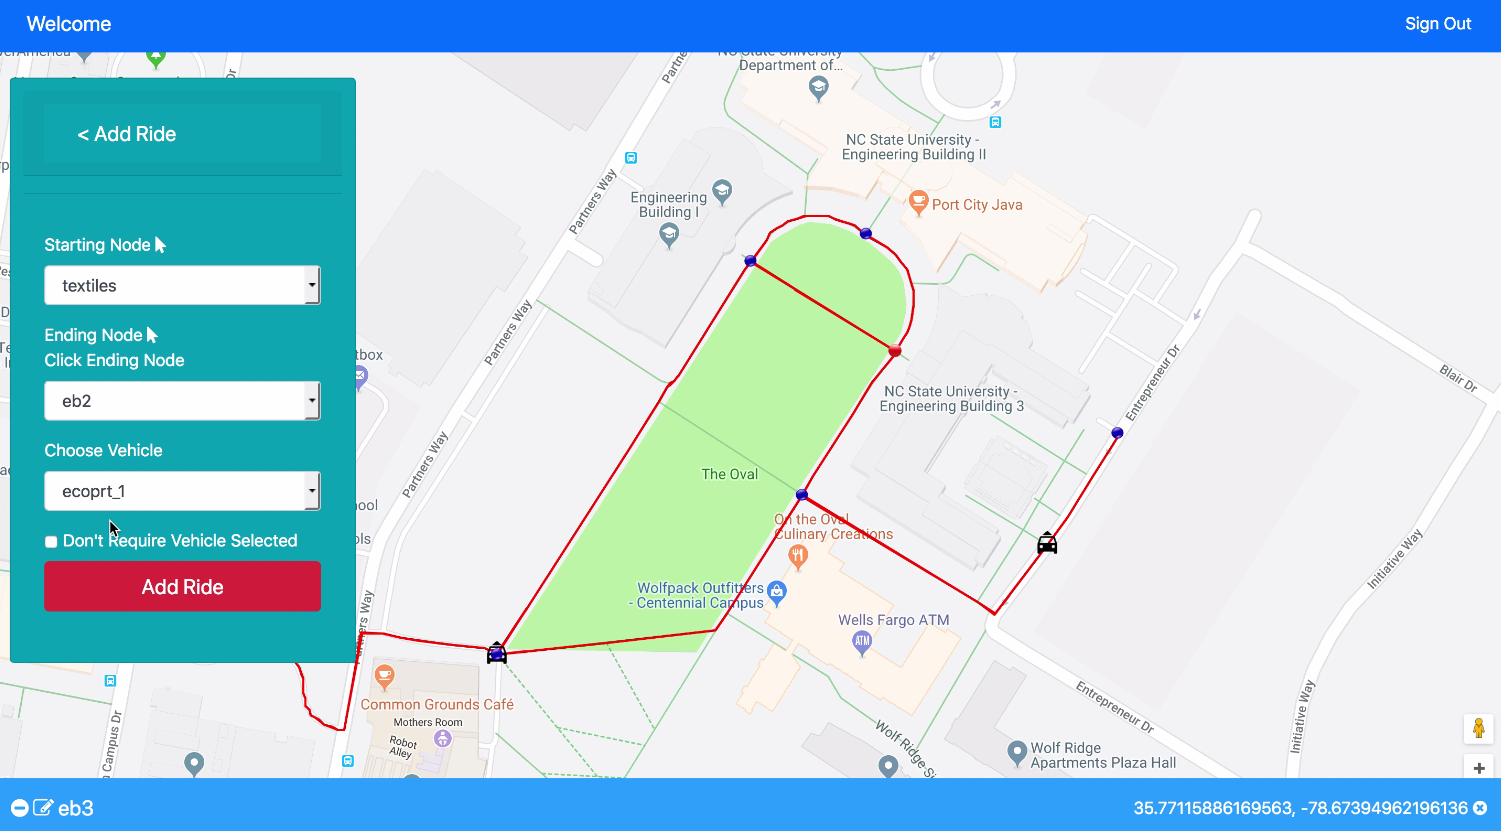

|
Name |
Description / Role |
Version (if necessary) |
|
ROS |
Robot OS system for autonomous vehicle |
Kinetic |
|
NodeJS |
Web Server software. This will run on the web server and will serve the website and connect the website to the database. It will contain a REST API. The REST API will allow the website and other services to access the functions of the web application. |
8.9.4 |
|
Python |
Used to write the Vehicle Server and Vehicle Client processes |
3.4.9 |
|
NPM |
Node Package Manager for installation |
- |
|
MySQL |
SQL implementation. Database that is used for storing tabular data that is very relational in nature. |
14.14 |
|
Neo4j |
Graph database. Used for storing graph-like data. Uses the Cypher query language. |
3.4.9 |
|
Bootstrap |
Using Bootstrap will give more freedom to customize the look and feel of the web application. It also makes it easier for to make a mobile friendly version of the website. |
4.0.0 |
|
AngularJS |
Used for the logic of the website. It works very well for data binding which is the bulk of the web application since all data is pulled from the database. |
1.6.8 |
|
Express |
Routes URLs to files and/or functions |
4.16.2 |
|
HTML5 |
Used to create web pages |
5 |
|
REST |
Used to get information from the server and send it to the front end |
- |
|
Socket.io |
Used to get information from the server and send it to the front end |
2.0.4 |
|
CasperJS |
Used for automated testing of web applications with JavaScript |
1.1.0-beta4 |
|
Mocha |
JavaScript framework for Node.js that allows for Asynchronous testing |
5.0.5 |
|
Chai-HTTP |
Assertion library that runs on top of Mocha |
4.0.0 |
|
Istanbul (nyc) |
Used for determining code coverage |
11.7.1 |
Sponsor Background
At Fidelity Investments - Personal Investing, our team is dedicated to digitizing and automating service, replacing manual and inefficient process with technology. One critical area is the automation of paper forms handling. Once documents are scanned, they often require manual processing, where associates view and enter the data from each field. If we can digitize the entire process, we can deliver faster and more accurate service to our customers.
Problem Statement
Fidelity Investments still receives many documents through the mail, including application forms, instructions, legal documents, and checks, often with several document types in a single envelope. All of these papers are scanned and compiled into a single PDF, which makes it difficult to digitally process or route forms. Automatic form identification and classification would allow Fidelity to split these customer requests into separate transactions, enabling more efficient processing of these requests.
Project Description
Build a tool that will take a PDF input file and accurately identify and split each of the documents into separate PDF files. The input bundle may include any combination of Fidelity forms, personal and business checks, hand-written and typed correspondence, legal documents, and non-Fidelity forms (such as marriage certificates). The forms may be in any order, including out of order within a single form, and may not be correctly aligned in the input scan.
This is not solely the conventional document classification problem, where OCR is used to characterize the contents of each page. Instead, we encourage you to use multiple types of machine learning-based recognition, including OCR and image classification, and image processing techniques such as landmark recognition. Use of existing, cloud-based engines such as Amazon Textract and Rekognition is encouraged. We expect that a combination of multiple techniques in a single pipeline will result in the most useful and accurate recognition system.
We propose the following incremental minimum viable products over the course of the project:
MVP 1
Split the input into separate PDFs for Fidelity forms – recognizable by form structure landmarks and ID – with separate PDFs for each multipage form and one bundle for all other material. The service should notify if any pages of a form are missing (or not recognized). If the pages in a form are out of order, correctly reorder the pages in the output.
MVP 2
Identify standalone scans of checks and scans of checks that are attached to forms, and extract the check image as a separate PDF. Extract the MICR line that includes the routing and account numbers at the bottom of the check, along with name and address, and return with confidence level. Optionally, extracting the courtesy and legal amounts on a check will add further value.
MVP 3
Identify and classify additional document types using text and content recognition.
Success measures:
- High rate of correct recognition of Fidelity forms
- High performance processing of documents: <15 seconds to analyze a PDF bundle
- Transfer of code, models, and data to Fidelity on project completion
Interesting questions:
- Does localization and masking assist recognition?
- How do image recognition and OCR-based recognition success rates compare?
- How much data do we need for these models to achieve useful accuracy?
Technologies and Other Constraints
Implementation Requirements
- Python 3 code base
- TensorFlow for local models; other Machine Learning platforms may be an option after discussion with the sponsor.
Implementation Preferences
- Service accessible through a RESTful API
- Containerized (on prem or AWS) or serverless (AWS) implementation
- Testable with command-line tooling
About Lab for Analytic Sciences
The LAS is a mission-oriented translational research lab focused on the development of new analytic technology and intelligence analysis tradecraft. Researchers, technologists, and operations personnel from across government, academia and industry work in collaboration to develop innovations which transform analysis workflows.
Background and Problem Statement
The applicability and power of Machine Learning (ML) is quite striking. Having already made major impacts in every major economic sector, it holds even greater promise. Supervised Machine-Learning algorithms are trained to be able to perform classification tasks which answer a question-of-interest. For example, a ML algorithm could be trained to answer the question "Does this image contain a human in it?" The training process, during which the algorithm learns how to answer the question, makes use of a training set of data which is labeled, meaning each data element in the training set has the true answer to the question-of-interest appended to it. The acquisition of a labeled data set for training purposes is an essential step in the ML development process. In the human identification example, each image in the training set has an attached answer of "yes" or "no". Typically, the creation of a labeled training set is a manual process in which humans look at each data element and answer the question-of-interest to assign a label. This labeling process (sometimes referred to as data annotation) is often both tedious and time-consuming. It is of interest to investigate whether that process can be made user-friendly, and possibly even a less unattractive process to data labelers.
Project Description
LAS has built a data-labeling application to support ML algorithm development (which may be used as a basis if desired). The high-level capabilities of the application are to enable ML developers by enabling the upload of unlabeled data sets and to enable labelers to be presented the data objects with the ability to assign labels to data elements. The assigned labels are then stored and made accessible to the ML developers. One drawback of the current LAS labeling application is that it is limited to desktop environments.
Since labeling data can be tedious, time consuming, and tiring, the goal of this project is to better engage annotators to motivate them while labeling as well as to allow for labeling to occur at any time. To achieve these goals we hope to introduce gamification to the labeling service as well as modify the application to make it available on mobile devices (on at least one mobile platform which may be selected at a later date).
Below, we have a more detailed listed a set of desirable features the application will include, however, we would like to take advantage of the senior design team's creativity and ingenuity to brainstorm, design, and implement some form of incentive structure and/or gamification aspects to the data-labeling process. As a base, gamification could be goal-based, labeling objectives established per-project or more creative examples could be imagining ways to represent labeling tasks themselves as simple games (puzzles, differential image comparison, or word games). Games might also be conjured around the tasks themselves. Could competitive labeling games be designed to pit different labelers against one another? An open question is whether traditional gamification features such as user scores/levels, achievement badges, etcetera would produce any effective increase in labeler participation and/or labeling quality.
Additional desirable features include the following:
- The capability to maintain various user metrics such as the quantity of labels a user has applied, and the number of data sets for which a user has contributed labels.
- The capability to, in some way, measure the quality of labels a user applies, perhaps based on the agreement between their labels and other users' labels on the same elements of data.
- Implement the application in a manner that makes the labeling service available on a mobile device.
Successful gamification of data labeling could provide a low-cost incentive to increase voluntary participation in data labeling efforts. Implementing the application with mobile accessibility enables users to participate in data labeling efforts at convenient locations, and during times of their day that may otherwise be idle such as during public transit. This could again achieve greater participation in data labeling efforts. Such increased participation has the end benefit of enabling training of ML models that hold great potential to further revolutionize analysis workflows.
Technologies and Other Constraints
The mobile platform could be either Android or iOS. This is TBD.
The LAS has some existing software to enable data labeling. The senior design team could make use of this software to expedite their efforts if they so choose.
LAS would prefer a mobile application. However if the team has good ideas about the gamification aspects of the project and development of a mobile application alongside development of the gamification ideas would push the project out of the scope of a single semester, one or the other could be selected based on a team decision.
Sponsor Background
The healthcare industry is rife with inefficiency and is in the early stages of significant disruption through advances in technology. An increasing trend, aimed at making patients more empowered and accountable for their care, is to give them greater responsibility in the financial aspects. We see this through a rise in high deductible insurance plans, amongst others. The PatientPay platform engages patients, through next-generation technologies, to streamline the financial aspects of patient care and provide a holistic perspective on healthcare services.
Problem Statement
The financial workflow in healthcare is such that government (Medicare/Medicaid) and Commercial Insurances cover large portions of healthcare expenses. Healthcare reform (led by technology disruptors) is shifting a larger portion of this responsibility to patients, thus enabling patients. Workflows to engage patients on their responsibility have historically centered around sending paper statements via the postal service. More modern approaches to engage patients, through omni-channel strategies, are starting to emerge. However, the industry has yet to see a process (or decisioning engine) that attempts to recommend personalized engagement strategies. For example, sending a text reminder may be effective for some cohorts, but not all.
Current workflows for patient receivables are simple, static, and are an ineffective fit for the evolving landscape. Different people are inspired to act differently. A personalized strategy is required in order to engage and inspire action. The PatientPay platform includes configurations that allow for variations in the engagement process but is not currently being leveraged to its fullest. Optimal configuration would result in higher levels of patient satisfaction while improving the overall financial aspects of patient care.
Based on a defined set of inputs and configuration options, the team would build a sub-system that would allow for data-driven recommendations for optimal system configuration as defined by patient engagement and increased receivables.
End users are defined in two sets; patients and hospital/physician group users. Patient benefits are defined by a predictable and secure computing experience that encourages fiscal responsibility for services received in a manner that is accretive to overall patient satisfaction. Hospital/Physician group users benefit largely through increased/timely receivables and lower operational costs through more efficient operations.
Technologies and Other Constraints
Technology choices for this project are somewhat flexible, but core technologies are expected to include: Java, SpringBoot, Angular, Kafka, MySQL, MongoDB, Python, PyTest, SQL, Jenkins, Bitbucket, JSON, draw.io/C4 (solution design) and webhooks of partner integration (e.g. Twilio).
This project will be 100% cloud native (AWS). Users interact with the software via desktop and mobile devices.
Students will be required to sign Non-Disclosure Agreements and to sign over IP to Sponsor when team is formed.
About Burlington Carpet One
Burlington Carpet One is a full service, retail floor covering storefront, with a dedicated, in-house installation team of technicians. We communicate and schedule installation information/dates with purchasing customers daily. As a floor covering retail showroom, we also house thousands of samples that are checked out daily by customers. Without a checkout system to track the samples, many are not returned resulting in expensive replacement costs.
Problem Statement
Currently our scheduling department uses a white board to schedule and monitor installation dates. We have considered and researched other scheduling programs and none seem to accommodate the daily challenges of the flooring industry.
In addition, a program is needed to hold a database of thousands of sample style names, and should have the capability to be imported from an existing database, or entered manually (or deleted). The program should allow for sample check out and in. It should also allow for reporting to track checked out samples beyond the allotted allowed time. Notifications of the checkout/in should be pushed to sales associates. And, notifications should be sent to customers after the allotted checkout time period has expired, as a reminder to return.
Project Description
Currently, the existing software has addressed the need for a customer interface by allowing us to establish an installation date on a calendar, as well as send pre and post reminders (text/email) based on predetermined parameters using predetermined templates. However, the software now needs an installer component to the same calendar appointment. Being able to schedule our installation team in tandem with customer information will allow us to use one program designed to schedule and communicate with the customer seamlessly.
The checkout system for floor covering samples should be accessible from a stationary kiosk and/or tablet. The checkout system would work well if combined with touch screen capabilities and a barcode reading system. The checkout process would first prompt the customer to select - CHECK OUT OR CHECK IN:
- Customer selects CHECK OUT option. Collect Customer Information:
-Name, Address, Phone (text), Email
-Prompt to select RSA (retail sales associate from drop down box)
-Prompt to select checkout duration: 2 days or 3 days (notify customer with
automated message when this duration has been exceeded as a reminder)
-Prompt to scan barcode on sample (could come at this point or before)
-Prompt to scan another sample or to FINISH
-Optional: check box to opt into future emails/promotions
*notification of checked out sample is pushed to RSA
- Customer selects CHECK IN option.
-Prompt to scan barcode to check sample back in (as many times as all
samples are checked back in)
-Prompt FINISH
*notification of returned sample is pushed to RSA
*automatic thank you message for returned sample is emailed/texted to
customer
Other Considerations
- Style names should be entered into the database with a manual option and an upload option from another database, or excel spreadsheet with csv formatting (this could vary depending upon challenges, etc.)
- The system should report weekly reporting of unreturned samples
- The system should allow the download of customer information (name, address, phone (text), email) in csv - Excel spreadsheet (to be used for marketing purposes with other programs)
Technologies and Other Constraints
The student team will have full flexibility in selecting technology and functionality.
A touch screen tv screen (kiosk) in the showroom is desired along with table capability as well.
STUDENTS WILL BE REQUIRED TO SIGN OVER IP TO SPONSOR WHEN TEAM IS FORMED.
About LexisNexis
LexisNexis builds products that facilitate computer aided legal research. LexisNexis Raleigh campus is housed in NCSU's Centennial Campus and over the last 5 years played a pivotal role in building the flagship product LexisAdvance, the #1 legal research tool that law professionals rely on to upload the rule of law.
Background and Problem Statement
LexisNexis's flagship product LexisAdvance supports a complex query syntax. The following reference documents the various features:
http://help.lexisnexis.com/tabula-rasa/newlexis/connectors_group_ref-reference?lbu=US&locale=en_US&audience=all,res,cb,cl,ctext,lps,med,vsa,tax,lpa,icw,blink,bcheck,pub,urlapi
The user entered query is parsed and translated to an AST (abstract syntax tree), and this is eventually transformed to the language a search engine (example: Lucene) understands.
Developing tools to understand the AST's complexity (and there-by the query) and map it to other internal metrics such as "query response time" is extremely valuable in various areas of optimization.
This project's goal is to develop tool(s) to understand query AST complexity.
Project Description
The team will work on approaches to develop algorithms (multiple would be needed) to understand the AST and provide access to this intelligence via APIs that other tools and projects can access. This can be seen as an analytics problem. Various metrics about the complexity of the AST will be captured in a database and the algorithms will run (online realtime, background jobs etc) on this data to extract the intelligence that APIs will provide access to.
Dashboards and graphs to illustrate potential usages will need to be developed.
As an example consider a user query that may have a number of nested boolean connectors (AND, OR, NOT) that result in a AST with multiple levels. The lengths of the phrases between the connectors at each level, the depth of the tree, the numbers of different types of connectors will all have an impact on how much of the search index needs to be scanned to answer the query. This thereby impacts search response time. Analyzing the AST to capture information, known and unknown, that can lead to being able to discover and extract intelligent metrics to guide on impact AST would have on search response time will provide the data to offer different solutions. A solution could be to rewrite the query to give same relevant results but have lesser structural complexity, another solution could be to partition the search engine backends for different classes of query complexities.
Understanding AST complexity will enable LexisNexis to provide an enriched user experience to the end user. Faster search results, relevant search results, operational cost efficiencies translating to subscription cost reductions and so on. A happy user means a net promoter who becomes a brand ambassador for the product.
Technologies and Other Constraints
Java (required)
Java (preferred)
Javascript and Python (for web UI and scripting as needed)
Flexibility to choose supporting libraries
All code should be developed with build files (Gradle), unit and functional tests and deployable as dockerized containers
Web-based Dashboards API for access CLI (nice to have)
Students will be required to sign over IP to Sponsor when the team is formed.
Project Details
LexisAdvance, the flagship product of LexisNexis, is the industry leading computer-assisted legal research product used by legal scholars, lawyers, law students and corporate legal professionals worldwide. In enabling electronic accessibility of legal and journalistic documents for research, LexisNexis ingests massive amounts of content from various sources. One such source is "news" and a channel for procuring "news" sources is RSS feeds.
An aspect of news from different sources is that there are duplicates. The same news article is procured by various channels and republished. In republishing the original content certain changes can be made, such as adding headers and footers. The primary content is usually not changed. The publication (re-publication) date may be changed.
There is a need for tools that can identify duplicate content. De-duped search results enable users to see more relevant results for their queries. Further being able to tag and cluster this content as ingestion time in ways that can enable faster search time grouping is invaluable.
The team will work on approaches to develop algorithms (multiple would be needed) to detect duplicate content. The team will also communicate with sponsors to design and develop a front-end interface for the application to allow functionality such as specifying RSS feeds, displaying duplicate articles, displaying metrics about the deduplication process, etc.
Technologies and Other Constraints
Java (required)
Java (preferred)
Flexibility to choose supporting libraries
All code should be developed in virtual environments and deployable as dockerized containers
Students will be required to sign over IP to Sponsor when the team is formed.
About Live Oak Bank
Our mission is to create an unprecedented banking experience for small business owners nationwide, through service and technology. Live Oak Bank is not your traditional bank. With a laser focus on innovation in finance and technology, we bring efficiency and excellence to the lending process. We believe deeply in personal service and focus on taking care of our customers throughout the life of the relationship.
Background and Problem Statement
Businesses utilize a variety of accounts to manage their capital and cash flow:
* Operating Accounts: used for receiving income and paying expenses, such as payroll and purchasing supplies.
* Line of Credit: might be used for large expenditures, like the purchase of new equipment.
* Credit cards: provide convenience for covering expenses and earning rewards, while savings accounts can be used to earn interest on excess funds.
Businesses that want to optimize their finances are often forced to juggle these different types of accounts, which can lead to mistakes and takes time away from running the business.
To alleviate this burden on businesses, Live Oak Bank intends to launch a new type of account that combines the benefits of a checking account, credit card, line of credit, and a savings account. Known as the OneAccount, this new type of account will automatically pay customers interest on excess funds, while automatically turning into a credit card against a line of credit when the balance runs negative. All of these capabilities would be provided with the convenience of a single card and account.
Project Description
Provide a modern user experience for customers to manage all three account types, depending on the customer's running balance. Solving this problem would entail building a web app against LiveOak Bank’s REST API contract that fulfills the customer use cases below:
* Check the balance of my OneAccount
* Check the transaction history of my OneAccount
* Receive insights into expenses and cash flow in my OneAccount
* Analyze the interest paid/earned over time on my OneAccount
* Check rewards earned on my OneAccount
The technology to produce the mock REST API will be PACT.js
While the capabilities of the OneAccount are expected to simplify cash flow management for business owners, it’ll take the right user experience to avoid confusing customers that are used to managing multiple accounts. The right user experience should be modern, simple, intuitive, and instill confidence in customers that they're maximizing their funds, while also saving them time to focus more on their business.
Technologies and Other Constraints
REST, AWS, and Vue SPA web technologies should be employed to create a progressive web app that is responsive for mobile and desktop devices.
At the start of the project, students will be given a detailed specification to build REST APIs that simulate our banking core services for OneAccount functionality using PACT.js.
STUDENTS WILL BE REQUIRED TO SIGN NON-DISCLOSURE AGREEMENTS AND SIGN OVER IP TO SPONSOR WHEN THE TEAM IS FORMED.
About Merck
Merck's Vision is to discover, develop and provide innovative products and services that save and improve lives around the world. Merck's IT cyber organization is charged with protecting Merck's resources, processes, and patients by ensuring our technology is protected from unauthorized outside entities.
Background and Problem Statement
As more organizations insist on interpreting, drilling down, and verifying the details behind big data visualizations and abstractions, the process of making data-driven decisions is often limited by human bandwidth. Information fusion becomes a critical need for current cyber security fusion centers. There is a need to address this requirement and to develop systems that facilitate extraction of relevant and “fused” situational awareness of cyber and kinetics events in one portal for the consumption of decision makers.
For example, sentiment about a company can be evaluated using social media discussions and from dark web discussions. The sentiment of these discussions can help identify a potential security threat and can help provide enough time for a company to take evasive or defensive actions. Chief Information Security Officers (CISOs) can make those decisions based on the latest situational intelligence that is provided by a software system either real time or near to real time.
Project Description
The Global Events Situation Awareness Map (GESAM), is a situational awareness tool that maps global physical events like earthquakes, and visualizes them. Teams will expand upon the functionality of the existing GESAM software system.
The objective of the project is to produce a minimum viable product with updated functionality that Merck can scale. As part of the development process, teams will research any technology or vendors that have related functionalities and provide a report for the sponsors. In addition, teams will use JIRA to document and manage user stories. The project focuses on adding additional functionalities to the existing GESAM system, including:
- Ingest twitter feeds into the environment.
- Ingest feeds from intelligence providers or dark web forums
- Determine sentiment from Twitter feeds and web reports (dark web if possible) related to Merck (negative and positive): Teams will define the methodology and present it for review and approval. The method must include previous research on sentiment analysis using EMOJI from MIT and NLP using pdf, doc and other unstructured data
- Send email alerts to a Merck Distribution List when negative sentiments exceed certain threshold which is within X miles of a Merck facility
- Geolocate top negative sentiments on the global Map and provide email capabilities
- Recommend and Integrate other relevant APIs for Global Event Situational Awareness- Propose APIs
- Propose Visuals
- Propose Creative Name for the system (no more than 4 letter acronym)
Technologies and Other Constraints
- The project must use html/JS/CSS,, Python, JIRA, but sponsors are open to see what else may work on the platform
- The software must be web-based
About Merck
Merck's mission is to discover, develop and provide innovative products and services that save and improve lives around the world. Merck's Cyber Fusion center mission is to ensure that our products, people and patients are protected from any impact from a cyber situation.
Background and Problem Statement
Today there are no unified key metrics and/or platforms to understand and/or simulate the strategic cyber security value of investing in technologies and infrastructures. An expert system that uses concepts such as inference rules to help provide recommendations will help determine the level of funding and where it should be spent.
Project Description
Create a Technology Strategic Value Assessment & Simulation. This system can be used as a prototype for evaluating technology investment and simulating various scenarios to be used by Chief Information Security Officers (CISOs) to help them invest money in a technology that supports their risk posture and that aligns with the NIST cybersecurity framework
- Propose visuals and a methodology to support comparative analysis of the various technologies and their strategic value for a company like Merck
- Ingest and use NLP to extract vendor evaluation from various pdf, doc etc.. (unstructured data)
- Build an expert system with the capability to recommend technologies in which to invest (to help remove human bias from the evaluation process)
- Propose and use up to 10 key performance indicators (KPIs) to evaluate vendors and technologies against NIST cyber security standards
- Propose creative names for the system – No more than 4 letter acronym
In addition, stretch goals include integrating relevant APIs from various third party public feeds to facilitate sentiment analysis of social media content about each technology.
Since the Cyber landscape is so broad, knowing where companies have the most risk and putting the right protection in to mitigate those risks provides a better return on investment as well as a more secure environment.
Technologies and Other Constraints
Flexible, but we would like to see if we can leverage tools such as Archer or Service Now for integration.
Sponsor Background
Skyward Federal is a software start-up specializing in custom software solutions for government clients. We provide forward leaning technical solutions that incorporate security and modern software development practices to solve some of the Department of Defense’s biggest problems. The intent of this project is to create a “super” system that can handle datasets of different classifications and return a set of data based on the user’s clearance level.
Problem Statement
Data is handled at a variety of different levels for the government. The data is typically labelled based on its classification. The problem is how to handle data of different classifications in the same database in a secure manner and to ensure that the person accessing the data only sees what they have privilege to see. A few solutions have been proposed to handle data in the same database and the most acceptable is utilizing SE Linux to label the data.
Project
The goal of the project is to have a Multi-Level Security(MLS) API gateway that allows the user to see what they have been cleared to see. The first phase for this semester is to utilize Docker containers and SE Linux labels in a Postgres database. Students will run an application within a docker container that is configured to use Multi Category Security and show that the application is restricted from accessing certain data within the database.
Students will be designing and implementing the system. Skyward Federal will provide initial research that we have done on potential technologies(Docker, Firecracker, Crunchy Postgres, and SELinux).
The government classifies data at multiple levels including unclassified, secret, and top secret. To access secret information, users need to be on a system and in a facility that can handle secret information. Current systems and facilities can only handle the information that they are classified to handle. In order to deploy an application into a production environment in a government setting, there is a list of security controls(RMF and NIST) that the application or system must pass to prove it is secure. The intent of the project is to create a solution that is secure and allows users and developers to only see data that they are cleared to see. Students will have to consider ways to encrypt data at rest and ways to implement identity access management. The result of the project has the potential to break the government paradigm of breaking data into physical silos of information. The application would also be applicable to banks. Developers can usually see all the information in the databases which enables insider threats.
Students will automate a process to pull data from three different sources, label the data, and write it to the database. The data will need to be encrypted based on its label. Possible solutions would be Crunchy Postgres or a customized SE Linux database. Students will then need to maintain the separation of the data for users to access it. Students will then need to research how docker container isolation can use SE Linux and implementation of SE Linux with Firecracker. The meat of the application is creating an engine that stands up a docker container that can handle data classified to a certain level. That container needs to be dynamically spun up and pull data that only it has the read/write rights to see. The application within the container will need to have an API endpoint so that a web application get the data back to the user that the user has the right to see. The end application/system will automate the data labelling of multiple sources and store them in one "super" system. Web applications should then be able to send a request to the "super" system's API and return back the data encrypted to the user.
Technologies and Other Constraints
The student team will be integrated into the Skyward Federal team and be apart of our two week sprints. The data must be encrypted at rest and during transit based on its data label. The solutions will need to implement containers and a Postgres database.
The application implements technology for creating and updating a search engine data store (1) populated with the results from the intelligence collection and enrichment tasks performed by the intelligence analysts (2) and those obtained through query based and event driven automation (3).
For example, an analyst selects content from an email or a web page that mentions a vulnerability used by a threat actor in a campaign to target a financial institution. The bank owns IT assets with that vulnerability. The analyst tags the data (enrichment) with keywords “vulnerability”, “exploit”, “campaign”, ranks the content with a numeric rating, etc. and stores it for downstream processing. Once the content is normalized and stored, the analyst can run searches for trending across the data store: i.e. find all content stored between dates X and Y matching tags “campaign” and “exploit” where rating > Z. Some of the content inputs can be automated, such as reading a mailbox using a keyword filter or calling an API to another content system.
The goal of the application is to enhance the intelligence collection cycle with the data store’s quality measured by six data quality dimensions:
* Completeness
* Uniqueness
* Timeliness
* Validity
* Accuracy
* Consistency
(1) Search engine data store
Full text search index accessible via a web browser on the internal network, with query results and scoring presented to the analysts and available via an API.
(2) Intelligence analysts invest a significant amount of time into collecting raw data from public and private sources. Subsequently, analysts apply their expertise and judgement to process the data into actionable intelligence. A centralized data store will add value to the collection processes by facilitating storage and retrieval of the artifacts for future continuous data enrichment. In addition, the combination of the normalized artifact output and the applied analyst logic has the potential for modeling through machine learning. With the indexed and tagged data, the application could facilitate reporting, deduplication, and/or archival and deletion.
(3) Query and event based automation
Application processes will be designed to populate the search engine via queries executed on external intelligence sources (i.e. FSISAC, Twitter, Flashpoint, etc.), internal sources (Log data, etc.), and event notifications from applicable systems. For example, the application could ingest and store artifacts from a populated Feedly board that contains external news articles. In addition, the application could poll for and ingest content that matches certain criteria from an intelligence provider (Flashpoint). These are either API integrations or scraping various sources for data to ingest.
Constraints
* The developers will need access to a test environment similar to the Truist environment.
* The developers will need training and access to our intelligence tools
* A member of our team will need to be engaged throughout the project for providing oversight
* A development and data staging environment will be required, with connectivity and access to our tools
* Our team will need to define data filtering, tagging, classification logic
Most of the above items have to do with access with the assumption that the project will be done on our infrastructure. If that’s not feasible, we’ll come up with alternative- non bank infrastructure with externally staged data.
Truist Information:
Truist Financial Corporation (NYSE: TFC) is a purpose-driven company dedicated to building a better future for its clients, teammates and communities. With 275 years of combined BB&T and SunTrust history, Truist is one of the nation’s largest financial services holding companies offering a wide range of services including retail, small business and commercial banking; asset management; capital markets; commercial real estate; corporate and institutional banking; insurance; mortgage; payments; specialized lending and wealth management. Headquartered in Charlotte, North Carolina, Truist serves approximately 10 million households with leading market share in many high-growth markets in the country.
Preferred or Required Technologies
none
Project Archives
| 2026 | Spring | Fall | |
| 2025 | Spring | Fall | |
| 2024 | Spring | Fall | |
| 2023 | Spring | Fall | |
| 2022 | Spring | Fall | |
| 2021 | Spring | Fall | |
| 2020 | Spring | Fall | |
| 2019 | Spring | Fall | |
| 2018 | Spring | Fall | |
| 2017 | Spring | Fall | |
| 2016 | Spring | Fall | |
| 2015 | Spring | Fall | |
| 2014 | Spring | Fall | |
| 2013 | Spring | Fall | |
| 2012 | Spring | Fall | |
| 2011 | Spring | Fall | |
| 2010 | Spring | Fall | |
| 2009 | Spring | Fall | |
| 2008 | Spring | Fall | |
| 2007 | Spring | Fall | Summer |
| 2006 | Spring | Fall | |
| 2005 | Spring | Fall | |
| 2004 | Spring | Fall | Summer |
| 2003 | Spring | Fall | |
| 2002 | Spring | Fall | |
| 2001 | Spring | Fall |