Projects – Spring 2018
Click on a project to read its description.
Conversational Assistant for Portfolio Management
At CapitalOne, the Commercial Bank is a Top 10 U.S. bank providing banking services to business clients with annual revenue above $10MM. Comprised of more than 2,500 associates and more than 6,100 clients, Commercial Banking manages more than $70 billion in loan commitments and more than $50 billion in deposit balances, generating over $2.1 billion in annual revenue. The product and service groups within Commercial Bank include Capital Markets, Strategic Commercial Services, Commercial Business Risk Office, Commercial Operations, and Underwriting and Portfolio Management.
A crucial aspect of Portfolio Management is to better understand the metrics and risks associated with managing a diverse portfolio of loans, collaterals, and assets. The overall commercial portfolio is managed by a set of portfolio managers, which build relationships with their clients, and monitor the overall health and risk inherent in the portfolio. Considering this is lending to commercial clients, the risk to CapitalOne includes the client’s ability to generate revenue and the general health of the collateral underlying each loan. In addition, the portfolio managers are responsible for monitoring the commitments of performance made by our clients.
Background
This project builds on the Fall 2017 project that uses Amazon’s Echo Show to create a portfolio assistant for executives in the Commercial Bank. The existing project uses portfolio and rating data with elasticsearch to create an assistant to executives that includes portfolio managers up to the CEO of the Commercial Bank. The major feature of the assistant:
Conversational Assistant – Using elasticsearch technology along with the portfolio and ratings database allows the executives to ask questions about the portfolio. The students will be provided with a set of sample questions about the portfolio but the assistant should be developed to answer questions on a variety of topics.
For example:
- How many accounts does <person> manage?
- What is the risk rating for <borrower>?
- Who is our largest relationship?
About this project
In the Fall of 2017, the first iteration of the Conversational Assistant for Portfolio Management was developed by students at NC State as a part of their Capstone Project. This project is to continue that work to build the additional capabilities that were identified to move this forward as a viable product for the underwriters and portfolio managers at Capital One. There are technical and feature components to be completed during this semester:
Integration with Single Sign-On frameworks for authentication Natural Language Processing integration for more comfortable conversations Ability to view upcoming tasks to be completed by the Underwriter, sort of a “Dashboard” that is proactive
Natural Language Processing
Natural Language Processing (NLP) is available directly from Amazon using Lex or is available from third party libraries. Utilizing NLP over structured requests will allow the Conversational Assistant to be more conversational and a better utility for end users, enabling multiple pathways to get to the same data. Modifying the handful of existing queries and adding additional queries defined below in the Dashboard section that route through NLP-processors would provide strategic advantage over the current implementation.
Dashboard
The ability to see a visual representation of a portfolio of credits is incredibly beneficial when evaluating trends, monitoring health, or tracking action items. This information is all available within the PT database, and we feel there is potential to create a product similar to the Dashboard in PT within the visual virtual assistant.
Features:
- Ability to view deal team
- Ability to initiate a phone call from deal team page
- View trends of the credits you / your team manage
- Balance & Exposure
- Expected Loss
- Financial Trend
- Key Metric Trend
CapitalOne Support
The students will be provided with flat files which contain sample data used in CapitalOne’s proprietary and very cool Portfolio Management application, along with a data dictionary of those files. The files will be easily bulk copied into any standard database. In addition, CapitalOne associates will provide support at the beginning of the project for a project overview, and in creating the CI/CD pipeline, the initial AWS / Docker setup, and assistance in the software tool selection. CapitalOne will also provide each student with an Amazon Echo Show for the duration of the project. In addition, CapitalOne Associates will provide support and guidance throughout the project in person at the NC State campus at least one day every other week.
Architecture
The project is built using the AWS cloud and a true CI/CD pipeline. It is also suggested that the solution design include a true micro-service architecture. The technologies behind the application, service, and database stacks are at the discretion of the student, however leveraging React / Angular, NodeJS, AWS ElasticSearch, AWS CodeDeploy/CodeCommit/CodePipeline, and AWS RDS PostgreSQL are encouraged.
Students will be required to sign over IP to Sponsor when team is formed.
Eureka – Digital investing & financial planning platform driven by social network
About Capital One Wealth and Asset Management
At CapitalOne, the Commercial Bank is a Top 10 U.S. bank providing banking services to business clients with annual revenue above $10MM. Comprised of more than 2,500 associates and more than 6,100 clients, Commercial Banking manages more than $70 billion in loan commitments and more than $50 billion in deposit balances, generating over $2.1 billion in annual revenue. The product and service groups within Commercial Bank include Capital Markets, Strategic Commercial Services, Commercial Business Risk Office, Commercial Operations, and Underwriting and Portfolio Management.
Capital One Wealth and Asset Management (WAM) has over 80 years of experience in wealth and asset management, including its predecessors. WAM has over $10 billion in assets under administration and $4 billion in assets under management.
What WAM is Trying to Solve
Lack of trust: Investors (especially retail) are perplexed by investing and financial jargon. After the financial crisis, the lack of trust in financial advisors and lack of transparency in performance is affecting their participation in the markets.
Goal driven vs portfolio driven approach: While financial advisors discuss goals in portfolio objectives, their approach is portfolio driven to meet goals. WAM seeks to upend this by anchoring goals as the main factor. Investors should be able to buy and sell portfolios customized towards each goal rather than stocks or bonds customized to portfolios. Goals will not be geared towards investments alone but will be geared towards over the total asset-liability base.
Financial Social network to facilitate awareness: A social network where individual stocks or bonds are researched through crowd intelligence with analytics to support accuracy and other parameters.
Financial literacy: Promote financial literacy by tracking spending, savings, investing activities and introducing budgeting, financial alternatives and planning. Gamification or incentives can be used towards attaining these goals.
Project Eureka:
Eureka seeks to change investing for good by creating a different paradigm:
Create goals focused not only on investing but on total asset liability base and track it to optimize spending patterns and investing performance to achieve goals.
Create transparency in investing through a social network where investors are able to see other goal-based, risk-adjusted portfolios and their performance. If necessary, investors can invest in other such portfolios to achieve their goals.
Participate in and adapt to a rich suite of crowd-based research (using the social network) supported by machine learning analytics
The financial social network facilitates both crowd-based research and transparency by creating a digital marketplace for investment products which are driven by community and expert participation
Machine learning, feature rich UI will be key to this project. This project will broken down to tangible sub-set for the students to implement.
Suggested Technologies
It is suggested that the project is built using the AWS cloud and a true CI/CD pipeline. The technologies behind the application, service, and database stacks are at the discretion of the student, however leveraging React / Angular, NodeJS, AWS CodeDeploy/CodeCommit/CodePipeline, and AWS RDS PostgreSQL are encouraged.
CapitalOne Support
Capital One will provide a mock UI prototype which will explain the workflow and features as a high level overview. Capital One will provide any necessary data and work with the student to help them understand the tool and the APIs. Representatives for this project from CapitalOne will be available for the students at least once a week (or more as needed) through phone calls and meet the students twice a month to help the students.
Company Background
Capital One Financial Corporation, a Delaware corporation, established in 1994 and headquartered in McLean, Virginia, is a diversified financial services holding company with banking and non-banking subsidiaries. Capital One Financial Corporation and its subsidiaries offer a broad array of financial products and services to consumers, small businesses and commercial clients through branches, the internet and other distribution channels.
Students will be required to sign over IP to Sponsor when team is formed.
Team Resource Manager
Overview
The Trading and Fuels team at Duke Energy supports over 100 applications and is responsible for several delivery projects. Our team members need to be carefully balanced between supporting production applications and project assignments. Failure to do so could lead to production issues going unresolved, or projects not completed. The team manager regularly receives requests from project managers to assign a team member to a new project. These resource requests can easily be lost in email. Additionally, updating a shared spreadsheet can be a painful experience. Spreadsheet updates are often lost or overwritten. The team needs a system that will easily track requests, organize them, and efficiently allocate resources to projects and/or support work.
Requirements
The system will maintain a database of resources (Trading and Fuels team personnel) that are allocated to projects and production support. It will track skillsets of individuals, their typical role and what work (projects and/or support) that they are allocated to. Their work assignments should be tracked over time. There should be breakdowns of work assignments, individual assignments, and summaries.
The system must maintain the capacity of individual team members. The capacity reflects the percentage of time an individual is available to work. This is expressed as a decimal from 0 to 1; 1 indicates that the team member is 100% available to work on team related activities. In the example below, Frazier and Doeren are both 100% available. From January through March, Smith and Keatts are only 50% and 75% available to the team, respectively (this could be due to vacation, outside assignments, etc). Keatts’ capacity increases to 100% in April. This screen would be maintained by the team manager.
| Skill Set | Resource Name | Jan-18 | Feb-18 | Mar-18 | Apr-18 |
|---|---|---|---|---|---|
| DB | Frazier, Tom | 1.00 | 1.00 | 1.00 | 1.00 |
| C# | Smith, Joe | 0.50 | 0.50 | 0.50 | 0.50 |
| Java | Keatts, Kevin | 0.75 | 0.75 | 0.75 | 1.00 |
| MRS Reports | Doeren, Dave | 1.00 | 1.00 | 1.00 | 1.00 |
Individuals will be allocated to assignments, as below. These assignments could be either support activities or projects. This screen should show all allocations and be available for editing by the team manager. The units below are hours. 160 hours in one month is considered full-time.
| Resource | Jan | Feb | Mar | |
|---|---|---|---|---|
| Project - Web Trading App | Total FTE | 1.38 | 1.38 | 1.38 |
| Project - Web Trading App | Frazier | 40 | 40 | 40 |
| Project - Web Trading App | Keatts | 120 | 120 | 120 |
| Project - Web Trading App | Smith | 60 | 60 | 60 |
| Coal Purchasing App | Total FTE | 1.81 | 1.81 | 1.81 |
| Project - Coal Purchasing App | Frazier | 80 | 80 | 80 |
| Project - Coal Purchasing App | Keatts | 50 | 50 | 100 |
| Project - Coal Purchasing App | Smith | 160 | 160 | 160 |
| Support | Total FTE | 0.69 | 0.69 | 0.69 |
|---|---|---|---|---|
| Support | Frazier | 20 | 20 | 20 |
| Support | Doeren | 30 | 30 | 30 |
| Support | Smith | 60 | 60 | 60 |
The following screenshot shows team member allocations, based on capacity and assignments. Frazier and Smith are fully allocated in April. Frazier is 20% over-allocated in May, but 20% under-allocated in June. To extend the example, assume Frazier’s capacity was set to 1 in April and May. The allocation of 1.00 in April indicates that he has been assigned 160 hours of project and support work. The allocation of 1.2 in May indicates that he has been assigned 192 hours of work (and the field shows up in red, indicating a review is needed). For Smith, assume his capacity was set to 0.5 in April. In that case, the allocation of 1.00 indicates that he was assigned 80 hours of work. He too is considered fully allocated, because his capacity is half of Frazier’s. If Keatts’ capacity was 1.0 in April, then his allocation of .5 indicates that he too was assigned 80 hours of work.
| Skill Set | Resource | Apr-18 | May-18 | Jun-18 |
|---|---|---|---|---|
| DB | Frazier, Tom | 1.00 | 1.20 | 0.80 | C# | Smith, Joe | 1.00 | 0.80 | 0.00 | Java | Keatts, Kevin | 0.50 | 0.50 | 1.00 |
The basic flow described above will assist the scheduler in assigning team members to work and make sure that they are fully allocated.
In addition, there should be a way for project managers to request resources for projects. PMs should have the ability to log in to the system, enter new projects and submit requests for team members. They should be able to request individuals by name (Tom Frazier/Kevin Keatts) or by skill set (DBA, C# developer, etc). Requests will have a priority. The team manager will match requests with available resources.
Screens should be available to maintain team members, skill sets and projects, as well as providing user access to the tool. These screens would be edited by an application administrator.
A stretch goal will be for the system to intelligently assign individuals to projects based on request priority, resource need and availability. A basic algorithm should be created for making assignments. This “intelligent scheduling” could be kicked off at any time by the team manager in lieu of making manual assignments.
Application Roles
The following security roles should be set up in the application:
Project Manager: Can enter new projects and submit requests for resources.
Administrator: Can update all administrative screens: resources, projects, resource capacities, skill sets.
Team Manager: Has ability to do all things in the application, i.e. everything available to Project Managers and Administrators plus the ability to assign resources to projects/support and add new users to the system.
Technology
The application should be available on mobile devices. It can either be done as a native or web application. A relational database should be behind the front end.
Documentation
Full documentation of the system is required. This includes:
Source code documentation
A User’s Guide, in the form of a Word Document, fully describing the features of the system. This is to be a “how to” guide for the users.
A Technical Guide, in the form of a Word Document, that describes the architecture and major components of the system from a technical standpoint. The intended audience will be software developers who will be providing support for the application in the future.
LecturePulse
Background & Problem Statement
Educational technology in recent years has been the central figure in significant efforts by technologists to modernize the classroom. Personalized learning and educational technology have significant potential to revamp the classroom; in fact, studies have shown that individualized learning can lead to two standard deviations of performance improvement in an average (50th percentile test scores) student (Bloom, 1984). The heavy demand for ed tech innovation is heavy shows this potential. Y Combinator, one of the world’s most successful startup incubators, lists education as a top-priority startup category (Lien, 2017). Mark Zuckerberg recently wrote in an article regarding his foundation’s long-term goals that ed tech will be a top long-term priority, stating that “most economic issues today can be solved for the next generation by dramatically improving our education system” (Zuckerberg, 2017).
After attending many years of lectures ourselves, we have noticed two issues in the university lecture setting, issues which we believe can be solved with ed tech.
Problem #1: It’s hard for teachers to gauge, at scale and in real-time, students’ understanding during lectures.
Existing solutions to this problem include reading students’ facial expressions, explicitly asking, and conducting in-class polls. However, there are drawbacks to each: reading facial expressions and explicitly asking often yield blank stares and silence, and polls require setup and a physical device. A common problem among all of these options is that none are particularly scalable. Students have been shown to be influenced by social conformity when asked to speak up (Stowell & Nelson, 2007), or remaining silent due to social anxiety. Research has shown that electronic audience response systems correlate with higher class participation, feedback, and greater feelings of positive emotion during lectures (Stowell & Nelson, 2007).
Problem #2: Active & personalized learning techniques are not easy to adopt, and thus are not widely used.
There are many techniques and technologies that exist which attempt to bring active learning and personalized learning into the classroom; however, active learning in the classroom has not achieved the widespread adoption that it could.Though this use case is an already fairly established example of active learning (many NCSU professors use polling solutions such as Clickers from Turing Technology), it is only one technique, and it doesn’t always work well. Some professors at NCSU find it complex, too expensive for students, or that it often doesn’t “just work”.
Why haven’t more comprehensive active and personalize learning products come into use? There are a few active and personalized learning software solutions in existence, such as echo360, which seem to have a very compelling offering for active learning in higher education lecture environments. Echo360 however requires significant buy-in from the instructor; delivering a lecture essentially turns into using the echo360 product, and lecturers may not be willing to commit to such a radical change in lecture delivery. There are also a plethora of K12 educational platforms which have some active and personalized learning features, but are not geared to the university setting. However, none of the existing technologies we are aware of focus on active learning and personalized education as well as we believe we can, based on our comprehensive and novel feature set.
Low-tech solutions have limitations as well. One real-time low-tech solution to problem #1 involves periodically holding up red/yellow/green cards during lecture to indicate understanding. However, this lacks the leverage of data which an electronic version holds, and carries the social barrier of students having to broadcast to the class that they are struggling. Physically handing out “minute papers” and “muddiest topics” surveys is something else to print, carry around, and retrospectively keep track of, and cannot be associated with student accounts.
To solve these issues, we propose a “lecture delivery” software platform, which will at its core (a) help students give feedback on their level of understanding during lecture in real time, and (b) enable lecturers to effortlessly and seamlessly integrate active and personalized learning techniques into their teaching workflow. These two focuses combined contribute toward LecturePulse’s goal of helping lecturers deliver more engaging, interactive, and therefore effective lectures to improve student learning outcomes.
Product Vision
The platform will be composed of two parts: a mobile app with which students can provide feedback (left), and a dashboard for lecturers to glance at periodically while lecturing (right). A mockup is shown below.
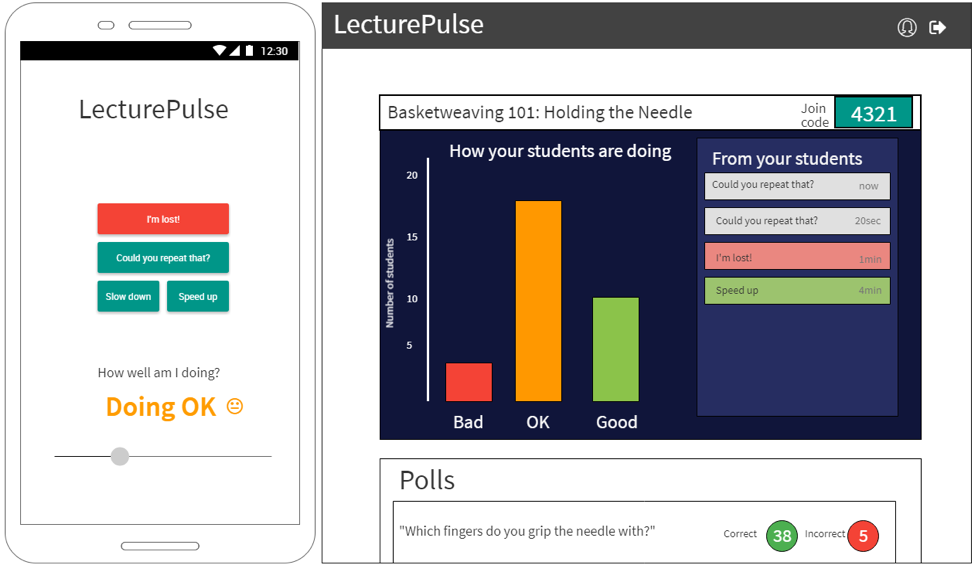
Here’s how it works. First, the lecturer comes into class, logs in to the LecturePulse dashboard on the computer at the front of the class, and creates a lecture (“Basketweaving 101: Holding the Needle” in the example mockup). Each lecture has a “join code”, and the lecturer writes this on the board (4321 in the example mockup). Students, as they come into class, enter the code into the LecturePulse app and see the screen on the left in the mockup. At this point, the lecture is ready to begin.
As the lecture progresses, students adjust the slider at the bottom to indicate how well they understand (Doing OK in the example). A histogram of slider values is displayed on the dashboard. If the professor notices a significant leftward trend in the histogram, he/she can use that knowledge to slow down and re-explain a concept. Students also can click “message buttons” to communicate with the professor. In the mockup, there are two “Could you repeat that?” messages, one “I’m lost!”, and one “Speed up” message.
The lecturer can also conduct polls. Before or during the lecture, the professor can create a poll question and then click a “Start poll” button when ready to conduct the poll. Results will be gathered and displayed either at the end of the poll or later on at the lecturer’s discretion.
Sources
Bloom, B. S. (1984). The 2 Sigma Problem: The Search for Methods of Group Instruction as Effective as One-to-One Tutoring. Educational Researcher, 13(6), 4-16.
Lien, K. (2017, September 19). Request for Education Startups. Retrieved December 10, 2017, from http://blog.ycombinator.com/request-for-education-startups/
Stowell, J & Nelson, J. Benefits of Electronic Audience Response Systems on Student Participation, Learning, and Emotion. Teaching of Psychology, 34 (4), 253-258.
Zuckerberg, M. (2017, December 13). Lessons in Philanthropy 2017. Retrieved December 13, 2017, from https://www.facebook.com/notes/mark-zuckerberg/10155543109576634/
Machine-Assisted Data Mining
A tremendous amount of data is published online every day. With the “open government” and “open science” movements, we can expect this to only increase. Unfortunately, a lot of published data is not easy to use. There are two common challenges:
There are many “standard” ways to format common items like dates, times, and geo-spatial coordinates. Usually a data set will use one format consistently, but often this format is not specified. A person using the data must then visually identify the format (e.g.
"1 Jan 2018"as"dd month yyyy") and then write or find a parser for it.Often, a single field in a CSV, JSON, XML, or other structure is actually an encoding of several pieces of information. For example, in a U.S. government data set on chronic disease occurrence, there is a field that contains, e.g. “Prevalence of chronic kidney disease among adults aged >= 18 years”. This field is probably meant to be used as a description, but it contains the relationship “aged >= 18 years”. A person using the data may need to extract the variable (e.g.
"aged","located", etc.), the relation (e.g.">=","in","near"), and the value (e.g."18 years","Nebraska","San Francisco").
A promising way to address both of the challenges above is to deploy an extensible arsenal of parsers. Rosie Pattern Language (http://tiny.cc/rosie) is a pattern matching system that extends the idea of regular expressions, and includes a library of pre-defined patterns that match a variety of standard formats. RPL can be used as a command-line utility or within a program (Python, C, and some other languages are supported).
To address challenge #1 (above), a program (written as part of your project) could try all of the standard patterns in the RPL library to determine which standard formats are being used in a given data set. User confirmation may be needed when there are several patterns that match, and the user may need to create a new pattern when no existing pattern matches.
To address challenge #2, your solution could first apply basic patterns that match numbers, symbols, and words to a data field to recognize some field constituents. Ideally, your solution will then be able to identify cases in which there is a variable, a relation, and a value, and present this to the user. Then, the user can either confirm that the program identified these fields properly, or make corrections.
Your solutions to challenges #1 and #2 will extract sample data rows from a data set, and after interacting with the user, should be able to successfully parse the complete data set.
A good demonstration would be to process some of the files available from https://www.data.gov/, for example:
| Data source | Example entry (simplified for presentation) |
|---|---|
| U.S. Chronic Disease Indicators | 2015,NC,North Carolina,BRFSS,Chronic Kidney Disease,Prevalence of chronic kidney disease among adults aged >= 18 years,,%,“Black, non-Hispanic”,“(35.466220975000454, -79.15925046299964)” |
| U.S. Local Climate Data | WBAN:94846,CHICAGO OHARE INTERNATIONAL AIRPORT IL US,201.8,41.995,-87.9336,2014-03-01 00:51,FM-15,SCT:04 70 OVC:08 90,10.00 |
The ideal demonstration of the project would be something like this:
A selected data file is processed by your solution, and is then parseable. Your solution shows the user a list of the data fields and their types ( e.g. year, geo-location, description, relation).
The user enters some keywords (“chronic”, “kidney”) that must match one of the fields (e.g. description).
The user is presented with the relationships found in the data, and they choose a variable, a relation, and a value, e.g. (“aged > 60 years”).
All records (“rows”) matching the keywords and the relationship are extracted.
If the data set contains geolocations, the location of each row is shown on a map (using an existing mapping API, e.g. from google).
RPL Doc Builder & Explorer (and More)
The ease of use of open source projects varies greatly. Some projects are really easy to install, and have great documentation, but most do not. Rosie Pattern Language (http://tiny.cc/rosie) aspires to be easy to get started with, but needs your help to fulfill this vision.
Rosie extends the concept of regular expressions for pattern matching to include libraries of named patterns. Libraries can be created by Rosie users and shared online. There is also a set of standard libraries that are bundled with Rosie. Therefore, documentation for Rosie must include not only the RPL language, but also the libraries.
The RPL documentation is already written (in markdown, convertible to html). But the libraries of RPL patterns are not documented, and neither are the libraries written by users. Fortunately, the information needed to create the documentation automatically is in each RPL file: dependencies on other libraries, pattern names and comments, and examples (unit tests) of strings that the patterns will match and won’t match.
In this project, you will design and implement (1) an automatic RPL document generator, (2) a document explorer, and optionally (3) a browser plugin that lets the user browse RPL files online (e.g. GitHub) or on the file system, with documentation created on the fly and displayed for the user to read.
Here are some considerations regarding each component:
(1) Doc generator (for RPL files)
Should documentation be created directly, or should there be a (simple) data format produced first? I.e. should there be a front end which processes RPL files, and a separate back-end that produces html?
How can the documentation files be kept up to date, when the source RPL files may change?
Can the html output be used statically (without a web server)?
Should the generated documentation integrate with the RPL language documentation in a shallow way (just a link) or in a deeper way (e.g. links for each of the “RPL language features used on this page”)?
Does RPL need a convention for including a “docstring”, i.e. a comment that describes a pattern or a library (package) of patterns? What would it look like if this were included?
(2) Explorer
As a Rosie user, I want to find things in the RPL libraries that I have downloaded. If I enter some keywords, can I see all the RPL package names and pattern names that contain those words? Suppose a keyword is present in a literal string, or in a comment in an RPL file?
Should there be a CLI? If the Rosie user is working at a terminal, can they explore the documentation that way? Can html links in the output be used to direct the user to more complete documentation?
Should there be a web UI? How can it include both the generated documentation from (1) above, plus the ability to search for keywords, and to browse dependencies?
(3) (Optional) Dynamic doc generator/browser
Is a browser plug-in the right implementation? Would a web application be better?
What is the right user experience when the user is browsing, say, github, and they run across some RPL files? Should your solution recognize this and automatically generate documentation for those files? Should it instead add a button that allows the user to request this?
Should the generated documentation appear in a pop-up window? A split window? Some other, more integrated way?
Data Viz-Insight Engine
As information becomes more plentiful and valuable, the feedback on that data is crucial to sorting through the noise and finding the best parts. The same info could be positive or negative depending on various factors such as the viewer’s context or other geographic and business conditions. Putting all this information together and allowing customers access to the results can be a daunting task and consume many days of manual work.
Ipreo & Information
Ipreo is always looking for ways to improve the relationships between buy and sell side clients (for example, by understanding what drives their investing decisions using perception studies (https://ipreo.com/perception-studies/)). A large part of that work is to quickly visualize the feedback provided on the companies and information Ipreo has surveyed on behalf of our clients. Once available, the information needs to be explorable so they can find the core nugget or key point in what makes that data point special.
This Semester’s Assignment
We are looking for a group of creative students who can help design and develop a user-centric analytics tool to help Ipreo’s clients evaluate and review their data on their investors’ concerns as identified from perception studies. The ideal solution would provide for insightful data review and allow ah-ha moments for the client teams. The solution would embedded with our current offerings (see screenshot below) while allowing more exploration of the data and be extendable by future teams.
NCSU Student Experience
Senior Design students in the College of Engineering, Department of Computer Science and design professionals at Ipreo will have a unique opportunity to partner together over the course of the semester to develop a data visualization & insight engine for Ipreo, as they would experience in real world product development. Additionally, students will have access to top industry professionals to assist in Agile/Scrum practices, overall developing/coding and testing.
Students may be required to sign over IP to Sponsor when team is formed.
Computer Vision API, Handwritten OCR
Background
With advancements in artificial intelligence, we are seeing waves of new services offered by large and small cloud services providers. Digital documents, images and handwritten text are captured, analyzed, and predicted like never before with “Vision APIs” on the market. Though, while Optical Character Recognition (OCR) has been an established field in computer engineering for many years, some aspects were never fully solved until now.
LabCorp® is looking to sponsor a project for a handwriting and vision API, which allows to submit a handwritten note (from thousands of different users and/or systems) and images to identify the content, validate the content against several services like dictionaries, healthcare specific nomenclature, address validation services and much more. The project will include the research of strengths and weaknesses of publicly available services, the creation of service APIs to be consumed in real-time, and a user interface to submit and edit the outcome. Depending on the progress of this project, the service API should be able to learn from the outcome and enhance future Vision API requests.
Expectations and Goals
The student development team will engage on a regularly set schedule with designated mentors from LabCorp®. LabCorp® will provide guidance about enterprise scale architecture and technologies, but leave the students engineering creativity a focus point of the project. We will encourage and maintain an ongoing dialogue with the team about how modern research from the students can enhance existing approaches.
The outcome of the project should create a demonstrable solution, which allows the submission of a digital handwritten image and machine written document through a service interface. The documents will be translated in real-time and the service will return the identified content, the validated state of the content, and other meta data important for consuming systems to use the outcome. The idea behind this service is to enhance medical outcome and testing by reading handwritten diagnosis codes from physicians or other healthcare providers. The ultimate goal is to have information technology have a direct impact on millions of lives daily.
Skills, Technologies, Constraints
The preferred programming languages are Java and JavaScript for the service API. Input and output format should be JSON based. The service has to fulfill stateless and RESTful standards. The API layer can be created as a server based application, which is performant and can scale, or be a serverless implementation with the Serverless Framework (https://github.com/serverless/serverless).
About LabCorp®
Did you know that the largest healthcare diagnostics company is right in your backyard? Based out of Burlington, North Carolina, LabCorp® has a lot of different research and development centers around the country including the Research Triangle Park (RTP) in North Carolina.
Laboratory Corporation of America® Holdings (NYSE: LH), an S&P 500 company, is the world’s leading healthcare diagnostics company, providing comprehensive clinical laboratory and end-to-end drug development services. With a mission to improve health and improve lives, LabCorp delivers world-class diagnostic solutions, brings innovative medicines to patients faster and develops technology-enabled solutions to change the way care is provided. With net revenue in excess of $10 billion in 2017, LabCorp’s 57,000 employees serve clients in 60 countries. To learn more about LabCorp, visit www.labcorp.com, and to learn more about Covance Drug Development, visit www.covance.com.
Students will be required to sign over IP to Sponsor when team is formed.
Synthetic Data Generation (SDG)
Who We Are
PC Core Technology is a technology team in Raleigh, NC that’s part of Schwab Technology Services in Charles Schwab. They build comprehensive technology offerings for end investors and for financial advisors to help them manage their business and their client’s investments. This team develops applications for desktop, web, and mobile platforms that provide industrial strength solutions using technologies and frameworks such as C#, Mongo, SQL, C++, HTML5, Angular.JS, JSON, and REST. We concentrate on the fundamentals of architecture, design, development, and quality assurance to build applications that stand the test of time which is critical in the financial industry.
What We Are Looking for In the 2017 Spring Project
Synthetic Data Generation (SDG) is an application that will allow Schwab to efficiently plan generation of test data for load and performance testing of its applications. SDG will be a true application development effort with a focus on customer (Schwab managers) efficiency and a complete end product based on specifications.
Project Description
Synthetic Data Generation is the ability to generate load data based on the characteristics provided in the user interface. On a periodic basis there is a need to generate data for load and performance testing of various applications within Schwab. This is necessary to understand the performance of the applications during peak load. The characteristics of the generated load can be similar to the input data or can be tuned to represent a certain load condition that is atypical. SDG will offer a user interface to define the amount of load to be generated and the type of load to be generated based on certain tuning parameters. This tool will accept generic file format and tuning parameters and generate the load accordingly.
Data Input
The Schwab team will provide the config file schema that will act as an input to the tool. This needs to specify various parameters like field name, field data type, field location, etc.
Graphical Display
The UI layout should be dynamic and be based on the input configuration file. The UI should be dynamically generated based on the input configuration file giving the ability for the user to tune the synthetic load based on any input feature. For every feature in the input, the UI should be able to define its properties such as
Range, mean, median, variance for numerical data
Various levels for categorical data and the distribution of each level
Application Development
Using the parameters set on the UI, the application should then generate the necessary load with the characteristics for the load provided as the input.
Project Approach and Technology
The project will be based on some of the technologies Charles Schwab has been using for product development. This list may be altered depending on the teams’ existing technology strengths. Technologies may include:
C#, JavaScript, and/or HTML5 may be used for the project development based on the team’s abilities and desires
REST for web services if required
SQL for the database
Python and other machine/Deep Learning tools if necessary for TMR project
Charles Schwab strives to develop using best practices while remaining agile. We use the SCRUM and Kanban methodologies and will run the senior project within a similar methodology used by our teams. One mentor will be selected from our development team to be the primary interface with the project team, but other members of our staff will be brought in from time to time to assist with the project.
Project Success
Success will be based on the following accomplishments:
Participating using a SCRUM methodology to understand the benefits of agile development.
Requirements (epics and user stories) will be provided to the team by the Charles Schwab staff. The team will successfully groom the user stories to provide initial estimates.
Breaking down the user stories into logical tasks and providing task estimation. This will be used to prioritize features within the semester’s time box.
Architectural and design documentation produced for data and user interface components. A variety of UML and white boarding documentation will be used.
Producing quality code (well organized, performant, documented)
Developing a test strategy for unit, component, and overall quality assurance.
Working application based on the initial requirements and negotiated prioritization completed and demonstrated to internal Charles Schwab staff.
What Charles Schwab Gains From the Senior Project
Charles Schwab is interested in engaging with the brightest students in top tier computer science programs. New projects have allowed us to open a number of positions for recent and upcoming graduates. We hope to establish strong ties with the best students during their senior year which could then lead to jobs opportunities when they graduate.
Students may be required to sign over IP to Sponsor when team is formed.
Predicting Part Failure & Spare Parts Planning
Siemens Healthineers develops innovations that support better patient outcomes with greater efficiencies, giving providers the confidence they need to meet the clinical, operational and financial challenges of a changing healthcare landscape. As a global leader in medical imaging, laboratory diagnostics, and healthcare information technology, we have a keen understanding of the entire patient care continuum—from prevention and early detection to diagnosis and treatment.
Molecular Imaging (MI) and Managed Logistics (ML)
Medical imaging helps to advance human health globally, supporting early and precise diagnosis, a specific, less invasive therapy and solid after care. Answering to clinical needs in radiology, oncology, neurology and cardiology, Siemens molecular imaging systems (e.g., PET and CT scanners) provide solutions to help clinicians more confidentially diagnose, treat, and monitor disease.
MI systems will require maintenance (both planned and unplanned) throughout their life and spare parts are often needed to resolve issues. This is where Managed Logistics comes in. ML provides logistical support to our customers. We help to deliver confidence by effectively managing the spare parts supply chain. In other words, ML’s mission is to get the right part to the right place at the right time.
Project Overview
The current forecasting models ML executes to plan for future spare part demand is based on time series modeling. Using historical order volumes and these models, ML is able to achieve high part availability while at the same time keeping inventory costs low. Time series models are excellent at forecasting overall trends but often fail to predict unanticipated spikes and troughs in demand. Being able to accurately predict individual part failures in deployed systems would be a significant game changer for the way we manage supply chain operations.
Just as we in ML continually seek improvement, so do the engineers who develop the MI systems. With the advent of the Internet of Things (IoT), Siemens is developing “smart parts” to proactively alert potential failures. This access to large amounts of data streams from the machines in our MI installed base present a great opportunity for ML to leverage this information. Are you ready to turn this opportunity into reality?
Project Scope
This project will be broken out into three distinct phases:
Phase I – Data Parsing of MI System Logs
MI has created a data lake that stores the system logs that contain all discrete events for each machine, which is referred to as a functional location. The logs essentially contain every action performed at the functional location (e.g., power on/off, system initialization, scan initiation, failure tests, etc.). As you can imagine, these logs can get very large for machines running 12+ hours a day. Furthermore, these logs are long strings of text that cannot be easily read by the human eye. Although it might be challenging, we anticipate this log data can be parsed and formatted into a structured format. All logs are captured from the same “family” of functional locations within the Molecular Imaging technology. This means that all logs generated will be in the same format and similar discrete events will be tagged uniformly. We are asking you to develop the logic/queries/algorithm(s) necessary to transform these logs into a more conventional data format. Since all logs have the same format, the logic will apply to all logs from each functional location. The tools and methodology you employ is up to you. But we will require the output to be delivered in a commonly accepted structured data format (e.g., CSV, XML).
Phase II – Part Failure Prediction with Machine Learning
After the structured data set for the MI functional locations is created, the next step will be to integrate spare part consumption data for each functional location. The spare part consumption data is a small dataset that contains the date, part number, and quantity for spare parts ordered and installed at each functional location (example provided below). Combining these two datasets will enable us to analyze log data in relation to spare part consumption. We anticipate certain patterns will emerge in the MI log data that will help predict specific part failures.
Identifying all the potential combinations of system events and analyzing these patterns “by hand” is an arduous task to say the least. But there are several techniques in the field of machine learning that could yield highly effective prediction models. We are asking you to research and recommend potential machine learning techniques that could be implemented based on the dataset. After reviewing your recommendation, we would like you to implement the learning model with ~ 95% of the data set and apply that model to “predict” the part failures for the remaining data. In other words, we are asking you to build the prototype to predict the spare parts needed and evaluate the accuracy of the model. As with Phase I, we are flexible with the solutions used but we will require that all methods are clearly explained and documented. Recommended machine learning techniques to begin your research are Decision Trees (CART), Support Vector Machines (SVM), or Artificial Neural Networks (ANN) to name a few.
We at Siemens realize that as computer science students you might not have had a lot of exposure to data analysis and machine learning. But if you are a student that has taken analytics or data science courses we think this could be an excellent opportunity to combine your skills and talent to accomplish something very impactful. Because of the scope for Phase II, Siemens is committed to working closely with you to ensure that this project is solvable and successful.
Phase III – Reporting of Prediction Results
Based on the prediction models developed in Phase II, we are requesting that you develop a mechanism (e.g., dashboard, alert bulletin) that will help ML identify upcoming part failures. While the content of this tool is not defined at the moment, we envision that it will contain the spare part, functional location, and date associated with the impending predicted failure. In other words, show us the prediction results in a way that is easily interpreted.
Are you up for the challenge of developing this supply chain management game changing innovation?
Spare Part Consumption Data Sample
| Order Created | material_nr8 | quantity | FL |
|---|---|---|---|
| 12/1/17 12:11 AM | 10522041 | 1 | 400-010960 |
| 12/1/17 1:12 AM | 10412189 | 1 | 400-029235 |
| 12/1/17 12:06 AM | 10909856 | 1 | 400-028439 |
| 12/1/17 12:21 PM | 04361585 | 2 | 400-028440 |
| 12/1/17 4:26 PM | 05989228 | 1 | 400-028441 |
| 12/1/17 7:21 PM | 11296055 | 2 | 400-031821 |
| 12/1/17 9:56 PM | 07833192 | 1 | 400-024036 |
| 12/1/17 8:06 PM | 08423472 | 1 | 400-033380 |
| 12/2/17 1:21 AM | 10763443 | 1 | 400-014751 |
| 12/1/17 11:01 PM | 10412000 | 1 | 400-032146 |
Students will be required to sign Non-Disclosure Agreements and sign over IP to Siemens Healthineers when team is formed.
Facial and Emotional Recognition Monitor
Problem Statement
There are many jobs that require a person in a position of some power or authority to deal with people’s requests or make challenging decisions. In the fields of law, business, economics and others, it is often assumed in theories and lessons that all actors participating in the system are completely rational at all times – something that we as humans know is not always true. In fact, studies have shown that a person’s mood can have a huge influence over the decisions they make, even in the cases of huge decision-makers like business owners and judges.
There is a whole sub-field of economics called Behavioral Economics that studies the psychological, social and emotional factors that affect market prices. Furthermore, a well-known publication by the Proceedings of the National Academy of Sciences shows that the chance of a judge granting an inmate parole decreases from ~65% in the morning, to ~0% right before lunch, and back up to ~65% right after lunch. That’s a year of a person’s life in prison depending on if a judge is hungry or not! There are other more minor cases as well – sometimes we simply let our sour mood affect our dealings with our co-workers in a negative way. We would like to create an application that helps people to be aware of how their emotional state might affect their dealings with others – and if possible, uplift them.
Requirements
We would like to create a Universal Windows Platform (UWP) application that uses facial and emotional recognition software to plot a chart of the user’s mood throughout the day. The application would use the webcam already present in most people’s laptops to gather facial images for analysis (with the user’s permission, of course). The application will analyze the pictures it takes using facial and emotional recognition libraries, and store the resulting data. The application can then calculate an “average mood” statistic over a period of time, and compare new data against this to detect when the user’s mood is especially low or high for the current day and time. From that point there are a number of possibilities, such as displaying an animation or suggesting the user watch a funny cat video on YouTube. We would like to notify or uplift an aggravated user without causing them further aggravation!
Technology Preferences
The choice of technologies and libraries is mostly left to the team, but as Avanade is a Microsoft subsidiary we have a couple technology preferences:
Microsoft Windows development environment
Microsoft Azure for hosted services
Azure Cognitive Services emotion detection
Validated Crypto for Java Cryptography Architecture
Background
Cryptography is very important in today’s world. Improper or maliciously altered crypto implementations have been a big concern for the industry in recent years. To alleviate the risk, Cisco has been working with the National Institute of Standards and Technology (NIST) on finding ways to validate crypto implementations. The output of these efforts is the Automated Cryptographic Validation Protocol (ACVP). ACVP enables crypto implementations to interact with a server that provides crypto test vectors which the crypto implementation encrypts and sends back. The server can then check for correctness which would mean that the algorithms are implemented correctly. ACVP can be used for Federal Information Processing Standard (FIPS) validations of the cryptographic modules. Cisco has open-sourced an ACVP client that implementers can use to validate and certify their algorithm implementations against NIST’s or 3rd party servers.
One of the challenges of ACVP adoption and growth is that the client has to be customized to each specific crypto provider. Cisco has contributed a C-based ACVP client that integrates with OpenSSL. Concurrently, RedHat has contributed an ACVP client that integrates with NSS. The goal for this project is to create a new Java ACVP client that integrates with the Java Cryptography Architecture (JCA). In doing so, any Java crypto providers that implement the JCA interface could be validated using the new ACVP Java Client.
Description
In this project we want to introduce a Java ACVP client for the Java Cryptography Architecture. ACVP can be used to validate the integrity of Java-based crypto providers.
-
We want to extend the open-source ACVP client library to integrate and validate a single implementation (Sun or SunJCE) of the JCA. The updated ACVP client should be able to run the crypto algorithm implementations from these libraries against the NIST ACVP server test vectors to validate the crypto modules. Running the new Java ACVP client code in a web browser is encouraged, but not mandatory.
-
The existing ACVP client implementation must be ported to Java JDK 8. This includes server connectivity work to the existing ACVP server.
Required Student Skills
-
Students must have taken or be taking at least one course in security or cryptography.
-
Experience in Java programming and familiarity with JSON.
-
Familiarity with Git and GitHub.
-
Motivation to work on an interesting topic and try to make an impact.
Motivation
Students will be able to work on a new and interesting practical industry problem. Cryptography and security are hot topics today. NIST, Cisco and other companies have been trying to address the validated crypto issue for some time. Java Security is also one of the hottest topics in the industry today. Marrying the two subjects and planting the seed for standardized, validated crypto will allow the students to get familiarity with interesting topics and see where the industry is moving towards. They will also get to use common tools like Git and see how cryptography is implemented in the real world.
Since Cisco has been actively working on ACVP and validated security, this project will allow us to make the case for the industry to consider validating lightweight crypto in an automated fashion. With this project we will be able to prove that it is possible by integrating the ACVP library with at least one lightweight crypto library. We could also gain knowledge about potential changes to the ACVP protocol that enable its use for crypto validation in Java-specific environments.
Deliverables
-
A new fork of the open-source ACVP client should be created in the GitHub repository. The existing C-based client should be ported to Java JDK 8. A Git Pull request should be completed to deliver the changes into the public repo.
-
A new implementation of the Java ACVP client that integrates with and validates the Java Cryptography architecture.
-
A new, working main Java application should be included in this code demonstrating how the new ACVP Java client can be used in an application.
Reference Implementations for X.509 Certificate Generation and Revocation Status Checking
Background
One of the main pain points of Public Key Infrastructure (PKI) implementers is consistently verifying certificate status. Even though a lot of the functionality and command options are built into standard certificate libraries, there are no good native implementations that can be used by developers to check the revocation (CRL, ARL, OSCP, OCSP stapling). Additionally, there are no reference implementations that we are aware of that can be used to verify the CA transparency logs for a certificate. Thus, development teams that are inexperienced in Digital Certificates cannot enforce these checks easily.
Description
In this project the students will implement a reference implementation that will be used as a best practice for product teams within Cisco, and potentially the industry, who want to check the status and legitimate generation of a X.509 certificate. Revocation checks to focus on are OCSP, OCSP stapling, CRLs, ARLs and authorization and validation list (AVL). The reference implementation should be coded in C for the OpenSSL library and open-sourced as a GitHub project.
Long-lived certificates need to use revocation in the event of a compromise or an operational change, but short-lived certificates potentially don’t need the extra burden of revocation. There is no need to revoke a key that will expire in a few days anyway. Short-lived certificates seem to be gaining traction within the industry. We expect the students to investigate, research and perform an operational challenge (where things can go wrong) analysis of using revocation and CA transparency logs compared to short-lived certificates.
Required Student Skills
Students must have taken or are currently taking at least one course in security and have some familiarity with cryptography, PKI and X.509 Digital Certificates.
Experience in C programming.
Some familiarity with OpenSSL.
Familiarity with Git and GitHub.
Motivation to work on an interesting topic and an opportunity to make an impact.
Motivation
Students will be able to work on a practical industry problem. Cryptography and security are hot topics today. Cisco product teams have a need for this work, so the students will contribute to addressing a real industry need. They will also get to use common tools like Git, see how cryptography is implemented in the real world and get exposure to OpenSSL, an industry standard security library.
Since Cisco has a need for a reference implementation of certificate checks, this work will be evangelized and used within the company. We will also evaluate our stance on short-lived certificates based on the results of the analysis from the students.
Deliverables
Open-source reference implementation that performs the CA transparency and revocation checks should be published in GitHub.
Revocation, CA transparency challenges vs short-lived certificates analysis document.
Vehicle Network Solution for ecoPRT

Background
Personal rapid transit (PRT) is a maturing technology that could offer an alternative to traditional transit systems like bus and rail. EcoPRT (economical PRT) is an ultra-light weight and low-cost transit system with autonomous vehicles that carry one or two passengers at a time. The system has dedicated guideways where the vehicles are routed directly to their destination without stops. The advantages include:
Dual mode – existing roadways and pathways can be used for low install cost in addition to elevated roadways at a cost of $1 million per mile
A transit system that is much quicker and less costly than either bus and light rail
A smaller overall footprint and less impact on the surrounding environment so guideway can go almost anywhere.
The research endeavor, ecoPRT, is investigating the use of small, ultra-light weight, automated vehicles as a low cost, energy efficient system for moving people around a city. To date, a full-sized prototype vehicle and associated test track have been built.
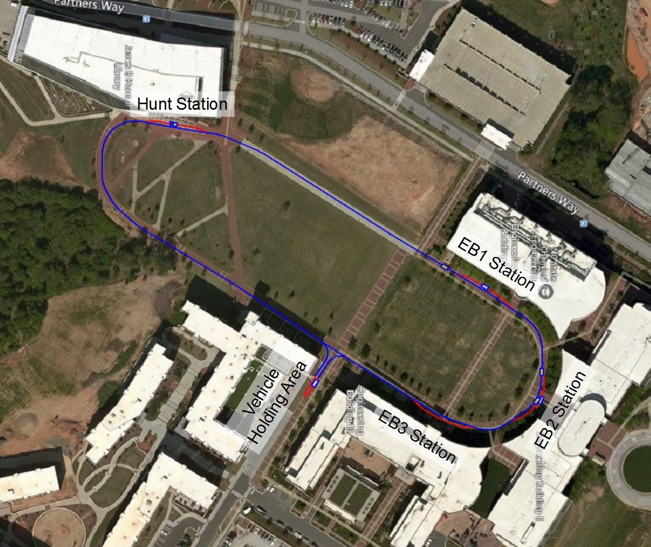
Oval Project
As a demonstration site, we are proposing running a fleet of 5 or more vehicles on the walkway connecting the engineering buildings to the Hunt library. (See figure). For each building there will be one station (5 overall) stopping near the entrances of EB1, EB2, EB3, the Hunt Library, and Oval Dining. Vehicles will be waiting at each location or can be called up through an app on a smartphone.
What is the specific problem or issue
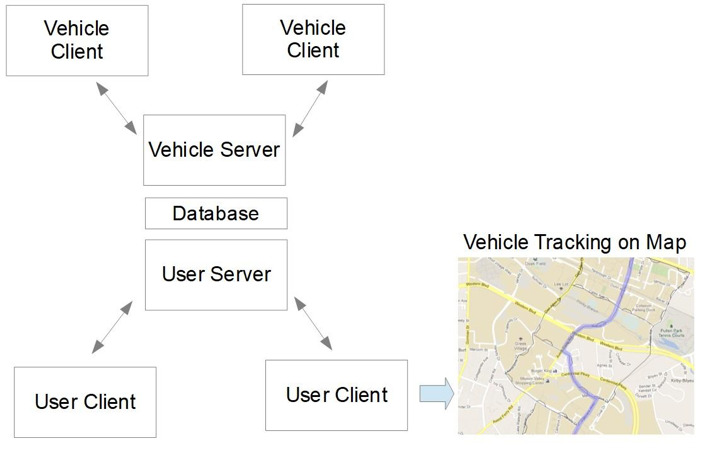
With the aim of running a multi-vehicle live pilot test on the Oval, the goal is to create a Vehicle Network Controller (VNC) to guide the vehicles and provide interaction to users. Currently, the architecture looks like the following where the vehicles communicate to a vehicle server, and vehicle data is saved into a database. On the user side, the user clients (web or mobile based) interact with a user server that shares the same database. The user server should provide some sort of tiered security access where nominal users would allowed to select destinations and view their vehicle on a map, but administrative users could see key vehicle and network statistics.
Authentication would require at the least “nominal users” and administrators. Some of the tasks the nominal users could do include calling a car to a certain location, finding out where available cars are currently located, or reserving a vehicle for sometime in the future. Administrative tasks could include: viewing all cars, overriding vehicle routes as needed, rerouting vehicles, viewing diagnostic data, receiving emergency statuses from the vehicles.
In later stages of development, algorithms could be developed that efficiently route vehicles from one location to another based on overall demand and vehicle locations of the network.
Simulation of the network will be accomplished by integrating an existing vehicle simulation client into the VNC network. This will be the main method of testing and verification before connecting to real vehicles.
Currently, a team of NCSU graduate students is working on all layers of this VNC. The team of students from CSC senior design will be integrated with the graduate students to work on all aspects as a whole. In effect, everyone will be working as a team on the project. Mentors will be meeting with the CSC Senior Design team weekly. Architecturally, there is a need to build out the user client and user server architecture along with demonstrating VNC with multiple (simulated) vehicles attached to it.

Project Team Specification
Desired Competencies:
Server/client programming experience. Interest in Angular and Node js framework, C++ socket programming as well.
Server architecture experience. Interest in database development. MySQL, PostgresSQL options
Interest in front-end user design
Interest in Autonomous Vehicles / Technologies.
Retirement Plan Fund Scorecard
Problem Statement
Plan Sponsors are individuals responsible for selecting the lineup of mutual funds offered by a retirement plan to participants of that plan. Sponsors have a fiduciary duty to select a balanced and diversified array of funds to make sure participants can effectively save for retirement. There are two common issues that Sponsors run up against which can expose their company to risk of litigation:
Plan Sponsors do not actively review fund lineups to insure that the funds are performing on par with specific benchmarks.
Plan Sponsors include mutual funds in the lineup because their company has an interest in the funds succeeding
- http://www.latimes.com/business/hiltzik/la-fi-hiltzik-ge-401k-20171017-story.html
Project Description
Build a web application that will display to Plan Sponsors the “Score” of their mutual fund line-ups. The app will:
Take as input an array of plans(mutual funds and investment options) offered by the plan and use current and historical performance data to compare the plans to specific benchmarks like the DJIA.
The application will “score” individual funds and roll up that information into a meaningful representation of the plan’s line up.
- NCSU team will be asked to develop scoring algorithm with help from Fidelity team.
The application will factor in fund fees, risk tolerance and potential Sponsor conflicts of interest.
The application will provide breakdowns based on asset class and sector.
Some info to get started:
Preferred Student Skills
- Angular / CSS / HTML
- Java / Spring
- Rest
- JSON
- Agile/Scrum
Elastic Stack Visualization and Analysis Application for StorageGRID Webscale
Background
StorageGRID Webscale is NetApp’s software-defined object storage solution for web applications and rich-content data repositories. It uses a distributed shared-nothing architecture, centered around the open-source Cassandra NoSQL database, to achieve massive scalability and geographic redundancy, while presenting a single global object namespace to all clients.
Supporting a scale-out distributed system like StorageGRID Webscale presents a unique set of challenges. If something goes wrong, the root cause analysis may require piecing together clues scattered amongst log files on dozens of individual nodes. Due to the complexity involved, a lot of information is recorded for every transaction, but this leads to an overwhelming amount of log data – often, identifying what information is relevant is the hardest part of solving a problem.
Project Goals
Implement a log ingest, indexing, and analysis tool for StorageGRID Webscale based on Elastic Stack (Elasticsearch/Logstash/Kibana).
The tool should have the ability to ingest and index StorageGRID Webscale log file bundles retrieved from multiple customer sites.
The tool should provide an StorageGRID-aware data analysis UI that makes it easy to answer questions such as the following:
Show me the transactional history of a specific object stored in the grid (when and where was it ingested, relocated, replicated, or redundancy-reduced, overwritten, et cetera)
I’ve found this curious-looking log message. How often do similar logs occur at other customer sites?
Oct 20 07:59:07 RZ2-S1 ADE: |21317532 80800 0000000000 ???? ???? 2017-10-20T07:59:07.026927| WARNING 0120 ????: Failed to execute cql: SELECT nameless_objects, s3_buckets FROM storagegrid.object_counts - Cassandra Driver Error(Read timeout):‘Operation timed out - received only 1 responses.’
Help me visualize the aggregate transactional history of objects in a specific customer grid along a variety of axes, so I can determine whether a few objects known to have suffered loss or damage are all members of a well-defined object family.
Stretch goal: These two support cases from different customer sites have similar symptoms. Are there any patterns common to the logs from those sites but not commonly found elsewhere that may point to root cause?
Deliverables
- Packaged Elastic Stack application suitable for installation into one or more Elastic Stack instances maintained by NetApp for StorageGRID support use.
Development Environment
On-premise or in-cloud Elastic Stack instance
Elastic Stack consists of Elasticsearch, Logstash, and Kibana
Elasticsearch is implemented in Java and provides a JSON-over-HTTP API; clients are available in multiple languages including Java and Python; it is the back-end fulltext search engine you will use for this project.
Logstash uses JSON-formatted configuration files to define how incoming logs should be processed and forwarded to Elasticsearch.
Kibana is a browser-based web interface for searching and visualizing logs, written in JavaScript.
NetApp will work with the student development team to determine whether a locally hosted or AWS-based Elastic Stack instance is the preferred development environment. Should AWS be selected, NetApp will cover reasonable costs associated with the development instance.
Exemplar StorageGRID log bundles provided by NetApp
Helping Hands Training Portal
About The Collaborative
The NC Collaborative for Children, Youth & Families (“The Collaborative”) is a non-profit group of cross-system agencies, families, and youth who educate communities about children’s issues, support the recruitment of family and youth leaders to provide input into policy and training, and organize support to local systems of care groups.
The Collaborative has been working to improve their website and use of social media to promote understanding of children’s issues. They need assistance with developing online training and ways to deliver their message to communities about children’s needs.
Social workers throughout the state come to this website to become trained and certified to be able to serve as a mental health consultant with children and families (they can also go to in-person workshops to be trained if they prefer). Employers pay for the training and, when training is completed, a box is checked off and the trainer is certified. Currently, there is no assessment or monitoring involved.
Project Description
The Collaborative would like to build more into their website that allows for assessment of a person who is trained (via something like a quiz) and then some sort of open-ended feedback on how participants use their trainings (this could be in the form of sharing of best practices, some sort of chat room, etc.). Eventually, the Collaborative would like to offer a pilot study to see if these additions improve the quality of service in the field.
The Collaborative would also like to offer additional trainings (other than the major one described above) via their website, with assessment, and perhaps a dashboard of some sort for participants to keep track of training hours and assessments (including the major one, above). Perhaps potential employers could also come to this site to view dashboards of potential employees or employees could point to dashboards from their resumes (requirements to be determined!).
Last semester, a Senior Design team created a framework for a training portal website where:
Users can register and log in/out.
Administrators can add/edit training courses, quiz pages, and timeline events.
More features are needed to complete this system.
Technologies used included: NodeJS, Sequelize, Express, Handlebars, MySQL, Bootstrap, and jQuery. This semester’s team will be given access to last semester’s codebase and documentation.
Vulnerability Management Residual Risk Calculator
BB&T Corporation, headquartered in Winston-Salem, North Carolina, and its subsidiaries offer full-service commercial and retail banking and additional financial services such as insurance, investments, retail brokerage, corporate finance, payment services, international banking, leasing and trust. BB&T Corporation is an S&P 500 Company listed on the New York Stock Exchange under the trade symbol BBT. More information about BB&T can be obtained at www.bbt.com.
BB&T has been enhancing its cyber security program and would like NC State students to help BB&T build a web application that calculates and reports inherent and residual risk for vulnerabilities in the environment.
The student team will create a web application that can be used to calculate a custom vulnerability risk score for BB&T utilizing industry frameworks and inputs as base criteria. BB&T would have custom risk inputs to calculate a residual vulnerability risk score modeled after CVSS (Common Vulnerability Scoring System). This project should incorporate the development of a web front- and back-end that utilizes a user definable risk ruleset. This will incorporate API development to automate collection of data from open and closed vulnerability frameworks such as NIST, CVSS, and Qualys.
Desired Outcomes
The development of an algorithm that can calculate and assign residual risk based on both programmatic and manual inputs.
The development of a platform-independent data store, which can be NoSQL or SQL-based.
A working proof of concept that can be leveraged by BB&T’s Vulnerability Management Team.
Implement scheduled pulls of vulnerability data from frameworks (i.e. https://nvd.nist.gov/vuln/data-feeds)
Platform Requests
- Python is the preferred development language
This independent project will provide BB&T with the ability to apply proactive protections on perimeter controls while helping refine prioritization efforts pertaining to new vulnerabilities.
Students will be required to sign over IP to Sponsor when team is formed.
PDF Review Tool
In 2014, the Developer Liberation Front began work on an open source tool called pdf-reviewer that made it easier for researchers to collaborate on providing feedback on each others’ writing. In short, the cloud-based tool takes a PDF file (example) with comments on it, then creates a GitHub issue for each comment in that PDF file (example). The tool ensures that the author can address each comment/issue systematically, that each comment/issue can be discussed by the author and reviewer, and that every issue can be linked to a change to the paper. In 2017, due to changes in the underlying cloud platform, it no longer became feasible to run the tool.
We are requesting a senior design team revamp our tool in our existing GitHub repository, reusing our existing codebase to the extent possible. For maintainability reasons, we request that development be done in Java. Completion of two basic development tasks are required:
Choose a new cloud platform that suits the needs of the tool. Criteria for the hosting environment include:
High likelihood of continued compatibility for the next decade
Ease of porting between multiple platforms, such as EC2, GCP, RHCloud, VCL, or even run as a program on desktop machine.
Free or low deployment and runtime cost, if only for educational environments
Enable the basic ability to turn a PDF’s comments into GitHub issues, as described above.
Furthermore, we request a variety of advanced features that the past tool also supported:
Archiving submitted PDFs into the reviews/ folder of the GitHub repository
Embedding of PDF snippets as images into issues, so that authors can see the context of the comment
Adding issue numbers into the PDF comments, and returning this modified PDF to the user
PDFs that are partially reviewed may be uploaded a second time once the reviews are complete, without overwriting old comments
Issue tags can be indicated in PDF comments using double square brackets (e.g. “[[must-fix]]”) and are automatically transferred to the associated issue. Shorthand is also supported (a “[[mf]]” comment tags the associated issue with “must-fix”, etc)
Workflow is very important- the process must be smooth and not be an added burden on the users (whether the writer or the reviewers)
Finally, more advanced features that the past tool did not support are also welcome. For instance:
Receive and process PDFs via email attachments, rather than a web interface
Archive submitted PDFs to any branch
Self-submitted reviews (as opposed to requesting a review from yourself, then uploading your own review)
Derived Personal Identity Verification (PIV) Authentication
The goal of this project is to determine the feasibility of using a mobile device as a PKI (Public Key Infrastructure) Smart Card replacement. Merck is looking into leveraging PKI certificates as a multi-factor solution to provide a high-level assurance of identity. This PKI authentication could potentially eliminate the need for a known password as a method of authentication. Eliminating dependency on password for authentication will help reduce the risk of credential harvesting based attacks.
Rather than leveraging Smart Cards, which would require new investments in hardware and are not the most user-friendly experience, can we leverage the proliferation of mobile devices to improve the overall experience? The solution should attempt to answer this question with consideration for the following high-level requirements:
Cloud PKI Vendor - To reduce the overhead and maintenance of the solution, we would like to work with a PKI as a service vendor who issues cloud based certificates as part of the solution.
Credential Store - The solution should leverage a credential store for identity lifecycle management. Active Directory is Merck’s solution for this but others can be utilized if needed.
Certificate Management/EMM - The solution should have a mechanism for managing the certificates on the mobile device. Merck’s Enterprise Solution for this is MobileIron, but an alternative Enterprise Mobility Management (EMM) solution can be leveraged if more convenient. (Note: If the Cloud PKI Vendor in #1 can deliver these certificates to the target mobile device without EMM, that is an option for this project in lieu of this requirement.)
Derived PKI Authentication - The working prototype should authenticate a user, without a password, while leveraging a certificate stored on an android or iPhone device, to a single target web application. Given that Merck is largely an iOS shop, iOS is preferred but not required.
Web Application – The web application is unspecified, but ideally will be related to some aspect of life sciences. This will not be developed by the project team, but more likely an open source application.
(Optional) Access Management Platform – If needed, an access management platform can be leveraged to simplify the ability of the web application to accept the authenticated user. PingAccess would be our preferred choice here, but we’re open to alternatives.
Internet Access – Accessing this application from the internet is not a requirement. Local network access is sufficient for proving the concept.
Software Licensing - If any licensing is required for selected technologies, Merck will acquire and distribute them where appropriate.
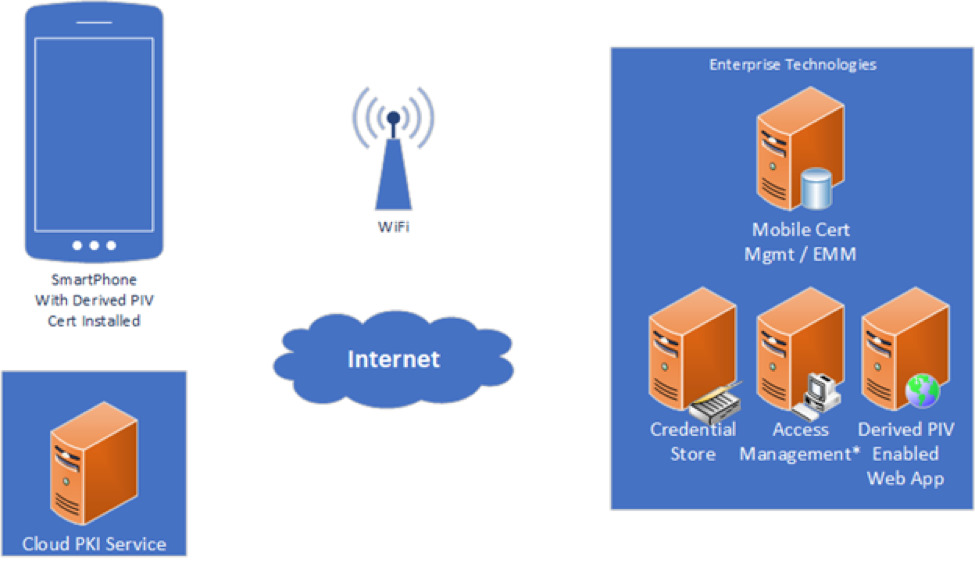
The concept architecture (Figure 1) is merely for illustration and should not be construed as an attempt at system design.
The emphasis for this project is proving whether NIST’s 1800-12 proposed standard (link below) for derived PIV authentication is viable outside of a Federal regulatory environment. Evaluation of requirements, and their relative priority, should be weighed against this principle constraint. Success in answering this question will be with a working demo utilizing the agreed technologies.
Resources
NIST SP 1800-12 Draft - https://nccoe.nist.gov/publication/1800-12/VolB/index.html
- Cloud Identity Summit Presentation from NCCOE on the NIST Project
Preferred Technologies / Frameworks / Languages
- Credential Store: Active Directory
- Certificate Management/EMM: MobileIron
- Mobile Device: iOS
- Access Management Platform: PingAccess
Third-Party Visualizations in SAS® Visual Analytics
SAS Visual Analytics allows users to quickly create reports or dashboards to explore, discover, or predict using their data. Users can choose from a variety of built-in objects to visualize and interact with their data. The data-driven content object enables users to display their data in a custom third-party visualization within the user’s SAS Visual Analytics report. The third-party visualization can be authored in any JavaScript charting framework, such as D3.js, Google Charts, or CanvasJS. This visualization in a data-driven content object receives its data query from SAS Visual Analytics, allowing it to interact with filters, ranks, and object actions in the same way as the other objects in the user’s report.
In addition to third-party charts, users can display any web content that is capable of being displayed in an iFrame.
The goal of this project is to improve usability and interactivity of SAS Visual Analytics reports by exploring third-party charting frameworks, abstracting common patterns of charting framework usage, and producing several interesting visualizations that interact with SAS Visual Analytics. There are a number of approaches to achieve this goal. First, many existing third-party visualizations have a very general purpose. In these cases, utilities can be written to make it easier for additional examples to be authored. For example, there are certain tasks or patterns of actions that may be similar when binding data to a Google Bar Chart versus a Google Pie Chart. The common tasks or patterns may be abstracted to help others create and interact with their own third-party visualizations. In addition, modifying third-party visualizations could make them more interesting for others who create and use the visualizations. Creativity and storytelling are encouraged. To this end students may bring data into SAS Visual Analytics and author very specific web content that captures the attention of the report consumer. The final examples should be well documented, and each should run well inside of SAS Visual Analytics. Where appropriate, the examples should also emit events to allow for full interactivity within SAS Visual Analytics.
The NCSU team will be provided with:
all of the interfaces and documentation necessary to implement a custom third-party visualization.
sample datasets to facilitate creation of visualizations
a link to SAS Visual Analytics, which is a web-based application. The application can then be used as a test-harness for the third-party visualization.
Bandwidth
The Problem
Imagine you bought a new TV and need to schedule the delivery. The delivery company calls you using a random number. You ignore the call because you don’t recognize the number, even though you want your TV ASAP. You listen to the voicemail, return the call, and wait for someone to help you schedule the delivery. Finally, the delivery is scheduled after you waste more of your precious time.
Today, businesses call people; they don’t text. However, customers text people and rarely answer calls from random phone numbers. In short, people and businesses who need to connect often don’t. This not only frustrates customers, but also costs businesses time and money as they miss deliveries, call multiple times, and disappoint their customers.
The Solution
Fortunately, Bandwidth’s APIs can help businesses and consumers solve this expensive, frustrating problem by combining voice and messaging services. For example, when a business needs to contact you, they can start with a text message explaining who they are, and asking if now is a good time to chat. When you respond, they can spin-up a phone call to coordinate the details.
This concept recently won “Best Business Value” during Bandwidth’s Disrupt 2017, an internal hackathon that generates ideas for real products and services. Your mission is to refine this valuable idea and bring it to life. This project may include some Natural Language Processing components, to interpret the customer’s text response and schedule a voice call at an appropriate time.
To do this, you’ll build a web service using Node.js running in Amazon Web Services’ Lambda serverless compute service. You’ll use Bandwidth’s APIs to send and receive text messages, and to spin-up a phone conversation when the recipient is available to chat. You’ll work closely with Bandwidth engineers, at our headquarters here on Centennial campus, to get a well-rounded professional development experience following industry-leading best practices.
About Bandwidth
At Bandwidth, we power voice, messaging, and 9-1-1 solutions that transform EVERY industry.
Since 1999 our belief in what should be has shaped our business. It’s the driving force behind our product roadmaps and every big idea. It’s a past and a future built on an unrelenting belief that there is a better way. No matter what kind of infrastructure you have (or don’t have) we’ve got your back with robust communications services, powered by the Bandwidth network.
We own the APIs… AND the network. Our nationwide all-IP voice network is custom-built to support the apps and experiences that make a real difference in the way we communicate every day. Your communications app is only as strong as the communications network that backs it, and with Bandwidth you have the control and scalability to ensure that your customers get exactly what they need, even as your business grows.
Insurance Financial Simulation
Objective
The insurance industry is complicated, with a large number of different types of actors, each functioning independently and pursuing their own interests. It’s like a big, Real-Time-Strategy game. This semester, we’re going to make it a playable game.

The BCBS Senior Design team will create a simulation of the insurance industry, the goal being to gamify the financial aspects of the industry, permitting the player to adjust different aspects of the simulation in pursuit of an optimal solution. The player will be able to initialize the simulation with different scenarios, based on input of historical data, and, as the simulation runs, the player will be able to view and adjust the simulation via charts, graphs and tables.
Goals
This project will let students apply their skills in programming languages, databases and user interface to build a highly visual simulation of a financial model. For the player, the goal will be to find the ideal values for parameters like member fee/cost per month (economic model) that minimize payment, while maximizing the health of the population, and retaining necessary medical talent (providers).
Solution
The team will use modern web tools / charts / controls to simulate health and financial transactions, summarizing the simulation in real time for the player. The player will be able to load datasets to observe historical trends over time and adjust trends / financial properties on the fly. In particular, the team will provide mechanisms for:
Importing potentially very large datasets into containers / databases that can be queried easily and quickly
Running a game loop to handle time and parameters that apply to the simulation
Exposing the state of the game loop via an API
Viewing and interacting with the simulation via a visual front end that shows financial and other parameters changing over time
Designing and implementing this financial simulation will require some domain knowledge. BCBS will work with the senior design team, to make sure they understand the relevant parts of the industry and to help them create appropriate computational models for the various types of actors being simulated. BCBS, will provide some initial datasets to get the team started. Based on this, the team will be able to generate data representing alternative, playable scenarios.
Sample Views
View claims over time
Blue Cross NC receives millions of medical claims every month. Chart views are great.
Viewing these over time would also be even better.
View provider information
In this sample chart we could potentially explore daily claims submitted or patients seen:
View overall company financial health
Adjustable prices and company metrics (the game part)
Adjustable parameters:
- Plans and payments for members (monthly premiums)
- Approval of claims (costs / adjudication rates)
- Operational costs
Game simulation parameters:
- Claims per patient / month
- Outcome of patient / claim
- Time to intervention. (causes more expense / lower health / lower satisfaction / raises # of claims)
- Change in membership (population shifts)
Views:
- View the cost drivers and how they are performing View an overall cost graph
- Sliders and buttons to adjust parameters
- Views for Patients/Providers/Payer Ability to PLAY / PAUS
Students will be required to sign over IP to Sponsor when team is formed.
Bot Spotter
Bronto Software offers a sophisticated marketing platform that sends billions of messages and tracks billions of events each month. We record events such as opens, clicks, page views, and purchases, and we analyze and report these data to our clients to give them a clear view of how their campaigns are performing.
Bronto’s clients all want to grow their list of marketing contacts. They typically do this through email signups on their websites - offering coupons or other promotions in exchange for email addresses. They are often reluctant to implement a CAPTCHA or a double opt-in, which leaves them vulnerable to various spam/DDoS attacks.
These attacks could target a particular store, loading up their email list with fake addresses that waste their money (they pay Bronto to send those emails) or honeypot addresses that earn them a blacklisting from spam cops like Spamhaus. Or, attacks might target a single person or list of people - signing them up for as many email subscriptions as possible so their inboxes receive a new email every second or two, becoming completely unusable.
We can’t save the entire internet, but we could provide some protection to our clients. Bronto has a substantial input stream which we could analyze in an attempt to identify fake signups or patterns that indicate the beginning of an attack. This stream includes email addresses and creation times, along with other types of associated data that may be useful as the team makes progress. For example: behavioral activity (opens, clicks, purchases), field data (names, birthdays), and maybe referring IP address.
There are several aspects of this project. We expect the senior design team will develop components in the following areas:
Old data
Write a recurring job that plows through our databases, looking for suspicious contacts.
New data
Write a stream processor that listens to contact activity in real(ish) time, running each one through or groups of them through some sort of prediction model (neural net, decision trees, something much simpler?) and scoring them by how likely they are to be bogus.
Evil
Write your own spam bot to test the ability of your model to identify these attacks.
Bronto projects give a teams a chance to learn and use lots of technologies, typically the same technologies we internally. Bronto will work with the team to identify the best technologies for this project. We expect you’ll get a chance to use some of the following:
- Implementation language
- Java
- Python
- Storage
- Redis (https://github.com/antirez/redis)
- MySQL
- HBase
- Analysis
- Neural-redis (https://github.com/antirez/neural-redis)
- Spark (https://spark.apache.org/)
This is an open-ended problem, with lots of opportunity for creativity in detecting sneaky things attackers may be up to. Here are some ideas to get you started:
A contact is subscribed to 17 different Bronto clients on the same day.
- This happened last fall. It was reported manually, otherwise we’d have no clue that this obvious bot attack had occurred.
Every day, a couple new (Top Level Domains) TLDs are added to Bronto that are 15 characters long, random, alphanumeric strings.
- This was found by me, the guy writing this project description, by just looking at the most recently written records in a DB table that stores all the unique TLDs that we’ve seen in email addresses (i.e., part of the address after the ‘@’). After 30 or so minutes of additional manual DB exploration I determined that a client had setup a test suite hitting our API 1 year ago when they were vetting us (before they bought our product). They never turned it off. It’s not malicious, it’s just wasting space. It would be a low priority to stop this, but it is the sort of thing I’d expect to be caught by the system you’re going to build.
In one day 50,000 contacts were added to a client’s account, all with 8 character long alphanumeric strings for both the left and right sides of the address.
- This also happened last fall. The client had an email signup form that gives you a coupon without verifying the email address in any way. It’s obvious that this would encourage people to submit fake addresses, but we’re not sure why a bot was deployed to abuse this form at a high rate.
Server Utilization & Workload Characterization via Nonintrusive Monitoring – Phase 2
Background
Durham Center of Excellence is the premier lab in Dell EMC. Over 40% of all equipment allocated to labs in Dell EMC is at the Durham Center of Excellence. Hundreds of thousands of servers, arrays, and networking switches are tested with millions of manual and automated tests by thousands of engineers every day.
The IEO Team is charged with Automation and Monitoring of this environment. We write automation software to monitor hardware configurations, software configurations and provision the same. Tracking this many devices, understanding the work loads, and projecting future requirements is a monumental task. Lab workloads do not conform to production norms, having much higher variability and lower predictability. In some cases, measurement can interfere with the intent of a test or the performance of a workload.
The focus of this project is to expand on the data analysis of the already developed Docker-based micro-service that collects a multidimensional description of server workloads and usage interfering as little as possible with the actual workload.
Project Scope
The project being proposed consists of two phases:
Write software to analyze the output from the micro-service monitoring application developed in a previous project and develop a signature/fingerprint for various types of workloads that run in the Durham lab.
Develop a utilization dashboard that will provide information on how a server is utilized over a period of time and upload that information to ServiceNow.
Phase One
The analysis software should
Analyze across a dataset to determine server utilization metrics.
Develop fingerprints for various types of workloads
Determine the minimal data set required to develop a workload signature.
Application can be written in Python, Java, Java-script, or Ruby.
Application should run in a Docker Container
Data can include but not be limited to Disk IO, NIC IO, HBA IO, CPU Utilization, Memory Utilization, login access, NIC/HBA Power, Fan Power, CPU Power, Memory Power, Motherboard Power,PCI Slot Power, PSU Efficiency Loss, Disk Power, OS Power settings, BIOS Power Settings, Others as suggested by the team, HW and SW configurations
Workloads can include but not be limited to: NAS Functional Test, Block Functional Test, Unit Test, NAS Performance, Benchmarks for NAS, CPU, Memory, Block IO, Network IO
Phase Two
Phase 2 is an open-ended evaluation and analysis phase using the micro-service to develop a server utilization dashboard.
Upload server utilization metrics to ServiceNow.
Extend the examination to different OS’s
Extend the examination to different models of servers.
Extend the application to retry requests denied due to lack of connectivity etc…
Extend the examination to different workloads
Others as suggested by the team or by their analysis.
Materials Provided
Cisco Server
Access to a test ServiceNow Instance
Possibly another newer Dell server that has more relevant sensor data
Benefits to Senior Design and Dell EMC
This project provides an opportunity to attack a real life problem covering the full engineering spectrum from requirements gathering through research, design and implementation and finally usage and analysis. This project will provide opportunities for creativity and innovation. EMC will work with the team closely to provide guidance and give customer feedback as necessary to maintain project scope and size. The project will give team members an exposure to commercial software development on state-of-the-art industry backup systems.
For Dell EMC, the application will act as a prototype for the analysis of server workload. The ability analyze input data and determine what types of workloads will be invaluable to Dell EMC in understanding their current efficiency and utilization and project future requirements.
Dell EMC
Dell EMC Corporation is the world’s leading developer and provider of information infrastructure technology and solutions. We help organizations of every size around the world keep their most essential digital information protected, secure, and continuously available.
We help enterprises of all sizes manage their growing volumes of information – from creation to disposal – according to its changing value to the business through big data analysis tools, information lifecycle management (ILM) strategies, and data protection solutions. We combine our best-of-breed platforms, software, and services into high-value, low-risk information infrastructure solutions that help organizations maximize the value of their information assets, improve service levels, lower costs, react quickly to change, achieve compliance with regulations, protect information from loss and unauthorized access, and manage, analyze, and automate more of their overall infrastructure. These solutions integrate networked storage technologies, storage systems, analytics engines, software, and services.
Dell EMC’s mission is to help organizations of all sizes get the most value from their information and their relationships with our company.
Virtual Headbands (Service Project)
Company Overview
Headbands of Hope was started by an NC State student, Jess Ekstrom. In 2012, during a summer internship at Make-A-Wish, Jess noticed that kids loved to wear headbands after losing their hair to chemotherapy. At Headbands of Hope, for every headband sold, one is donated to a child with cancer.
Problem
Sales are primarily online, at headbandsofhope.com. Sometimes, customers hesitate to purchase if they’re not sure how the headband will look when they’re wearing it. Similarly, patients in the hospitals, who have just lost their hair, would like to know what headbands would look good on their head.
Solution
The Headbands of Hope Senior Design team will develop a web application that lets customers try on headbands virtually, using the selfie camera on their phone or the front-facing camera on a laptop. We imagine this application will be similar to a snapchat filter, except with our headband products. When the project is complete, customers and patients will be able to access a virtual headband ‘closet’ from the Headbands Of Hope website.
This project will include a customer interface, for trying on and comparing headbands virtually, as well as an administrative interface, for adding and removing available headbands and managing other resources as needed.
As a stretch goal, we invite the team to explore and prototype more creative ways to try out a virtual headband, like a 3D virtual headband interface created from the user’s 2D image.
Automated Engagement Accelerator
iCiDIGITAL provides an extensive array of software development and services around the Adobe Marketing Cloud platform to customers that run their internal and external websites on this platform. Each customer engagement consists of several elements which are repeated to get the project started. These areas of repetition can cause scheduling delays and have a significant cost associated with them as we continue to bring on more customers. In addition, the manual nature of how these projects are set up allow for inconsistencies to emerge across projects. The purpose of this project is to identify areas of repetition and redundancy in our initial customer project setup and automate them.
Areas for Automation
The following areas have been identified as needing automation
- Creation of new code repo from a base code source
- Creation of new JIRA project to track work
- Creation of new Confluence (Wiki) space for documentation
- Setup of developer’s local AEM environment
- Base content repository
- Base set of configurations
- Inclusion in environment of code, content, and configurations
Suggested Technologies
The list below is not an exhaustive list and we are flexible on using alternate technologies to achieve the desired solution.
Java, Docker, Puppet, Python, Git, JIRA, Confluence, AEM, HTML, CSS, Javascript, REST, Gradle, Maven, AWS
Project Solution
The team will be highly engaged with stakeholders at iCiDIGITAL to help develop a project plan and use agile methodologies to prioritize the work and iterate through deliverables. We will help define a Minimal Viable Product (MVP) and work towards those goals as the agreed upon deliverables.
The solution will have two areas of focus. One area will to be focused on the needs of a project team around the automation of project infrastructure and project tools setup and configuration. The second area will be focused on the needs of the individual contributors helping to automate their local environment setup using the project infrastructure and tools setup provided in area focus number one.
TUNINGWOLF
The Laboratory for Analytic Sciences (LAS) was founded in 2013 by the National Security Agency to be a translational research laboratory in support of the Department of Defense and the Intelligence Community. We are a unique organization that works at the intersection of mission and technology to develop techniques that help intelligence analysts better perform complex, integrated analysis. Our work covers the spectrum from basic science to applied solutions. The OSCAR lab is our computer lab hosted here at the NC State.
Project Description
Hadoop is the de facto open source big data platform that is used by commercial firms worldwide to host data and run analytic processes. A typical use case for Hadoop is that log data is delivered to the Hadoop file system, and map/reduce or Spark jobs are run against this data to create new databases that are used in meaningful ways for the customers of the firm or for the firm to better understand business processes.
A specific example might be that customer purchases are noted in the log data, and a hadoop process is applied to these logs to create a database of groups of items that are frequently purchased together. This new database can then be used by the firm to recommend to customers additional relevant purchases for their shopping experience.
In many cases the same production processes are run over and over again on new log data that arrives at the system continuously. These processes have sets of Hadoop configuration parameters that govern their execution at a system level in hadoop. These parameters are often set by “rules of thumb” or defaults, instead of based on empirical judgement based on past usage. TUNINGWOLF will be a system that iteratively changes the configuration parameters of jobs to find more optimal settings for the system as a whole to increase the overall throughput of analytics that are run on the system.
Project Details
Students will use the LAS’s OSCAR Lab Hadoop instance to test and evaluate the TUNINGWOLF system, and, if time and resources allow, they will retest the system on Amazon Web Services. Students will run their experiments using pig scripts that run against the PigMix benchmark suite and a set of pig scripts that process data from the Freebase knowledge graph project. Students will create a simple job management system that controls the configuration of the pig jobs and submits them to the system several times per day. The total processing time of each job will be measured and an optimization process will be applied to select new configuration parameters for the next run of each of the jobs. Over time, the system will converge on an optimal set of parameters for all of the jobs that minimize the cluster time that the jobs use.
Although this is not an exhaustive list of parameters that can be optimized, important ones to consider are mapreduce.map.memory.mb, mapreduce.reduce.memory.mb, mapreduce.task.io.sort.mb, and the total number of reducers for each job. The time of day that jobs are submitted will also be a part of the configuration that is optimized. Students will run tests and document the performance gains of the system. A similar hadoop optimization approach is outlined in the reference document, but doesn’t use repeated runs of the same jobs to inform the optimization of parameters.
References: http://www.cs.duke.edu/starfish/
Texting Solution for IVR/OMS software
An integration with Twilio to provide texting from Milsoft’s current texting API
Milsoft provides an Interactive Voice Response (IVR) and an Outage Management System (OMS) application to our current utility customers. These products allow utilities to communicate power outages with their customers, based on predictions from the OMS application or when a customer calls in to report an outage. Milsoft’s software can track and return phone calls when certain criteria has been met (e.g., power has been restored, or crew has been dispatched).
We would like to add the ability to send and receive text messages using Twilio to communicate with end users, along with a web-based portal to track each utility’s usage, for accounting and billing purposes. At present, Milsoft provides this service through a texting API offered by a third-party vendor, but our current solution creates some unnecessary complexity for our customers.
Project Description
This project has two major components. The Milsoft texting service will be a RESTful Windows service that receives web calls from our current texting API and translates it to Twilio’s API. The design should be extendable to permit targeting other texting services such as Plivo or Amazon Connect. The second component, the Report service, will be a Windows service that has a web UI that Milsoft’s accounting and billing can use for customer billing and usage stats.
Milsoft will provide a Milsoft test system and an API documentation of our current system. The team will need to consider the following requirements and constraints as they design and implement these services.
The texting service will use Twilio’s opt-out protection to comply with FCC regulations
The texting service will support the use of Twilio’s sub-accounts
The reporting service will be hosted at Milsoft, but it will request usage data from Twilio per customer.
The reporting service will permit Milsoft accounting to:
Generate a report of number of texts in a billing cycle, phone number, date, time, etc. It should also be able to pull a range of dates (xls format is fine)
Set resale rate per customer and have that info stored so a bill can be created for each individual customer.
Services will integrate with Milsoft’s Service Manager via AMQP and provide an HTML 5 Web UI for configuration and information
Technology
This project will be implemented as standalone Windows services and will provide a Restful API to work with Milsoft’s current texting API. We employ a number of Microsoft and other technologies in our software, and we expect this project will give the team a chance to work with many of the following:
- Developed using C# (preferably) or Java
- HTML 5 web UI using Angular, Typescript, and Bootstrap
- SQL Server Express
Milsoft will work with the senior design team to select technologies for this project. This may include third-party components, provided their licensing doesn’t restrict usage of the project.
Students will be required to sign over IP to Sponsor when team is formed.
About Milsoft
Founded in 1989, Milsoft is based in Texas and serves over 1000 utility customers with software applications centered around managing and operating electrical power networks. The primary market focus for Milsoft is the small utility market and Milsoft software will be found in most Cooperative and Municipal systems in North Carolina. Milsoft has four main product lines. Milsoft Engineering Analysis applications allow power engineers to evaluate system loading, forecast, and plan for network changes. Outage Management tracks the real time network conditions with inputs from utility customers, power meters, and other utility control systems allowing the utility to operate their crews and restore power outages as quickly as possible. Our GIS system utilizes ESRI software to map and track utility assets in a connectivity network. Milsoft Communications software has several components including automated call handling. This system allows utility customers to report outages, pay bills, and other customer service functions over the phone or via text message.
Smart Q&A
Background
Strategic Motion Video (SMV) is an upcoming online, pre-recorded video based learning platform, primarily focused on corporate training. One of the most innovative features of SMV is that, unlike traditional e-learning technologies, it allows learners to interrupt the prerecorded video instructor at any point during a lecture, ask a lecture related text-based question, receive an appropriate pre-recorded response, then resume the lecture at the point of interruption. Responses to all anticipated questions are recorded in advance as the course’s content is prepared, and the scripts (text) of these responses are stored and used to identify candidate answers to questions.
For the purpose of this project you will deal with text-based questions (typed in by a learner) and a predetermined set of (all possible?) text-based answers relevant to lecture content. No videos need to be involved.
Problem
In the existing prototype version of SMV, keywords in questions submitted by learners are matched against keywords in a set of predetermined answers to return a relevant response. To do this, we currently use MySQL’s built-in functionality for natural language full-text search. This keyword-based approach is rudimentary and many times yields responses that, while related, do not address the asked question. For example, if a learner asks “How often should I get a flu shot?“, they may get an appropriate answer, but if they ask “How often should I get the flu vaccine?” they may get a response to a keyword-related, but different possible question, e.g., “What is a vaccine?”.
Solution
In this research project, we would like your help to explore natural language processing (NLP) and techniques from the field of artificial Intelligence (AI) that could be used to improve the interactive SMV Q&A functionality.
We would like to find out not only what the most relevant answer (from the prerecorded set of possible answers) is to a learner question, but also determine if none of the available answers is an appropriate answer to the question that was asked.
The results of this research will influence future development of SMV, but integration of your research results with SMV is not a goal for this semester. We are primarily looking to find an appropriate answer from a series of prerecorded candidate responses, and not to generate a response using natural language generation (NLG).
Some of the research questions we would like to answer are:
What NLP techniques can be used to accurately match an arbitrary question to the most appropriate pre-recorded answer to the question?
What NLP techniques can be used to accurately determine if none of the available responses adequately answer a lecture based question?
What is the best way to structure pre-recorded answers to provide as input to these NLP algorithms? We currently store responses in a MySQL database, but perhaps NLP would benefit from having these responses in a text file (CSV, JSON, etc.) or a pre-processed binary representation.
An important goal is to develop a solution that produces near-real-time responses. Since we are applying these techniques to an interactive system, returning responses in 1 or 2 seconds would be fine, but waiting a minute will not work.
To demonstrate your research findings, we would like you to implement a simple Web-based Q&A system that supports at least two separate subject matters. The UI can be as simple as a Web form that, after selecting the desired subject matter, submits a text-based question and displays the returned answer (or message saying that no answer was available).
The submitted question should be received by a PHP back-end, but you are free to use other technologies after that. For example, you may call a Python/NodeJS/Java/R script from the PHP back-end to do the actual NLP, or you may provide the NLP as a service (REST, JSON RPC, etc.). A pure PHP implementation is also valid. You are free to leverage any existing NLP libraries, as long as they are open source and free for commercial use.
To help you get started, we will give you a series of prerecorded answers relevant to a given subject matter. However, you are encouraged to experiment with many different types of content by generating your own prerecorded answers relevant to one or more subjects of your choosing.
As a stretch goal and if time permits, we would also like for you to explore NLP techniques to look at a subject matter for a course (text content) and come up with possible questions that learners may have. This may involve things like determining what content is not delivered clearly, finding content that is ambiguous, terminology that may need to be defined more precisely, and/or language that can be confusing. This will allow SMV to anticipate questions and to generate prerecorded answers when a course’s content is created.
Students will be required to sign over IP to Sponsor when team is formed.
Education Gamification App (Service Project)
Voyager Academy is a K12 charter school based in Durham County, with a Project-Based Learning (PBL) model of educational delivery. Students are engaged in curriculum through intensive, interdisciplinary projects that seek to incorporate multiple styles of learning, to find real solutions to real-world problems.
This specific project came about as the result of one teacher’s Kenan Fellows Project, in partnership with Cotton, Inc. (Cary, NC).
Gamification is an educational approach to teaching, engaging students with both extrinsic and intrinsic motivating factors, utilizing basic gaming elements to enhance and capture student learning.
At Voyager, we currently gamify some lessons through use of Google Spreadsheets, with each student receiving their own “gameboard”, where they earn badges for completing certain objectives. Students are given points for accomplishing specific objectives that they self-record.
An example of this spreadsheet can be seen here.
Voyager is looking for a new solution to make creation and grading of exercises easier for teachers as well as to avoid students cheating the system.
Solution Description
We would like to see the creation of a web application for gameplay and delivery. A rough attempt at exploring the solution is below:
The application will allow students and teachers to log in using their Gmail accounts.
School Administrators will be able to enable teachers to use the application, or alternatively if all teacher accounts can be determined programmatically upon login, teachers could immediately be allowed access
Teachers will be able to create classes and add student google accounts to their classes (by username), or this information will come from the Google Classroom system
Teachers will be able to build multiple exercises like the spreadsheet above
Teachers will be able to assign exercises to a class, allowing students to view and complete them
While editing exercises, teachers can assign badges. Badges are images that the teacher can upload, possibly selecting from a set of already uploaded badges. These badges will show up on the student pages.
Students will be able to check off what steps they have completed
A teacher will be able to approve what steps each student has completed successfully
Teachers will be able to browse the submissions from all students as well as a summary of the “score” and number of tasks completed for each student.
Students will be able to browse past assignments to review how they performed
Students will be able to see their scores and number of badges (out of the total) for each assignment in a summary view. This might also show the total number of badges and points the student has earned for all assignments (?).
The collective scores for an exercise will be downloadable in CSV format
Teachers may need to be able to remove students from a class list
Teachers may need to be able to remove classes or delete assignments
Teachers may establish the amount of points required for “leveling up”
Teachers may also want to see the number of total points all students have earned out of all assignments (?)
Additional constraints
The application must be easy to deploy and maintain, as subject to a discussion with school IT staff.
The application must be extremely secure with all endpoints protected by the correct authentication and authorization policies, exposing no student data to unauthenticated users or users outside of the class, and not providing student scores to other students. No personal student data should be exposed or copied.
The front-end and backend should be loosely coupled using a well defined REST API, with all authorization happening through the back end.
The application shall have sufficiently commented code and have an easy to maintain architecture.
Stretch goals:
- Multi-tenancy. The design for the application above solves the need for one school, but the application could be run in such a way that it could be used by multiple schools. Support the concept of multiple schools and multiple school administrators, and the necessary changes in access control to support this.
Technology
Students are free to choose their preferred backend programming language on this project, provided it is reasonably commonly used and not Fortran or Intercal.
Use of a modern javascript framework on the front end is strongly suggested.
Use of a framework that easily supports building into a future mobile application should be considered.
Because this project will likely have evolving data schemas, use of a SQL database is required.
All front-end and back-end communication must happen through a strongly authenticated and authorized, discoverable, REST API. All REST routes/methods shall have tests for all supported HTTP verbs, and tests for legal access by student or teacher, and tests to make sure unauthorized users are denied.
As deployment technology may need to be flexible, the application must not require the use of any specific cloud service (such as AWS, GCE, Azure, etc). Though as IT conversations continue, deployment automation/instructions for testing on one example cloud service may become part of the project.
Project Archives
| 2026 | Spring | Fall | |
| 2025 | Spring | Fall | |
| 2024 | Spring | Fall | |
| 2023 | Spring | Fall | |
| 2022 | Spring | Fall | |
| 2021 | Spring | Fall | |
| 2020 | Spring | Fall | |
| 2019 | Spring | Fall | |
| 2018 | Spring | Fall | |
| 2017 | Spring | Fall | |
| 2016 | Spring | Fall | |
| 2015 | Spring | Fall | |
| 2014 | Spring | Fall | |
| 2013 | Spring | Fall | |
| 2012 | Spring | Fall | |
| 2011 | Spring | Fall | |
| 2010 | Spring | Fall | |
| 2009 | Spring | Fall | |
| 2008 | Spring | Fall | |
| 2007 | Spring | Fall | Summer |
| 2006 | Spring | Fall | |
| 2005 | Spring | Fall | |
| 2004 | Spring | Fall | Summer |
| 2003 | Spring | Fall | |
| 2002 | Spring | Fall | |
| 2001 | Spring | Fall |