Projects – Fall 2020
Click on a project to read its description.
About BCBSNC
Blue Cross is committed to being a leader in the transformation of healthcare, and seeks to use advanced technology and analytics to better serve the needs of our members and the medical providers who care for them.
Problem
Blockchain is a hot buzz word in the Healthcare IT space. How to properly leverage and what can actually be done with this technology is not clearly understood by most in BCBSNC IT. Creating the knowledge of when to choose a blockchain solution and evaluating the costs vs alternative technologies will be an important challenge for our IT leaders very soon. This project is meant to educate and help properly assess this technology at BCBSNC.
Project
In order to accomplish the education goal, students will build a single blockchain based application named Blockchat to instruct and teach others about private secure blockchain concepts. While the focus should be on business transactions outside of cryptocurrency, key concepts using content provided by BCBSNC will convey: when is a blockchain-based solution appropriate / inappropriate, differentiation of various types of blockchain, and proper application of a private blockchain infrastructure to create a tangible application. The students are not expected to explain blockchain, but they are expected to provide a working teachable application to demonstrate the learnings gathered by BCBSNC on the topic. Students need not be experts in Blockchain, and a fully functional Hyperledger Fabric blockchain network will be provided by BCBSNC with students creating surrounding REST API access to the network.
Students should expect that transactions can be in the realm of business documents (preferably with a Healthcare focus) such as Prior Authorization request, Claim requests, Billing statements, Explanation of Benefits, etc. in which one party needs to interact with another party. Payment for services rendered could be handled via cryptocurrency, but the goal is to demonstrate other transactions possible. Students can help design transactions that would be used in the project and write Smart Contract chain code to implement the solution.
Students will build a blockchain application in AWS that leverages desktop or web-based app using Node.js with JavaScript talking to a backend service they develop which talks directly to a Hyperledger Fabric blockchain network (the network already exists). Students will design a standard SQL database for storing content as well as design blockchain smart contracts for the blockchain database. In terms of data storage, blockchain can be slow transitionally and may require multiple party consensus for transactions. It will be important to have a SQL database for work in progress data before storing on the chain, internal data state that doesn’t belong in a blockchain ledger, and possibly used for analyzing data retrieved from a ledger.
The Blockchat application is intended to be similar to a Slack chatting interface. Each user who can chat on blockchain will be an enrolled member of the network with issued credentials from Hyperledger Fabric. The application will need to provide a chat “room” that corresponds to a private “channel” in Fabric. Each “channel” will allow various types of content based on Smart Contract Chaincode API work built by students. The ability to have chat bot-like functionality or automated room moderation that utilizes Chaincode is desired. Finally, each room will display or link out to the user some explanatory content that helps the user visualize how their interactions with the chat application leverage the Blockchain.
Blockchat would allow end users in a user-friendly interface to discover how small transactions impact data interoperability versus the use of batches when sharing content with multiple parties. Chain code can be built to improve transaction speeds and allow for automated validation or rejection of content much like an automated bot in a chat room might filter for unacceptable language. Students will have the option to utilize AWS Lex-based chatbot into the application to build “bots” that would handle reading / writing data to the blockchain chaincode, or designing and building the “bots” in some other way.
BCBSNC will provide a virtualized development environment that provides all tools necessary to work on this application. Students will just need a computer with the ability to access Internet that has sufficient capability to support virtual meeting software or remote desktop technology. Technology to be used will include Hyperledger Fabric, Docker, Kubernetes, Node.js, MySQL or PostgreSQL, Express.js, REST based API back-end, and a react JavaScript front end.
The Assignment
We, as a bank, are often on conference calls with corporate clients (e.g. Tesla) to discuss aspects such as launching an IPO or providing a Corporate Loan or issuing additional shares et al. A lot of meetings take place that span a number of months and undergo a lot of negotiations from both ends.
Hence we are looking for a tool that can help quickly parse large numbers of meeting minutes/notes generated from those meetings. Ideally, we’d like a technology tool that can leverage text analytics/NLP to drive actionable insights from these conversations. The tool will help the bank with decision making by:
- quickly parsing a number of meeting minutes (text)
- and providing a sentiments view
e.g. After parsing twenty meeting notes for a corporate client (say Tesla) the tool ‘suggests’ that the ‘sentiment’ is on the ‘negative’ side.
Deploying such a quick parsing and analyzing tool, the bank’s management can then decide on the further course of action i.e., whether to further incentivize the offer or to put a stop to the negotiations (and shift the time & resources towards other clients).
To summarize: Our project’s core requirements are:
- An NLP engine which parses a provided ‘text-based’ files for sentiment analysis. Please see Objective B below for additional details.
- A webcrawler that procures publicly available information from webpages/news items for that corporate entity (e.g., Tesla). Please see Objective B below for additional details.
- And an interface (chatbot) that essentially ties the above two together and automates these two actions. Please see Objective C below for additional details.
Objective A: Sentiment Analysis via parsing conversation-like text data with a client
What is the opinion/emotion?
- Who/What are the entities mentioned?
- What is the subject?
Please review following high level specifications and requirements. The below will be refined in greater detail during scoping with the team.
- Data: Need to be text data, preferably conversation-like text data between two parties. However open to other text data format as well.
- Tooling: any open source tooling will be accepted, preferably Python for NLP portion
Objective B: Establish Risk Profile of the client
Compile a profile of the client by collecting news items related to the client over the prior 90 days (by web crawling).
Objective C: User Friendly automated interface
Using open source available tools/libraries a chat bot could be deployed to facilitate achieving above stated Objective A and Objective B.
The Fall 2020 Semester
Students will use their course knowledge, creativity, and technical expertise to delve deep into the exciting world of NLP and text analytics to help build the management-level BI dashboard described above. DBGT will provide leadership, direction, guidelines, technical expertise (as needed) and support in refining the project scope. The DBGT team is here to aid and guide the student workflow, processes, and design ideas. We support and encourage the students’ input on this project.
The NCSU Student Experience
Senior Design students in the College of Engineering Department of Computer Science will have a unique opportunity to partner together over the course of the semester to explore the exciting and developing field of NLP/Text Analytics with direct application to a real business problem. Additionally, students will have access to industry professionals to assist in the software design, agile practices, and the overall code development and testing. Students will be allowed to share the final product as part of their own portfolio while job seeking.
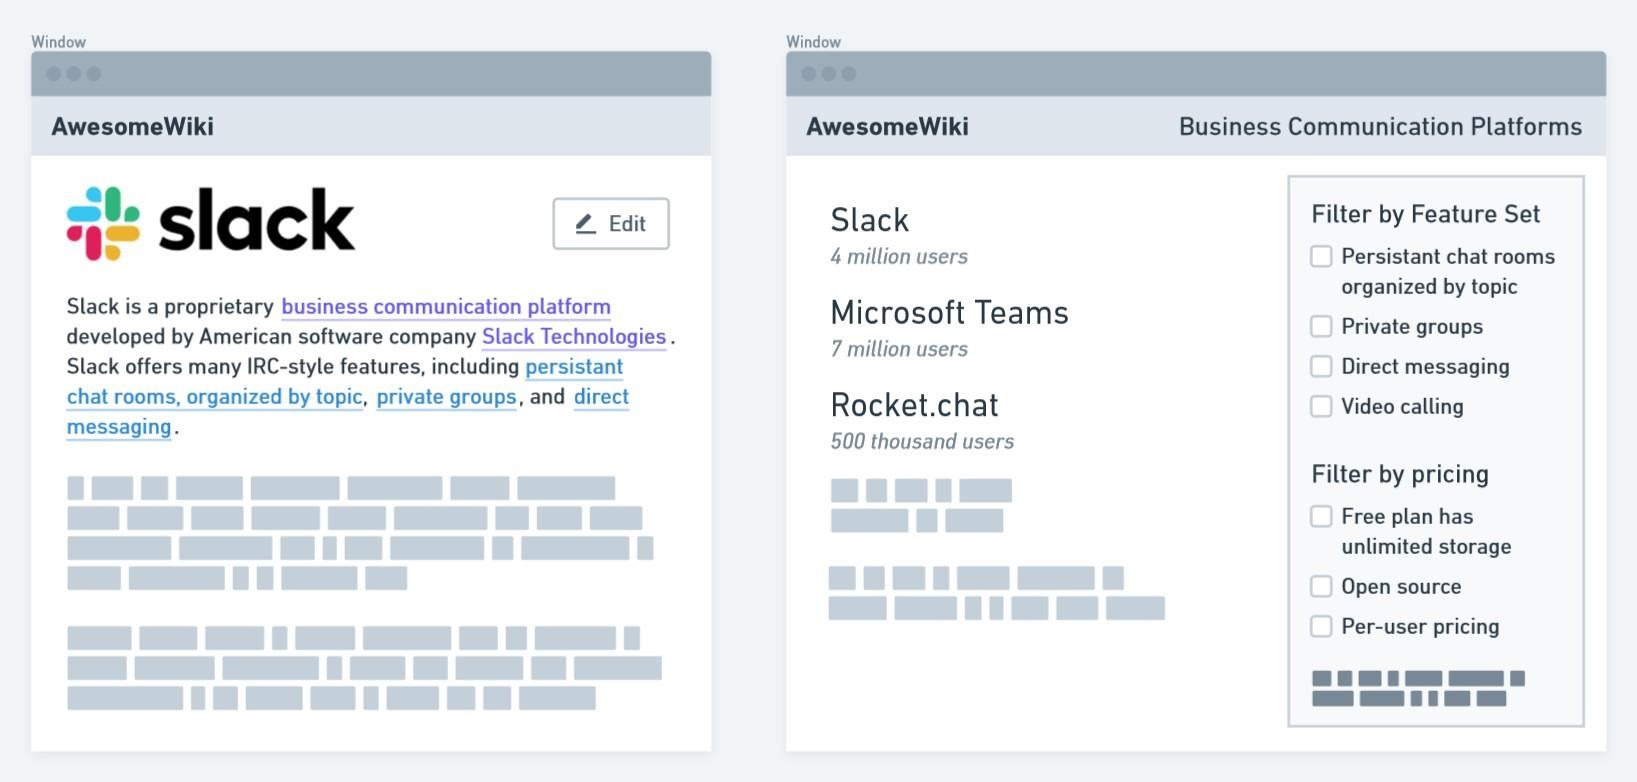
AwesomeWiki is a new type of search engine that helps you find comprehensive answers to the questions you're asking.
Background
Existing search engines index the entire internet, and provide results for arbitrary search terms. This is good for some things. Try searching for "Slack", and Google will provide a link to different pages on Slack's website, as well as background information about the company.
What if you wanted to find other messaging platforms you could use? What do you search for? "Instant messaging platforms?" What about "alternatives to slack?" These answers are imperfect. They tend to surface marketing articles like "11 best Slack alternatives in 2020" that highlight the players that can pay the most for advertising, rather than listing every alternative.

Problem
Search engines can't answer questions comprehensively. Getting a list of every project that's related to a different project is impossible.
Solution — AwesomeWiki
AwesomeWiki parses and classifies websites, products, and projects into discrete categories, via a structured database. It then enables individuals to contribute and improve that database, like Wikipedia.
AwesomeWiki was inspired by "awesome lists", which are lists of resources available for developers clustered around a certain area. Awesome lists exist for
Java, Python, and every other programming language and platform you can think of. Each list contains subcategories. In the programming language example, those could be: libraries, code coverage tools, GUI tools, database tools, etc.
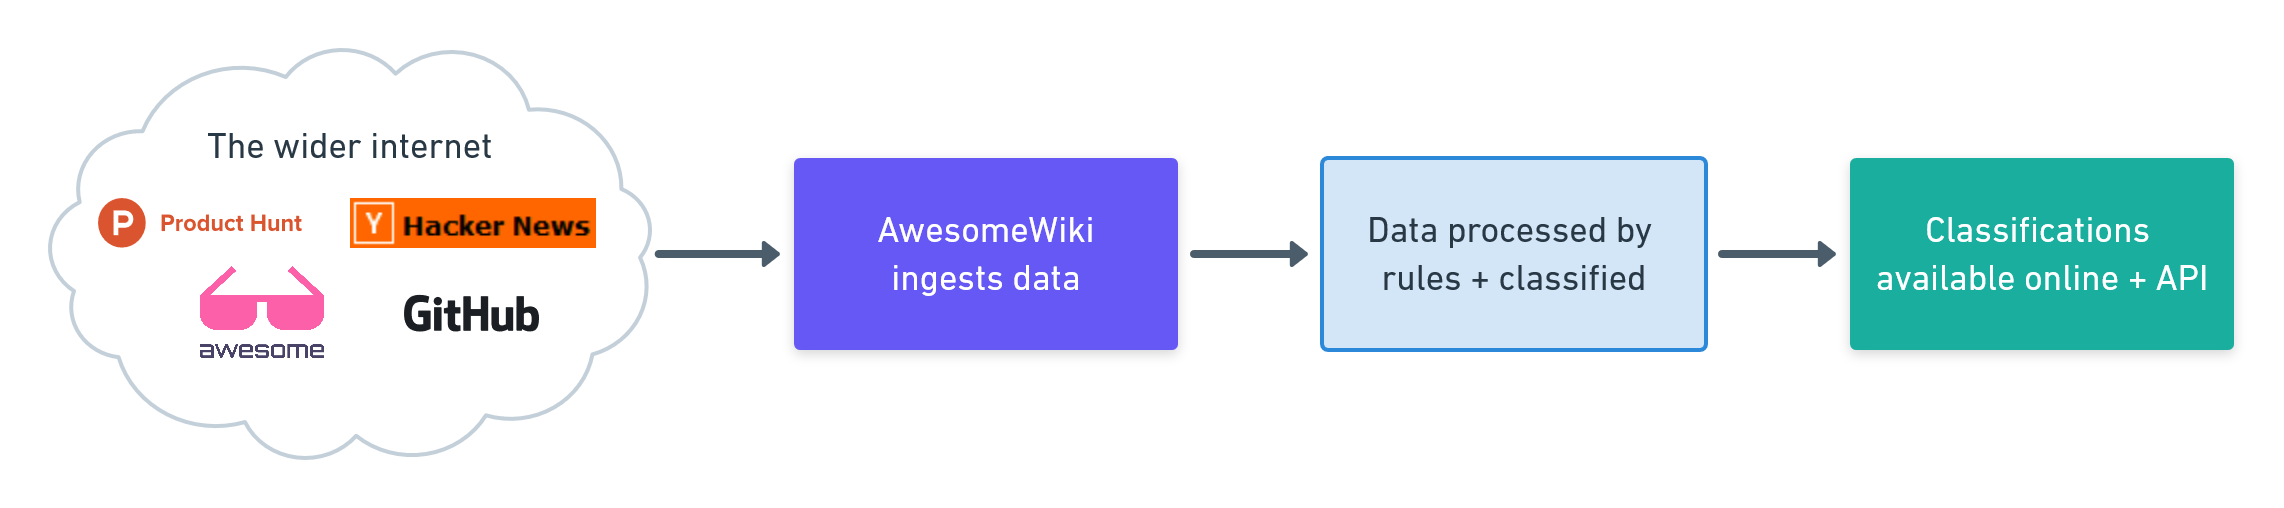
Product Design
We ingest data from multiple sources, and process it according to some simple rules.
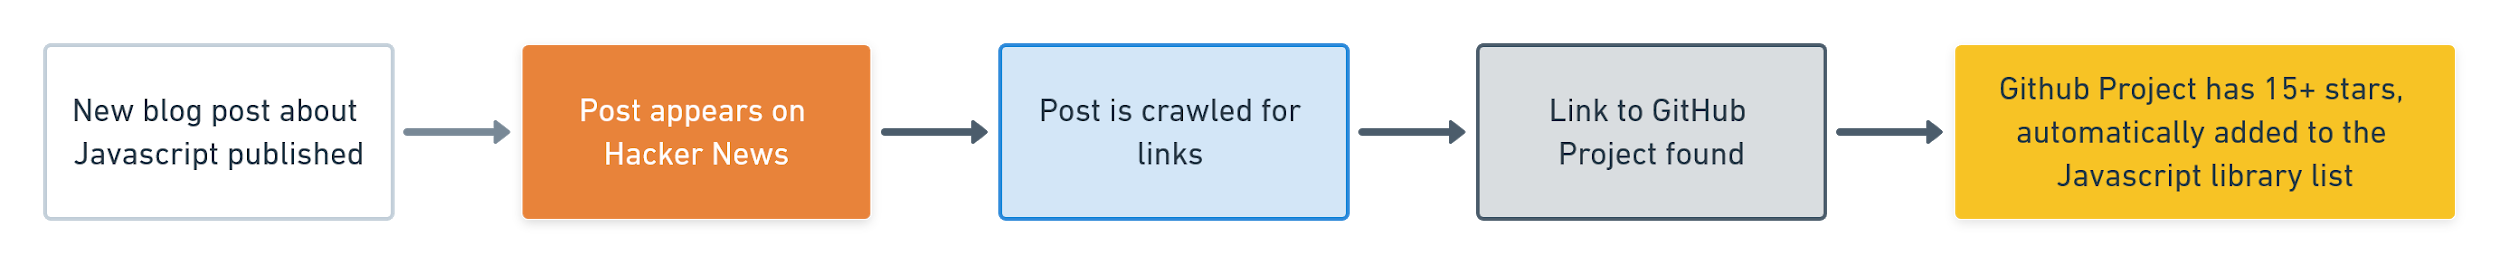
These rules are open source and community-edited, so anyone can help improve the algorithm. Rules also apply across existing projects. Someone writing the rule below can run it against the existing database, populating thousands of new connections instantly:
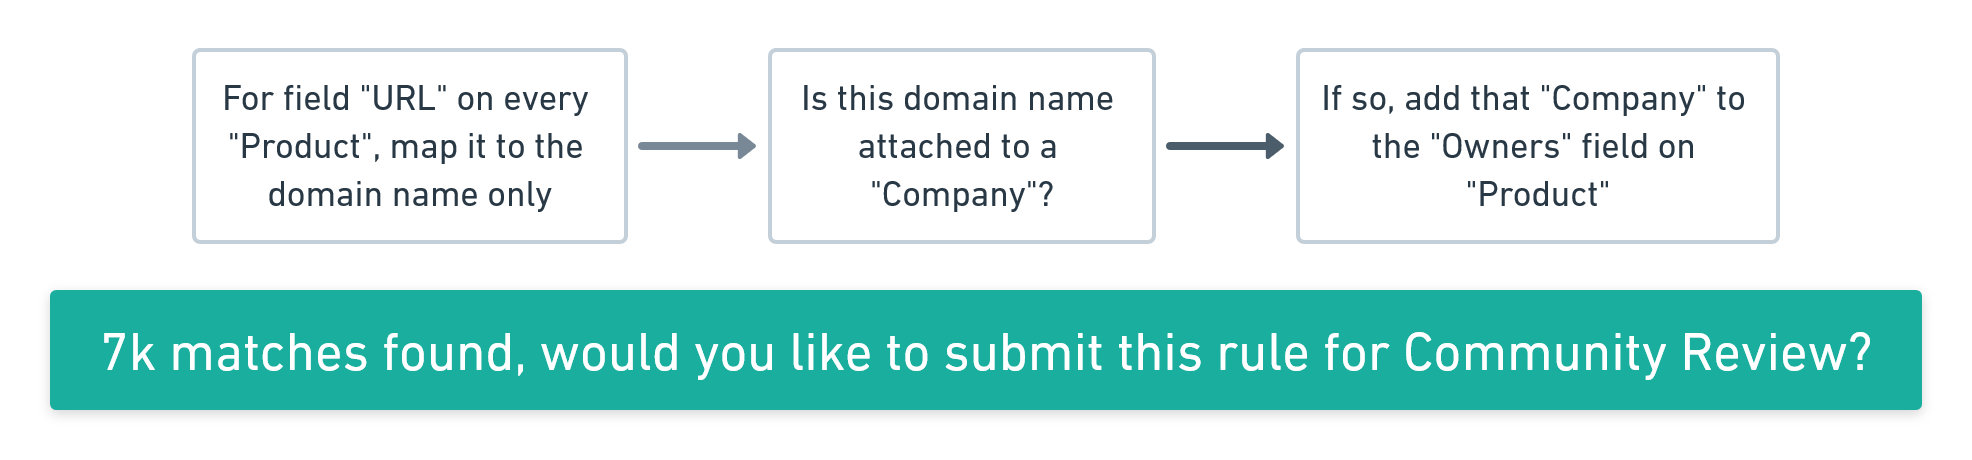
Our eventual vision is to create a publicly explorable database that contains linked references between software projects, websites, companies, and resources. It could look something like this:
Competitors + Differentiators
Obviously AwesomeWiki would be competing against the existing Awesome List ecosystem, but there are other companies & websites trying to solve similar problems. Some include:
- AlternativeTo - A website that tracks software alternatives
- Capterra - A company that collects reviews of popular software products
- Product Hunt - Companies post new products, consumers find new products
AwesomeWiki is different from these tools in that we're betting on a data-first strategy. Each of these platforms (and more) can act as data sources for our project... Instead of relying on individuals to manually upload data, we start with data automatically collected from multiple sources, and then enable manual annotation of the data, providing a richer and more complete database.
About Merck
Merck's Vision is to discover, develop and provide innovative products and services that save and improve lives around the world. Merck's IT cyber organization is charged with protecting Merck's resources, processes, and patients by ensuring our technology is protected from unauthorized outside entities.
Background and Problem Statement
As Human decision-maker bandwidth is quickly becoming the bottleneck as we dutifully insist on interpreting, drilling down, and verifying the details behind big data visualizations and abstractions, information fusion becomes a critical need for current cyber security fusion centers of today and the near future. There is a need to address this by developing systems that facilitate extraction of relevant and “fused” situational awareness of cyber and kinetics events in one portal for the consumption of decision makers.
Project Description
The project is divided into two deliverables: 1) a proposed cyber security executive “key security indicators” dashboard that will be used to highlight cyber security risks for executive awareness. 2) Take a number of ITRMS Splunk dashboards and propose new visuals that will communicate effectively the latest status of the intended security postures. The successful dashboards will take data from Splunk and create new visuals.
The objective of the project is to produce a minimum viable product with updated functionality that we can scale. We are proposing that the project focuses on additional functionalities that are defined as follows:
- Research any technology or vendor that has those functionalities and provide a report
- Use JIRA in an agile fashion to document and follow on user stories
- Use technology framework like REACT/D3 to develop the proposed visualization by extracting data from splunk
- Present working prototypes for the selected dashboards.
The results of the project will be a “seed” to what can be used as an executive dashboard
Technologies & Other Constraints
HTML/JS/CSS, Python, JIRA, REACT, D3Splunk but open to see what else may work on the platform
About Siemens Healthineers
Siemens Healthineers develops innovations that support better patient outcomes with greater efficiencies, giving providers the confidence they need to meet the clinical, operational and financial challenges of a changing healthcare landscape. As a global leader in medical imaging, laboratory diagnostics, and healthcare information technology, we have a keen understanding of the entire patient care continuum—from prevention and early detection to diagnosis and treatment.
Background and Problem Statement
In order to keep our logistics operation running as smoothly as possible, the Operational Intelligence (OI) team automates tasks, develops user-friendly software, and gathers as much relevant data as possible for all parts of the supply chain. Over time, the team has collected a wide variety of data sets and is receiving inquiries about the data from both inside and outside the department. While the OI team is capable of providing data analysis, the number of requests are growing. In some cases, the most efficient solution is to give the requester the data and let them analyze it themselves. The big problem with this, a problem we’re asking you to solve, is that figuring out how to use the data is too complicated for most of our users.
Project Description
We are looking to provide potential data-users with a delightful-to-use tool that helps them dive into the relevant tables and fields. In addition to being able to browse metadata, this includes the ability to add, update, and retrieve datasets, to explore how data sets are related to other ones, and to make simple reports by combining and filtering datasets.
By creating a comfortable and intuitive web experience, we want to encourage our data-users to perform their own data exploration and analysis.
Technologies & Other Constraints
This is an extension of a web-based project built with React, Python, DynamoDB, and Flask. Experience with any of these is a bonus but not a requirement.
Note: Students will be required to sign an NDA when the team is formed.
Skyward Federal
Skyward Federal is a leader in secure cloud-fusion technologies supporting sensitive data processing. We develop modern, secure infrastructure and privacy-centric applications to help our clients develop and operate securely and efficiently.
The current NCSU team project will focus on developing and enhancing the next generation of secure multi-tenant cloud compute. In particular, the NCSU team will help develop a platform and pipeline to facilitate rapid application development and deployment for security-minded clients and facilitate secure data transportation and separation.
Project Overview
Last semester, the Skyward senior design team developed a minimal platform which could host Docker-containerized services which were spun up and destroyed using a RESTful API written in Flask. One RESTful service, CourseManager, was developed which communicated with a PostgreSQL database and could be interfaced via a web front-end. PostgreSQL’s SE-PostgreSQL module was used to label data in the database and SELinux was used on the operating system and integrated with the platform to separate this data based on permissions granted to users connecting with the service.
This semester, the project is: (1) adapt this system to run using Amazon’s Firecracker MicroVMs instead of Docker containers; (2) develop and host a second service, which will use Elastic’s Elasticsearch data store privately to aggregate data from the SE-PostgreSQL database; and (3) use a performance-measuring tool like Elastic APM to continuously measure performance for the system throughout development. This project will continue to use SELinux as a mechanism to separate data.
Project Benefit and Utility
Skyward Federal will benefit from this project as a research effort to guide how we approach development of our platform. We will also be able to use this project as a sandbox to test development and a proof-of-concept to display internally and to clients.
Our end-users will benefit from our platform by gaining: a simple method for isolating data, a quick, easy-to-use, and secure development platform for their own applications, and a quick way to interface with their applications.
Constraints
The senior design team shall develop onto a development target provided by Skyward. This will be a physical machine running a SELinux-enforced CentOS 8 OS and either be hosted by Skyward Federal or Amazon Web Services. The team shall install and use AWS Firecracker to host services for their platform. The hosted service developed by the team shall use an Elasticsearch private data store.
It is recommended that the team use Elastic APM for performance measurement.
The platform and second service shall be interfaced with using a RESTful API. A web or command-line interface shall be created to hit these endpoints.
There are no licensing or legal constraints for this project.
About Cisco
Cisco designs, manufactures, and sells Internet Protocol based networking and other products related to the communications and information technology industry around the world. An integral part of our DNA is creating long-lasting customer partnerships, working together to identify our customers' needs and provide solutions that fuel their success. Additional information about Cisco can be found at: https://www.cisco.com/c/en/us/about.html
The team you will be working with is the Cisco Product Security Incident Response Team (PSIRT). PSIRT is responsible for responding to Cisco product security incidents. The Cisco PSIRT is a dedicated, global team that manages the receipt, investigation, and public reporting of information about security vulnerabilities and issues related to Cisco products and networks.
Background and Problem Statement
Software and hardware security vulnerabilities will continue to rise. The number of products, software packages, and connected devices will continue to rise. One reason for the increase in reported vulnerabilities is the fact that the industry is getting better at finding vulnerabilities. Not only automation is needed in order to better respond and remediate vulnerability reports, but also to identify the root cause and underlying weakness of each vulnerability. This allows you to learn from previous vulnerability reports in order to avoid introducing the vulnerability.
The Common Weakness Enumeration (https://cwe.mitre.org/) - is used to identify and document the root cause (weaknesses) of vulnerabilities disclosed in the industry. It serves as a common language, a measuring stick for security tools, and as a baseline for weakness identification, mitigation, and prevention efforts. CWE is industry-endorsed by the international CWE Community, which includes representatives from major operating systems vendors, commercial information security tool vendors, academia, government agencies, and research institutions.
Cisco assigns CWEs to all Cisco Security Advisories. You can obtain all Cisco Security Advisories at https://cisco.com/go/psirt. However, the goal of this project is to be able to have a system that can assign CWEs to any vulnerability (multi-vendor and open source vulnerabilities). The training set should include information from the National Vulnerability Database (additional details below).
Project Description
Students will research and implement a solution to automatically assign CWE identifiers to software vulnerabilities using machine learning and leveraging data from the National Vulnerability Database (NVD) and other sources. The students are expected to:
- design and deploy with an infrastructure for testing their code.
- research the best method to increase the fidelity of the CWE assignment to each public security vulnerability.
CWE assignment in the industry is done manually and often incorrectly. The outcome of this project will enable numerous organizations in the industry to successfully perform root cause analysis in a scalable-automated fashion. The tool developed could be used by security engineers, analysts, and PSIRT teams. It can also be used by software engineers to learn about the underlying weaknesses introduced in code (i.e., lessons learned). This information can be used to potentially avoid introducing vulnerabilities during the software development process.
The list of all CWEs (identifiers) can be obtained from https://cwe.mitre.org. You can obtain examples of CWE assignments in Cisco Security Advisories (https://cisco.com/go/psirt). Another example of companies assigning CWEs is Red Hat. You can obtain information about their publications at: https://access.redhat.com/security/security-updates/#/.
You must not limit this research to only Cisco and RedHat data. You can start by using public security vulnerability information from NVD (https://nvd.nist.gov/vuln/data-feeds) then expand to using data beyond the generic description of each vulnerability. This additional data could include information about the bugs and any other references linked to the NVD advisories.
Technologies and Other Constraints
Students must have familiarity with
- Python
- Linux
- data science concepts, as well as motivation to research different machine learning technologies and develop a proof-of-concept solution.
- CSC415 Software Security course - recommended but not required
If successful, the solution will be open sourced under the collaboration between Cisco and NCSU.
Sponsor Details
This project is going to be mentored by the NCSU Senior Design center to create a prototype Apache2-licensed open source application. This project is being led by Michael DeHaan.
Project Details
Let’s Build A Cloud.
The goal of this project is to make it easier for small teams of developers to manage large numbers of production web applications without having dedicated IT staff.
Increasingly software applications are organized as containers (or more specifically, Docker containers) rather than as virtual machine images. Once a container image exists, it is the job of a container scheduler to place one or more running copies of the container in the data center, and keep applications running even if host machines go down. There are various management systems that can help take an application packaged as a container and place it into a cloud or physical datacenter. Most notably, Kubernetes is recently popular - but also very complex and expensive to deploy.
This project will create a lightweight, minimal container scheduler - with very few dependencies - that could replace Kubernetes in either Amazon or a physical datacenter.
It will have the following parts:
A web application
Admin users will be able to define container images by name, system requirements, ports used, and how many copies of the application will need to be running. The web application can be fairly basic, but should require a Django login to access the configuration pages.
Admins can log back into the web application to increase the amount of hosts the container is running on, as well as see what machines are hosting the containers.
The web interface could also be used to delete containers from the system.
The web interface will also be used to add new hosts into the system.
A management daemon
The management daemon will periodically ask all of the host nodes what containers they are running and how much free resources they have available. When it is time to scale up an application or deploy a new one, they will message the host control daemons with the most free resources to carry out those actions.
Similarly the management daemon must also support scale-down and retirement requests, where it should most likely remove containers from the busiest nodes.
A host control daemon
The control daemon will run on each host and periodically report information about free resources and running containers to the management daemon, and respond to requests to deploy containers. When a new application is deployed, the control daemon will keep track of mapping host ports to application ports. The host control daemon will download container images from an open source container registry or Docker Hub.
(It should ideally support private Docker Hub accounts)
A load balancing cluster
A load balancer distributes incoming web requests to multiple host machines, to allow the topology to scale horizontally. This means that incoming web requests will be routed to different host machines, and potentially dozens of hosts could be running copies of the container.
The host control daemon should ensure that, in general, only one copy of a container runs per host. This is for load balancing reasons and also for service continuity reasons in case a server goes down for maintenance or otherwise fails.
A message bus
A common message bus will be used to communicate between all software components. An example of a message bus to use might be Nats or MQTT - exploration of other options is possible. In general we’ll keep this fairly abstracted so other message buses could be easily swapped out.
A test program
In order to test, we will need to deploy a couple of very minimal web services that talk to a database. These services can be quite basic.
Constraints
The web application and management daemon will be written as a Python/Django project, using Celery for message bus communication and backend job polling. Any message bus choices should be abstracted. The load balancing layer will use NGINX, and the mechanism of reconfiguring the NGINX tier can be determined later. Where possible, all technological choices (other than Python/Django) - such as message buses, etc, should be abstracted to allow for swapping them out with other components, such as another message bus. The system can use the docker python API on the management nodes to start and interact with running containers. To keep things simple, the web page can use basic forms and does not have to employ any javascript frameworks such as React or Angular. For the first part of the project, Django Admin can be used so work does not have to wait on the web application to proceed.
We will focus on making a system that is easy to maintain and debug in a production setting, for deploying production applications.
Success for this project involves deploying multiple demo services that all use a common database.
Frequent code reviews will be a major part of this project - the goal is to gain a working understanding of what it takes to build an end-to-end cloud management system, capable of running in a physical datacenter to power a wide range of microservice applications.
Project Description
The Mobile Gaming Research Lab (MGRL) at NC State is looking for a student /group of students to design and develop a web application with a searchable atabase to support research on mobile games. The students will work on designing and building both the front-end and back-end of this web application.
The mobile gaming database will store historical information about three kinds of mobile games: (1) games played on mobile gaming consoles, such as Mattel Football and Nintendo Game & Watch Parachute, (2) games played on mobile phone screens, such as Tetris and Snake, and (3) games played with mobile phones, but that take place simultaneously in physical and digital spaces, such as location-based mobile games,[1] hybrid reality games,[2] pervasive games,[3] augmented reality games, and urban games. We want to store information about mobile games developed from 1975 until 2008, which was the year the iPhone 3G was released. For each cataloged game, the database will have descriptive information about the title of the game, year of creation, kind of game, fabrication information, available documentation of the game/gameplay (i.e., video, demo, etc.), input/output features, purpose, target audience, number of players, location, genre, platform, software, and scholarly articles associated with them.
The idea is that database users will be able to search games by any of the above-mentioned criteria, which will allow for a robust search system that will help researchers not only to find games, but also to create new correlations among historical types of mobile games. We will also have a form on the website that will allow people to suggest new content for adding to the database. The suggestions will be reviewed by the MGRL staff before being entered in the database. The database will invoke semantic organization of the content (as opposed to alphabetical, chronological, numerical, etc.). The database will also include a map that will allow users to visualize where games were created. It is our intention to allow database users to suggest new entries, which will go through a review process before becoming an official part of the database.
The database will be linked to the MGRL website as one of our main navigation menus. The Mobile Gaming Database will be hosted on NC State College of Humanities and Social Sciences (CHASS) IT servers. We will ensure the database design follows the University branding and guidelines and is created using the CHASS Content Management Interface (CMI), so that CHASS IT will provide ongoing support for it. The current MGRL website is already hosted at
CHASS IT servers, so we will just add a different product to the same domain. Database content will be able to be exported as a .csv file, so that the data can be sustained, migrated, and/or harvested in the future. Data entry forms will be mobile responsive so that users can complete forms across devices. The website will also include a third-party tool that will automatically compress images so that they are web-ready and so that they conserve space on the website’s server and load quickly across computer and mobile devices
Technology and Skills
- A modern web-development technology stack is required. Working with the advisers, the students will pick the exact technology. Some options to choose from:
- front-end: React/Vue/Angular
- back-end: Frameworks such as Django (python) or Spring (java)
- Database: PostgressSQL
- Some previous experience with web-development and database design is preferred but not required. Students that have already taken CSC326 should have the experience to tackle this project.
Deliverables
- Define clear technical requirements based on discussions with the MGRL team.
- Create technical software design
- Implement using good software development practices such as
- Clear iterations
- Version control
- Code refactoring for clean and readable code.
- Develop a Testing Plan and aim for 70% testing coverage of the code
- Create clear documentation: installation guide and development guide
[1] Location-based mobile games are all games that use the phone’s location-awareness to geolocate digital objects onto the city space. They also allow players to interact with each other depending on their physical location (de Souza e Silva & Hjorth, 2009).
[2] Hybrid Reality Games transform the city into the game canvas and players interact with each other depending on their relative position in physical space. Additionally, they have an online component, represented as a 3D virtual world, so they take place simultaneously in physical and digital spaces (de Souza e Silva & Hjorth, 2009).
[3] Pervasive Games mix real life with playful spaces, using a variety of electronic channels, so that players never know whether or not they are playing the game (Taylor & Kolko, 2003).
About NetApp, Inc.
NetApp’s StorageGRID is a distributed, scale-out object store that implements Amazon’s S3 (“Simple Storage Service”) protocol, allowing customers to build and manage their own S3-compatible cloud storage solutions. Our users have asked us for an open-source, redistributable, browser-based GUI S3 client, supporting simple operations such as PUT, GET, and bucket listing. Can you help us put one up on GitHub?
Background and Problem Statement
NetApp’s StorageGRID is a distributed, scale-out object store that implements Amazon’s S3 (“Simple Storage Service”) protocol, and can be deployed on-premise as a cost-effective and performance-optimized alternative to public cloud S3 offerings.
Many of NetApp’s StorageGRID customers themselves have customers, to whom they would like to offer simple, graphical S3 browsing capabilities in addition to CLI tools, SDKs, and application support. Essentially they would like to be able to offer the same graphical data path functionality as the Amazon S3 console.
Today NetApp has nothing to offer these customers. We would like to be able to point them to a NetApp-sponsored open source S3 GUI on GitHub, ideally one that runs entirely within the browser, that they can freely redistribute as-is, or modify to suit their purposes. This project is to develop that S3 GUI.
Project Description
Develop a browser-based S3 data path GUI providing a key subset of functionality available in tools like S3Browser. This includes, but is not necessarily limited to:
- Graphical, file-system-like display of S3 buckets and objects
- Support for PUT and GET, including multi-part
- Object metadata access and update
- Secure S3 transactions using TLS and AWS-style authentication
Although most S3 transactions are made by applications, and/or driven from the CLI (for example, aws-cli), it is sometimes very convenient to be able to look at the objects in a bucket, for example, or create a new bucket, or do a quick PUT or GET, without having to resort to the command line. Customer demos are an important use case -- it's much more interesting to look at a nice GUI demonstrating the data path functionality of our product, rather than watching somebody slowly type CLI commands.
Possible Architecture And Implementation Considerations
NetApp is interested in the innovation you bring to this project, but it is difficult to understand or convey the scope or requirements for a project without making some assumptions about what will be implemented. In this section we briefly present a possible architecture, in order to clarify some of the potential technical challenges. Please do not consider this specific architecture to be part of the requirements for this project; we’re hoping you have better ideas than us.
Pages/Views
Authentication
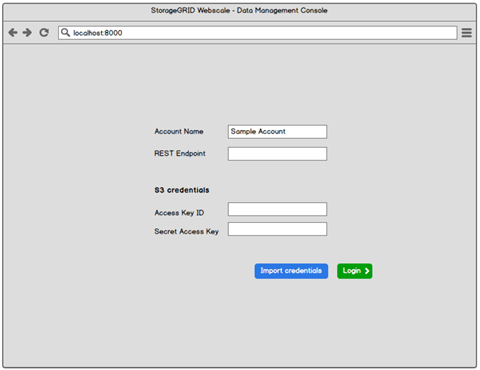
- S3 credentials – Access Key ID, Secret Access Key
- REST endpoint
- HTTP/HTTPS selections
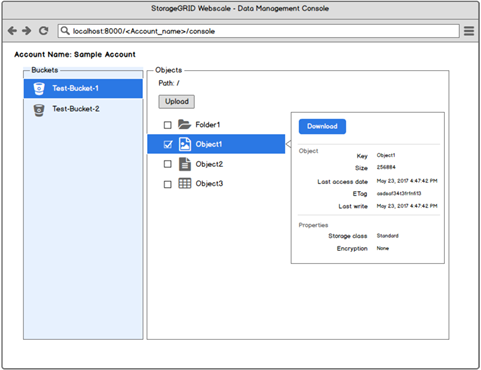
Data viewer
MVP
- Buckets – Create, view, update, delete
- Objects – upload, view, download, delete
- Must support multipart upload and download
- Must support some form of pagination. StorageGRID supports billions of objects in a single bucket.[1]
- Object metadata - view
- Folders – create, view, update, delete
Stretch Objectives
- Versioned objects -- view version stack, view, download, or delete specific version
- Objects
- Parallel multipart upload
- Resume interrupted multipart upload (within 15 days)
- Search/filter: integrated with pagination solution. Allow user to specify a pattern or regex and only display objects matching that pattern.
- Object metadata -- add or delete tags
Technologies and Other Constraints
Slight preference for HTML5, but open to javascript. https://docs.aws.amazon.com/sdk-for-javascript/v2/developer-guide/s3-browser-examples.html is a compelling option.
Strongly prefer browser-only (no server-side component to the app, other than the actual S3 service provided by StorageGRID, of course).
NetApp will provide access (account, S3 keys) to https://webscaledemo.netapp.com for testing. This is an Internet-accessible StorageGRID deployment managed by NetApp, primarily used for interoperability testing with third-party S3 applications. It provides a comprehensive subset of the full S3 API available through https://aws.amazon.com/s3/.
MVP is a desktop browser-based app. Mobile support is desirable but not a priority.
Any open-source software used in this application must have permissive, non-viral licensing that allows for modification and redistribution at no charge, and with no requirement to open-source other software. NetApp will be happy to evaluate the suitability of any specific component license; no need to guess.
The final product will be open sourced on GitHub (or similar) and must not, itself, be encumbered by a non-permissive or viral license, or other forms of code ownership.
[1] An S3 account may contain a large number of objects in a bucket. To load all these objects in the UI would slow down the web browser and it may have an impact on user experience. To resolve this issue, a certain limit is set to the number of objects that can be loaded in the UI for a given bucket. This limit is configurable and a screen to change this setting is provided. This limit is called “Marker Size” and its default value is 1000. So by default a maximum of 1000 objects will be loaded in the UI which will be fetched by S3 API call.
User may want to explore the next set of objects in the order. To achieve that user is provided pagination to be able to navigate to previous and next set of objects. User can also set the page size of objects. So for example if the Marker Size is 1000 and the page size is 20, 50 pages will be loaded in the UI. When user is on the 50th page and clicks on “>” button, the next set of 1000 objects from S3 bucket will be loaded from backend to the UI. At this point, user will be now on 51st page and 51 to 100 pages will be loaded. User can go back to the previous set by clicking on “<” button on 51st page.
SourceOptics is an open source git analytics dashboard, developed in CSC492 since 2019, that helps software development teams work more smoothly by understanding development patterns.
So far, SourceOptics has been worked on by two teams of CSC492 students and we use it in the course today. You can read more about SourceOptics (and get the code) at http://sourceoptics.io/
Some course use cases for SourceOptics include::
- Understanding what a team is working on over time, and how hard a team is working, even if that work is spread out over multiple and rapidly changing branches
- Identifying when a team might be slowing down, might be stuck, and could use some help.
- Eliminating gatekeeping or uneven efforts within a teamand making sure work is divided up fairly and effectively between team members.
- Give proper recognition to strong performers in a team, despite possibly not being as vocal in team meetings
- Understanding how efforts and processes compare between different teams
In an industry setting, SourceOptics could also be used to better understand in what repositories effort was being applied, which services were more expensive to maintain (and needed more resources/funding), were undergoing higher rates of change (and may need more testing attention), or had not changed recently (and might need updates). It can also help identify who the primary developers of particular directories and files are, and how that changes over time.
SourceOptics has some similar commercial solutions that cost as much as $500/developer/year (examples include "Pluralsight Flow" and "Waydev"), which means the opportunity for a free tool with similar capabilities should be very appealing. In order to get more users and open-source contributors for SourceOptics, it would be helpful to revamp our user interface and user experience to attempt to match or exceed the commercial applications. This will also help us use SourceOptics more effectively in the class.
In this project we will:
- Conduct usability testing of the SourceOptics UI with professors and students to see what things most need to be improved
- Work with sponsors to come up with more streamlined navigation
- Work with sponsors to come up with a minimal, impactful, and modern theme for the application (and ideally the website).
- Implement consistent breadcrumbs, deep-linking, and cross-linking (where applicable) to GitHub and BitBucket commit descriptions and repo pages.
- Support checking out GitHub Wikis as team projects, to record student contributions to Wikis (This will include developing changes to the Python statistics code to compute per-team statistics).
- Redesign the “file explorer view” to give better views into who is working on what within a repository
- Re-evaluate usability testing periodically with time for evolving new components to make them easier to use
Additionally, we need to come up with a reasonable, efficient, and maintainable testing system for SourceOptics that does a better job of testing features that need to be ensured still work, without making SourceOptics hard to rearrange - or tests time consuming to develop. This mostly means being able to traverse various URLs to make sure they do not produce errors and include basic page components, after starting with a clean list of repositories to scan.
Technology
SourceOptics is implemented in Django (Python 3) and PostgreSQL, CSS/Bootstrap, Ag-grid (for tables - this can change), and uses Plotly for graphs. UI work will involve python view code, Django templates, CSS (introducing CSS templating systems is welcome), and limited javascript as needed (jQuery is present, adding new tools and components is welcome), but not introducing large and rapidly changing frameworks like React, AngularJS, or VueS to make it easier for us to maintain the application and keep it simple to understand.
Python development will be a reasonably large part of the project as view code is modified and improved. All current app functionality will need to be preserved. We prefer to do a lot of heavy lifting on the backend versus the frontend -- keeping javascript components more targeted and pragmatic to keep things more easily maintainable.
This project will have a very strong emphasis on frequent code review and writing maintainable code, as the application developed will undoubtedly be used for many future sections of Senior Design and potentially other NCSU courses as the application expands.
This project is being led by Michael DeHaan.
Sponsor Details
SunTrust and BB&T have combined in a historic merger of equals to create Truist, the sixth largest U.S. bank holding company. With 275 years of combined history serving clients and communities in high-growth markets, our new company will deliver the best of both companies’ talent, technology and processes. At Truist, our purpose is to inspire and build better lives and communities. Every day, the pursuit of better drives us—to empower clients with more choice, teammates with more fulfillment, and communities with more hope. We boldly believe in the power of what we can achieve together.
Within the Corporate Cyber Security department at Truist – is the Cyber Operations Team. Nine different teams make up this team:
- Cyber Incident Management,
- Cyber Fusion Centers,
- Payment Security Engineering & Operations,
- Red Team Services,
- Threat Scenario Management Services,
- Cyber Threat Intelligence Services,
- Cyber Integration Services,
- Cyber Operations Development & Innovation Services, and
- Cyber Operations Service Management.
Cyber Operations Service Management covers a wide range of support to the larger Cyber Operations team including but not limited to: Audit and Regulatory tracking / responses, metrics (daily, monthly, quarterly, and annually), Project Management, and Communications.
Problem Statement
In today’s environment it is increasingly difficult to gauge and measure the teammates’ well-being. Cyber Operations is interested in monitoring and supporting the positive well-being of our teams and therefore removing that potential barrier to strong performance and connectivity to work.
Project Goal
The goal of this project is to build a responsive web application that gathers, baselines and reports teammates’ emotional state. To do this, the app will survey the teammates and match their emotional words to a sentiment. For examples on how to match words to sentiments, we will look at media monitoring tools that report positive /negative /neutral emotions. Here is an overview of some available Sentiment Analysis Tools: https://medium.com/@datamonsters/sentiment-analysis-tools-overview-part-1-positive-and-negative-words-databases-ae35431a470c
This information about the teammates well-being will be stored in a database, sorted and measured in a way that Truist managers could also compare emotional state to:
- to team performance
- staffing / attrition rates
- track impact of items / campaigns to improvement.
Truist managers will use this web up to measure and address negative trends in teammates emotional state and reinforcing positive trends conversely.
Would teammates be able to see anything from the web app … or do they simply fill out the surveys?
Suggested Technologies & Other Constraints
- Front End: React
- Back End: Python and Django
- Database: PostgreSQL?
- Option for mobile usage - PWA features (https://www.altexsoft.com/blog/engineering/progressive-web-apps/)
Additional Reference to Read:
https://jaredtendler.com/emotion/
https://pubmed.ncbi.nlm.nih.gov/10833769/
https://pdfs.semanticscholar.org/8bda/589db15c5b866e08307f304a8aedb56213e2.pdf
About Bandwidth
Bandwidth is a software company focused on communications. Bandwidth’s platform is behind many of the communications you interact with every day. Calling mom on the way into work? Hopping on a conference call with your team from the beach? Booking a hair appointment via text? Our APIs, built on top of our nationwide network make it easy for our innovative customers to serve up the technology that powers your life.
Background and Problem Statement
Most technology teams have a quick, daily status meeting called a "stand-up" where everyone can share their progress. Now that we're all working more remotely, a lot of these stand-ups are being done with video conferencing software.
Using Bandwidth's innovative audio and video APIs, we would like a team to build a new video service that’s made specifically for daily stand-up meetings! Conference apps like Meet or Zoom are good for video calls, but we want ours to have lots of useful features built in, like countdown timers, visual indicators and more. We’ll look to you to come up with other useful and fun features.
Project Description
This project will require students to build a modern web application consisting of a back-end service (Java, Python, Ruby, Go, etc..) and a React JavaScript front-end, that will run in a Chrome web browser. Students will use Bandwidth's WebRTC APIs to connect audio and video streams to enable people to see and hear each other using only a web browser.
We will look to the team to design the UI/UX and implement interesting features to make this a useful tool for stand-ups, such as:
- Live video feed of each participant
- Countdown timer to keep the minute short (15 minutes!)
- Timers for each member’s individual update
- Spotlighting each team member as they update
- Visual indicators for who as taken a turn, and who has not
- Buttons/visual indicators for “parking lot” items and demos
You can customize the application as you see fit!
During this time of extended remote working, we would like this solution to be a way for Bandwidth's teams to efficiently and effectively run their daily stand-up meetings. Video provides a great way for the teams to interact remotely, and we look forward to students building other interesting features that will make this a fun way for us to host our daily stand-ups.
Technologies and Other Constraints
This project will be a web-based application running in Amazon Web Services. Students have some flexibility to choose a programming language for the web application server (back-end). We would recommend NodeJS, Python, Ruby, Java or Go. Students will need to implement a React javascript front-end, and we can aid in set up and development if necessary.
Students will also be using Bandwidth's WebRTC APIs to deliver audio and video streams in a web browser. Knowledge of WebRTC is not necessary -- we're happy to help students learn to use our APIs to make this work.
About Katabasis
Katabasis is a non-profit organization that specializes in developing educational software for children ages 8-15. Our mission is to facilitate learning, inspire curiosity, and catalyze growth in every member of our community by building a digital learning ecosystem that adapts to the individual, fosters collaboration, and cultivates a mindset of growth and reflection.
Background and Problem Statement
Our modern education system generally trains us to break down problems into small and understandable pieces to trace the direct paths from cause to effect and to solve problems by adjusting variables on the other side of the equation. As useful as this approach is, if we rely exclusively on it we risk losing the insights to be gained from holism or systems thinking. The idea behind this other mode of thinking is that “the whole is greater than the sum of its parts” and that a system’s structure can provide additional insights about its behavior over time.
Katabasis would like to introduce middle school-aged students to concepts in systems thinking via an educational game that simulates the spread of an infectious disease through a population. By exploring a current topic that’s relevant to the students' lives we hope to increase engagement with the game and promote health behaviors that the students can immediately take to improve their well-being.
Project Description
We would like to develop an engaging, replayable game where the player would adjust government policies attempting to curtail the spread of the disease. These policies will govern the behavior of autonomous NPCs (citizens), allowing the player to observe the changes in the dynamics of the system.
Players will progress through multiple levels that start off relatively simple to introduce concepts, then advance to increasingly difficult levels as the complexity of the simulation increases. Beginning levels will focus on delivering information pertaining to the spread of viruses, movement patterns of a small population, understanding change over time graphs, and basic policies that can be implemented to curtail the spread of the virus. Factors such as immunity, death rate, longevity, etc will be held constant in early levels but become dynamic at higher levels. As new variables are opened new policies will be able to be selected to counter the new variables.
The envisioned game, though it deals with infectious diseases, is most similar to turn based and real-time strategy games that have a heavy emphasis on managing large groups of people. The Civilization game series and the Tycoon game series are well-known series that have mechanics similar to what is envisioned. A breakdown of requested mechanics and examples from existing games that have similar components are listed below.
- Civic policy options: Civilization IV - policy cards
- Civil discontent: Civilization IV - anarchy system
- Charting of effect over time: Civilization IV - end of game analysis
- Movement of NPC's: Rollercoaster Tycoon
- Infection indication: Rollercoaster Tycoon - illness indication
- City design: Forge of Empires, Skyward City
An important component is the logging of student actions. After students have played the game, Katabasis would like to be able to review what the students did in the game which led to deeper engagement or quitting the game. For the purposes of this project, the team will need to log the action a student took (such as changing a policy) and the time the action was taken.
The Senior Design group will be expected to conduct two think-aloud sessions online with middle school students. Katabasis will supply the middle school testers. The first think-aloud session would ideally be after the Senior Design team has developed a minimum viable prototype that demonstrates the basic game mechanics and a single level. The think-aloud session is intended to solicit player feedback that will be used to inform improvements to the game. Senior Design students will work with Katabasis team members to down select additional features to incorporate over the second half of the project. A second user feedback event will be held at the end of the project (same format as first event) and the Senior Design team will include, as part of their final deliverables, documentation of suggested next steps in the development of the game.
Accuracy to real life data is not the goal but high level trends over time should be representative of what infectious diseases could do in the simulated environment. Katabasis welcomes any input from the Senior Design students in the development of educational content, user feedback surveys, user agreement forms, etc. but to keep the project within scope we will head up this work ourselves.
This system will be used as an educational tool after the completion of this senior project. While it is not important that the Senior Design team measure these items, we would like to inform them that effectiveness of the game will be measured by the following:
- Engagement: length of play time, # of levels played, # number of repeat visits
- Enjoyment: user survey, scale of 1 to 5
- Mathematics Knowledge
- Modeling: change over time graphs, slope, linear vs exponential growth
- Infectious Disease Knowledge
- Types of pathogens, means of transmission, disinfection,
- Systems Thinking Knowledge
- Feedback loops, stocks, flows, delays, oscillations, dynamic equilibrium
- Improvement in predictions of system behaviors
- Adoption of Healthy Behavior: teacher survey
- Civics Knowledge
- Public policy options, public awareness, adherence to policies, enforcement
Technologies and other constraints
We would like to have this game implemented using the Unity Game Engine in C++. The target platform is the web browser (Using Unity’s WebGL Export), but would like to make it mobile-accessible if time permits.
Upon the completion of the project, the code will be open sourced and a running version will be hosted on Katabasis.org, with the associated students' credits (names and contacts), if desired.
Students will be required to sign over IP to Sponsor when team is formed.
About NC State Utilities & Engineering Services (U&E)
The mission of U&E is to provide thermal and electric utilities to campus buildings and auxilliary areas in a manner that is clean, reliable, efficient and cost effective. U&E has made extensive upgrades to three of five campus utility plants in the past 10 years including replacing two older boilers at the Yarbrough Utility Plant with cleaner and more fuel efficient ones subject to EPA's continuous emissions monitoring requirements. Typically, the boilers operate about 1200 to 1500 hours per year with most of the operation occurring from October to April. Usually, the boilers only operate a few hours between the Spring semester’s ending and the beginning of the Fall semester.
Background and Problem Statement
NC State currently uses continuous emissions monitoring systems (CEMS) to demonstrate the Yarbrough boilers meet EPA's new source performance standards. These standards require NOx to be monitored at least 97% of the boiler operating time. Whenever a CEMS fails the daily QA/QC check, all previous 24 hours of data are deemed invalid, reducing the amount of time the boiler is considered to be monitored. To avoid a violation of the standard, NC State spends approximately $50,000 in labor and materials each year keeping the CEMS within spec. Instrumentation techs frequently replace or rebuild components and recalibrate. As the system ages, U&E expects the cost of maintenance and the likelihood of excessive downtime to increase.
EPA regulations allow for CEMS to be replaced with predictive emissions monitoring systems (PEMS). PEMS are an acceptable alternative to CEMS as long as they meet specific standards and adhere to daily quality assurance validations. PEMS provide similar monitoring accuracy at about a fourth the cost of CEMS and are far more reliable. In addition, they operate with real-time data that can be used to operate the boilers in a way that reduces emissions.
Project Description
In this project, U&E would like the student team to develop a predictive emissions monitoring system (PEMS), a sensor evaluation system, and a data acquisition system (DAS) to replace the two existing CEMS boiler monitoring systems. These components are described as follows:
PEMS
This component uses machine learning models to predict NOx values from sensor inputs. PEMS inputs typically include:
- Fuel Flow (gas or oil, i.e., the load)
- Air Flow
- Percent Oxygen
- Steam Flow (production)
- Steam Pressure
- Boiler Inlet and Exit Temperatures.
We will provide historical boiler operation data (sensor readings and measured NOx emissions) to train and evaluate these models, and will work closely with the students to provide domain expertise.The models should be able to produce accurate predictions at least at 1-minute intervals. The inputs and predictions should be stored on a database. Additionally, this module should be able to raise alerts if the predicted emissions fall outside of configurable ranges.
Sensor Evaluation
This is an independent module that ensures that the inputs the PEMS models are receiving are accurate. The sensor evaluation must check the integrity of each PEMS input at least daily, preferably every minute.
Data Acquisition System (DAS)
This is the main interface of the system in the form of a web-accessible dashboard that allows users to view and download data. This component must be able go generate reports including:
- 15-minute NOx averages
- 1-hour NOx averages
- Daily NOx averages
- 30-day rolling NOx averages
- All periods of excess emissions
- PEMS availability for each quarter
- Boiler data (gas, oil, and steam flow)
Additional information and other resources are available and will be provided to the students as soon as the team is formed.
Technologies and Other Constraints
We would like this solution to be web-based so that it can be remotely accessed to at least five simultaneous users. Statistical hybrid and/or neural network technology is preferred for the models.
U&E will prepare the application for a permit modification to allow PEMS in place of CEMS. We expect it will take up to 12 months to get it approved.
About PRA Health Sciences
PRA Health Sciences provides innovative drug development solutions across all phases and therapeutic areas. PRA Health Sciences Cybersecurity Team is a small group of professionals that share a passion for the topic. Our team is excited to cooperate with NCSU students on the third project to further develop the RePlay Honeypots. The Project has recently been released as an Open Source Project on GitHub and the team will actively contribute.
Background
Honeypots are systems that behave like production systems but have less attack surface, less resource requirements, and are designed to capture information about how potential attackers interact with it. Their intent is to trick an adversary with network access to believe that they are a real system with potentially valuable information on it. The adversary’s effort to break into the honeypot can reveal a lot of information about the adversary and enable defenders to detect and gain an advantage on this threat.
Project Description
In this project, students will continue the work on low-Interaction production honeypots, which can be configured and deployed easily, remaining cost effective in large numbers. The system is architected around three main components: 1) a central management system that provides a way to monitor and control honeypots and serves as a central repository of data collected by each honeypot it controls; 2) a series of lightweight, secured honeypot that supports various methods of deployment and will simulate network behavior of other systems; 3) a configuration generation tool that will ingest packet capture (PCAP) and Nmap scan outputs, and generates configuration files that honeypots use to determine how they should behave.
Central Management System
Users should be able to view, modify, and create honeypot configurations.
In Phase 3 the following features are requested:
Improvements in Security, Authentication, Authorization
- The system must support HTTPS for the management frontend (This may also be used for configuration tunnel encryption)
- The system must support SAML 2.0 (e.g. AZURE AD) authentication.
- The system must support both authentication methods after initial setup
- The system must support adding accounts as SAML 2.0 or local from the management frontend.
- The system must support the following account recovery options
- The system must support user-initiated password changes given they are authenticated on the frontend. (need password to change password)
- The system must support administrative password resets on a user account.
- The system must allow admins to choose if a user's reset password is a one time password (OTP) (Password expiry on next login)
- The system must implement a role based access control (RBAC) system that supports the following user types (authorization)
- Admin
- Admins can create other users of each type
- Admins can promote other users to admin status
- Admins can reset other user's passwords (linked to 4.3.3)
- There must be at least 1 admin in the system
- Editor
- More privileges than auditors, can change options for devices / groups.
- Editors cannot create other users.
- Auditor
- Read-only access to the frontend & traffic data.
- (Stretch Goal) Custom Roles with more granular rights & access controls
- Admin
- The RBAC system must support access controls to:
- user accounts
- administrative logs
- traffic logs
- devices
- device groups
- configurations
- RBAC controls for the devices & groups
New Functionality
- Device Grouping
- The system must support grouping devices dynamically from the frontend
- The system must allow authorized roles to create new groups and modify groups
- The system must allow for the "summary & details" views to only present data from a given device group
- The system must have a dashboard to see and manage existing device groups, as well as the permissions associated with them
- Health Metrics
- The system must report health metrics and device statuses to the management system. (EG. CPU usage, RAM usage, storage, heartbeat)
- The system must allow for displaying supported health metrics on the frontend for each device & device groups.
- The system must support displaying supported health metrics for device groups
Database & Configuration
- The system must keep a log of administrative actions taken in a partition of the database.
- The system must support having a redundant / collaborative management database.
- The system must support central management and assignments of configurations for honeypots
Honeypots
The initial configuration of a honeypot will be based on an Nmap scan of another system that the honeypot must attempt to replicate. With this input, the honeypot should configure its simulated services so that a Nmap scan to the honeypot produces no detectable differences, while having as little attack surface as possible.
In Phase 3 the following features are requested:
- Bug Fixes
- Changes as required by other features developed
- Improvement to the Honeypots ability to replicate additional protocols in various scan situations
- TCP/UDP Scan
- SYN, ACK, FIN, NULL, XMAS Scan
- IP protocol scan
- ICMP Support
- SSL Support
Config Generation Tool
The Config Generation Tool is a standalone tool that will ingest packet capture of a system that has undergone a Nmap scan and the respective scan results and generate a configuration file for the Honeypots that can be imported.
In Phase 3 the following features are requested:
- Development of the Config Generation Tool
- Given a NMAP scan and a related PCAP file, the system must generate a port response configuration (ports, protocols, payloads) that is ready for a honeypot's use.
- If input files are malformed, the system will notify the user and exit.
- The system will show the user the generated configs (in a human-readable form) to check their validity.
- This feature will be separate from the honeypots, and once prototyped, may be introduced as part of the frontend.
Technologies and Other Constraints
Python3, NodeJS, VueJS, and Bash are preferred development languages, the TRIO library is recommended for multi-threading. Docker is currently used to easily manage and deploy honeypots and will remain the preferred solution for this phase. Nevertheless, all functionality of the Honeypot itself needs to be supported and tested on Linux without Dockers. CouchDB is the currently supported Database. Technology pivots are possible but need discussion with the Sponsors.
Each component of the system will be designed with large scale deployments (>100) in mind. Students should use best practices for the development of secure software and document in great detail. Students should also strive to design honeypots to be modular so that additional protocols can be introduced, and additional functionality can be created, e.g. RDP, SSH, SMB Honeypots, Honey Websites and active beaconing. This Project is published on GitHub [link to follow] and the Students will be required to follow GitHub processes and best practices.
Requirements:
Students should have a strong understanding of network principles such as the OSI Model. Prior successful participation in “CSC 405 – Computer Security” and “CSC 474 – Network Security” is recommended for this project. Previous experience with Nmap and OS configuration is an advantage.
Students will be required to sign over IP to Sponsor when the team is formed.
About Strategic Interaction Video
Strategic Interaction Video (SIV) is an upcoming online, pre-recorded video-based learning platform. The most innovative feature of SIV is that, unlike traditional e-learning technologies, SIV allows learners to interrupt the prerecorded video instructor at any point during a lecture to ask a lecture-related question, receive an appropriate pre-recorded response, then resume the lecture at the point of interruption. Video responses to all anticipated questions are recorded in advance as course content is prepared. These video responses are stored within the SIV database along with scripts (text) of these responses. When no appropriate answers are available for a question, the system prompts the learner to contact the instructor.
Background and Problem Statement
The current SIV prototype accepts learner questions as typed-in text or speech (which is converted to text before processing). The SIV database contains transcription scripts of answer videos to anticipated questions. Keywords from learner questions are matched against keywords on answer video scripts to find suitable answers. To do this, MySQL’s built-in functionality for natural language full-text search is used. This keyword-based approach is rudimentary and many times yields responses that, while related, do not directly address the asked question. For example, if a learner asks “How often should I get a flu shot?“, they may get an appropriate answer, but if they ask “How often should I get a flu vaccine?” they may get a response to a keyword-related, but different possible question, e.g., “What is a vaccine?”.
To improve this feature, a previous Senior Design project (Smart Q&A – Spring 2018) investigated multiple Natural Language Processing (NLP) techniques to find more accurate matches between questions and pre-recorded answers with varying results. The product of the Fall 2018 project was demonstrated as a stand-alone Python microservice solution; it was not integrated into the SIV prototype.
Project Description
This semester we would like your help in continuing to improve the SIV prototype, and in particular its Q&A capabilities. The goals of the Smart Q&A II project this semester are twofold: 1) Q&A NLP integration, and 2) NLP Expansions.
Q&A NLP Integration
This part of the project involves modifying the PHP back-end of SIV so that it can interface with the NLP Q&A microservice seamlessly. We would like to keep this microservice architecture so that each component can be more independently modified in the future. We would like to host the SIV back-end and the NLP microservice as Docker containers.
An important aspect is to develop a solution that produces near-real-time responses. Since we are applying these techniques to an interactive system, returning responses in 1 or 2 seconds would be fine, but waiting a minute will not work.
NLP Expansions
The NLP aspect of SIV has many possibilities for expansion, but we would like for you to focus on at least these two:
- Improve the accuracy of the NLP techniques already implemented, possibly replacing with more accurate solutions.
- To simplify adding more answers to anticipated questions into SIV, we would like you to explore and implement a way to automatically produce a video’s transcript using speech recognition on the audio of the video when uploaded. This will allow an instructor to simply record and add a new answer video for it to automatically serve as the answer to relevant questions by feeding its transcript through the NLP pipeline.
A stretch goal, if time permits, would be an exploration of NLP techniques to search lecture content scripts for answers to questions that are not found in the anticipated answers database.
Another stretch goal would look at a subject matter for a course (text content) and come up with possible questions that learners may have. This may involve things like determining what content is not delivered clearly, finding content that is ambiguous, terminology that may need to be defined more precisely, and/or language that can be confusing. This will allow SIV to anticipate questions so that instructors can generate prerecorded answers when a course’s content is created.
Technologies and Other Constraints
The current SIV prototype has a React front-end that communicates with a PHP REST API built on the Slim Framework. The NLP microservice is has a Python REST API powered by Flask. Both systems rely on a centralized MySQL/MariaDB database.
To help you get started, in addition to source code we will give you a series of prerecorded answers relevant to a given subject matter. However, you are encouraged to experiment with many different types of content by generating your own prerecorded answers relevant to one or more subjects of your choosing.
Students will be required to sign over IP to Sponsor when team is formed.
About Bank of America
Bank of America provides banking services to millions of customers. Within the security division, we are responsible for protecting the assets for those customers against all possible forms of cyberattack.
Problem Statement
Detect content about the bank that has the potential to go viral, before it goes viral (or, more accurately, as it is starting to gain in popularity).
Project
There are many companies that will scour social media to alert organizations to the sentiment they are seeing regarding particular products or offerings. In this case, we are more interested in determining if, for a first pass, we can recognize that an item is starting to go viral and thus raise an alert.
Basic functionality
- Code will need to be developed that searches through Twitter for possible bank references, and so will need to operate at this scale
- The (potentially) viral content might be about the bank, but will not necessarily tag the bank, and so tagging the bank cannot be used reliably as a metric. Rather, determining different possible search terms that people might use related to the bank (e.g., hashtags containing BoA such as #BoAIsGreat, BoA, BofA, BankofAmerica, Bank of America, disparaging hashtags, etc.). Additionally, the content might be about a person at the bank, and so searching for names of senior executives should also be performed.
- Students will need to develop code that can alert (via screen and/or email) when an unexpected rise in bank related tweets has been observed
- Analysis should include the similarities between the tweets, e.g., is everyone just retweeting the same thing, or are people adding commentary about something
- What is the initial tweet, e.g., are people responding to a news article, or something someone not bank related posted? Is it a video, or a photo, or text?
- How quickly are the tweets spreading?
- Are the tweets limited to a specific geography?
- Needs to be able to run continuously, but also provide capability to analyze a given historical data range
Front-end interface
- Display as a web page that accesses back-end data
- Provide a dashboard showing tweet statistics, e.g., number of tweets analyzed, graphs of tweet volume over time, summary statistics of different tags (e.g., BofA versus Bank of America, etc.)
Testing
- Testing can be performed against, for example, (historical) known viral content (not necessarily the bank) to demonstrate the code detects the start of viral content, and how quickly the content is detected, and to provide a demonstration of the ability to handle tweet analysis at scale
If the above is completed and the developers still have time to add functionality, some possible extensions include:
- Detection of bot amplification: Add functionality that looks at who is amplifying the tweets and try to determine the percentage of those accounts that are likely bots rather than real people. Add the results of this analysis to the dashboard.
- Analysis of the original post: If the original post contains a link to a news article, or a video, or a photo, determine some metrics for indicating if this original post is linking to real data or fake data, such as fake news, likely propaganda, a falsified photo or a deep fake video. Was the original post generated by a likely bot, or a real person?
- Sentiment analysis: Perform an analysis to determine if the overall sentiment of the viral activity is negative or positive in sentiment.
Technologies and Other Constraints
- Technologies: Python, Twitter API, others as recommended by students.
- Preferred paradigms: desktop, potentially client-server.
- Other limitations or constraints: the students will need to sign an NDA and assign IP rights to the bank.
About LabCorp®
Did you know that the largest healthcare diagnostics company is right in your backyard? Based out of Burlington, North Carolina, LabCorp® has a lot of different research and development centers around the country including the Research Triangle Park (RTP) in North Carolina.
Laboratory Corporation of America® Holdings (NYSE: LH), an S&P 500 company, is the world’s leading healthcare diagnostics company, providing comprehensive clinical laboratory and end-to-end drug development services. With a mission to improve health and improve lives, LabCorp delivers world-class diagnostic solutions, brings innovative medicines to patients faster and develops technology-enabled solutions to change the way care is provided. LabCorp’s 65,000 employees serve clients in over 60 countries around the globe. To learn more about LabCorp, visit www.labcorp.com for Diagnostic services, and www.covance.com for our Drug Development services.
Project Description
Covid-19 pandemic is a challenge for all societies around the world. The life as we knew it in 2019 is not the same anymore. Our social life, back to school, and back to work processes require completely new approaches and LabCorp is in the epicenter to support everybody around the country with testing, school and employer services, as well as data insights to provide safer healthcare and better lives.
To address this historical challenge, LabCorp® is looking to sponsor a project, which aims to create a solution for gathering data from body temperature measurements, lab testing results, and device-capturing along with interoperability with other public data sources or emerging technologies. This solution will provide employers or schools around the country with the ability to bring people back together. The envisioned solution would be able to bring device protocols for contract tracing (e.g. Bluetooth frequency of mobile devices for anonymous contact proximity tracking), device captured or manually captured biometric readings (e.g. temperature measurement upon entering a building or office), and other deep data insights from LabCorp’s big data platforms about real-time results into a series of alert notifications, API services, or administrative dashboards for combating any outbreak. The two separate Apps (a web app, PWA to view/ administrate data and a mobile app to actually collect data) preferred technologies are Typescript, Angular, NativeScript +Angular (for mobile) and Node for backend, specifically NestJS for APIs, and should consider both relational and NoSQL DB for storing the data on the technology front. Alternative digital services like “simple mobile apps” for co-students or colleague to colleague communication are welcome as well.
Expectations and Goals
The student development team will engage on a regularly set schedule with designated mentors from LabCorp®. LabCorp® will provide guidance about enterprise scale architecture and technologies, but leave the students’ engineering creativity a focus point of the project. We will encourage and maintain an ongoing dialogue with the team about how modern research from the students can enhance existing approaches.
The outcome of the project should create a demonstrable solution, which allows to measure the success of developing a set of APIs, consumption of 3rd party services or digital data capturing, and provide an interesting, fun and real-world approach to help everybody. Data capturing and data exchange shall comply with all privacy rules, state and federal regulations, protection of healthcare or personal information and be based on voluntary participation and the respect of personal space and preferences.
About Laboratory for Analytic Sciences
The Laboratory for Analytic Sciences is a research organization in support of the U.S. Government, working to develop new analytic tradecraft, techniques, and technology that help intelligence analysts better perform complex tasks. Processing large volumes of data is a foundational capability in support of many analysis tools and workflows. Any improvements to existing processes and procedures, whether they are measured in time, efficiency or stability, can have significant and broad reaching impact on the intelligence community's ability to supply decision-makers and operational stakeholders with accurate and timely information.
Background and Problem Statement
Map-Reduce (MR) analytics on cloud systems are frequently scheduled to run in a periodic fashion. A typical reason for this is that the underlying data set(s) that the analytics read and process may continuously receive fresh data ingests. In such cases, the only dynamic element of the processing is the underlying data, while the analytic itself is identical across runs.
Resource allocations to process MR analytics on a system are provisioned using a combination of dynamic and pre-defined static configurations. Some pre-defined configurations are frequently defined by the analytic developer based on some trial-and-error and educated estimations of the amount of data that must typically be processed. For instance, the number of reducers a particular map-reduce job is allocated may be configured by the developer to a set number, such as 50. This choice could be based on information about how much data the reducers had to process in previous runs of the analytic and an underlying assumption that the amount of data they will have to process in the current run (over fresh data) will be similar. However, due to natural variations in the underlying data set (which may not be apparent from a simple look at the quantity of data being ingested by mappers) the current run could see the (50) reducers receiving far more (or less) data to process. This could result in a variety of negative consequences ranging from minor efficiency reduction to analytic failure.
Project Description
The Fall 2020 Senior Design team will design and build an algorithm capable of estimating the amount of data that reduce (and possibly map) elements of a single-phase MR analytic will process. The algorithm will use this estimation to reconfigure the hardware allocation requests that the analytic makes of the system. The estimation may be based on past runs, current data ingest quantities, statistical measures, or some combination of these. To achieve this, the estimation must be done immediately prior to, or during, analytic runtime. The sponsors will provide at least one possible approach to performing the estimation, but the students will be encouraged to develop any additional approaches they can come up with.
LAS will provide access to a Hadoop system, a set of reference map-reduce applications and a test data set. The team will use these, probably with additional applications and data they write, to evaluate their system and compare the performance of various estimation algorithms.
If successful, it is expected that this solution will increase the stability of both individual cloud analytics and, of course, of the cloud system as a whole. It should also see a measurable increase in overall efficiency as measured by runtime or other measures. End users who rely on the output of the cloud analytics will enjoy more consistent analysis tools. The efficiency gains could be used to either process more data, or to process the same data more often, which would give the end users more up-to-date information in their analysis tools.
Technologies and Other Constraints
In completing this project, the team will be expected to use the following technologies, possibly with some others selected during the semester.
- Git - req'd (to be provided by NCSU)
- General Cloud Computing - req'd (some amount of basic knowledge preferred as prerequisite but also ok to learn crash course to start semester)
- Hadoop MR system hosted on AWS and managed via Ambari - req'd (to be provided by LAS/NCSU)
- Apache Pig - req'd (ok to learn during semester)
- Python - preferred (flexible if other languages strongly preferred by students)
- Cloud computing, command line interface
Public distributions of research performed in conjunction with USG persons or groups are subject to pre-publication review by the USG. In the case of the LAS, typically this review process is performed with great expediency, is transparent to research partners, and is of little to no consequence to the students.
About LexisNexis
Lexis Nexis is a leading global provider of legal, regulatory and business information and analytics that help professional customers make more informed decisions, increase productivity and serve their clients better. This project involves LexisNexis InterAction, which is the industry’s leading customer relationship management solution. Our legal CRM software is designed to powerfully meet the law firm’s unique needs.
LexisNexis® InterAction® is a flexible and uniquely designed CRM platform that drives business development, marketing, and increased client satisfaction for legal and professional services firms. InterAction provides features and functionality that dramatically improve the tracking and mapping of the firm’s key relationships – who knows whom, areas of expertise, up-to-date case work and litigation – and makes this information actionable through marketing automation, opportunity management, client meeting and activity management, matter and engagement tracking, referral management, and relationship-based business development.
Background
The key to successful business development is the strength of your relationships with prospective clients and how that changes over time.
LexisNexis InterAction® has an algorithm that, on the basis of meetings, phone calls and email exchange, calculates the strength of a relationship between two individuals.
When you check on a contact, your current relationship strength is displayed; but how has that changed over time? Are my actions building that relationship or is it weakening?
Moreover, what is the overall health of all my relationships? Am I successfully nurturing new contacts, but is it at the expense of established relationships?
And what about the relationships that others have with this individual?
So that we can identify strengths, weaknesses, opportunities and risks, we need to be able to rapidly grasp the state of our relationships – between two individuals, between one person and a group, or even between all members of one company and another – and how they may have changed over time.
For This Project
The solution should aggregate and display the strength of relationships (User to Contact, User to Company, Firm to Contact, Firm to Company) in a manner that allows easy review of the current state and shows how it has changed over time using a web-based UI.
Consideration should be given for the size of different display devices, e.g. Mobile, Tablet, Screen, etc.
Support will be provided by Product Development and UX teams at LexisNexis.
Data Sources
It is proposed that the project team create their own test data set to support the different visualization scenarios.
A simple data model will be provided.
Technology
The team may choose their technology stack with any mix of Javascript, Python, and C#.
Angular 9 should be used for a web-based front end.
Ngx-charts and D3 are currently in use for other visualizations in this product, but are not mandated.
Example Scenarios
A partner at a law firm needs something to help inform him and remind him to stay engaged with an important client. It would be helpful to know what his engagement looks like throughout time. Is he maintaining engagement or does it change? When do those changes happen? What causes the increase in engagement? Do I need to reach out to this contact now?
- Simple view on a contact showing where engagement stands currently (up, down, maintain).
- Small widget view of engagement through time on contact detail
A partner has an assigned initiative to build relationships with a new client. This client has done work with the firm but in a different practice area. How can the attorney track that his engagement with this client is growing over the next 6 months.
- Small widget view of engagement through time on contact detail
- Potentially show partners engagement vs others at the firm with the contact
A law firm would like to see how their firm is maintaining engagement with one of their company clients. They would also like to see the breakdown via practice area. Are certain practice areas maintaining higher engagement with the company?
- Small widget view of engagement through time on company detail
- Larger graph of engagement through time segmented by practice area
- Highlight strongest relationships
A law firm or partner would like to see how the attorneys at the firm are maintaining engagement with a person at one of their client companies. What is the engagement like now vs. six months ago.
- Small widget view of engagement through time on person detail
- Highlight strongest relationships
- Simple view on a contact showing where general engagement stands currently (up, down, maintain).
About LexisNexis
Lexis Nexis is a leading global provider of legal, regulatory and business information and analytics that help professional customers make more informed decisions, increase productivity and serve their clients better. This project involves LexisNexis InterAction, which is the industry’s leading customer relationship management solution. Our legal CRM software is designed to powerfully meet the law firm’s unique needs.
LexisNexis® InterAction® is a flexible and uniquely designed CRM platform that drives business development, marketing, and increased client satisfaction for legal and professional services firms. InterAction provides features and functionality that dramatically improve the tracking and mapping of the firm’s key relationships – who knows whom, areas of expertise, up-to-date case work and litigation – and makes this information actionable through marketing automation, opportunity management, client meeting and activity management, matter and engagement tracking, referral management, and relationship-based business development.
Background
So, you’re in the taxi from the airport to deliver that big sales presentation to that large company you’ve been working to land for the last 6 months.
There are going to be some big names in that room. Decision makers.
Other people have been working on this account too, but who precisely… and who have they been speaking with (and what did they tell them)?
You’re also convinced that you met at least one of their team recently at an event, but there have been so many of late.
And wasn’t there something significant in the news about the company in the past week?
Of course, this information is already in your InterAction® CRM, but how to access it and review it all in the time it will take you to get to their offices?
What you need is a briefing report, delivering insights in a single page format – one page per person and one for the company – ensuring you know about all the activity that led up to this point, to provide the best customer experience.
For This Project:
There are 2 aspects to this project:
- The mechanism to trigger the creation and distribution of a report
- The generation of the report itself
Priority is given to the first of these two: the proactive identification and delivery of a report, triggered by an existing calendar entry.
You will need to:
- Identify an appointment Activity in InterAction to schedule report generation at a chosen time before the appointment
- Identify the participating Contacts
- Identify the Company
- Pass these parameters to a report generating service which should deliver an email containing either:
- A URL to the generated report
- A PDF copy of the report
- The report as the body of the email
The creation of a detailed report would be considered a stretch goal.
The starting point is an existing InterAction GraphQL API, providing access to a customer database together with activity records.
Support will be provided by Product Development and UX teams at LexisNexis.
Data Sources
Through the InterAction GraphQL API, LexisNexis provided access to a graph of relationships and the strengths of the individual relationships over time.
Technology
The team may choose their technology stack with any mix of Typescript, Python, and C#.
Angular 9 should be used for any web-based front end.
Ngx-charts and D3 are currently in use for other visualizations in this product, but are not mandated.
Examples (for guidance only):
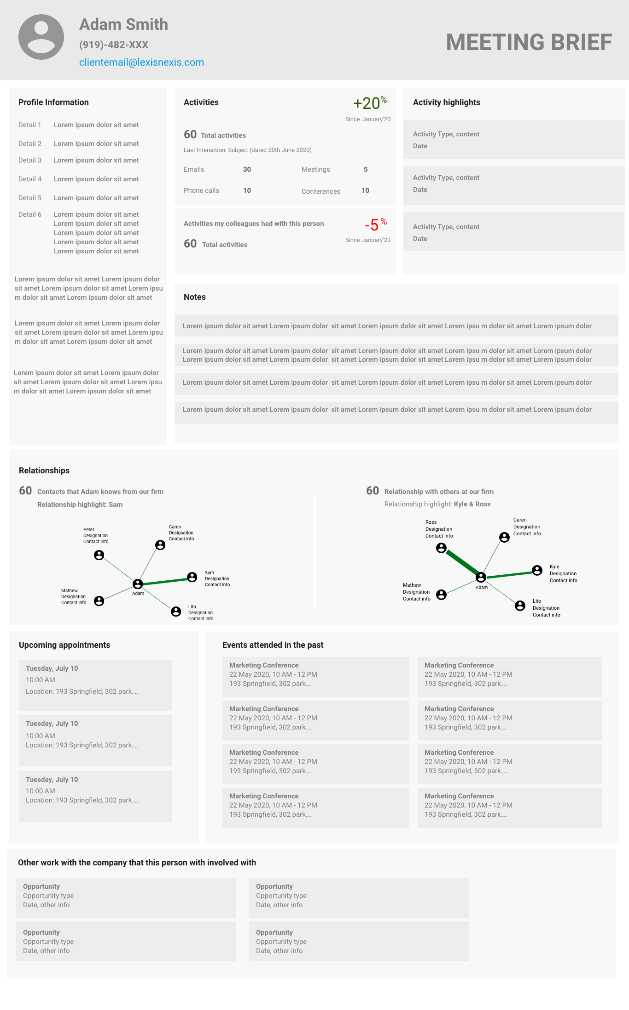
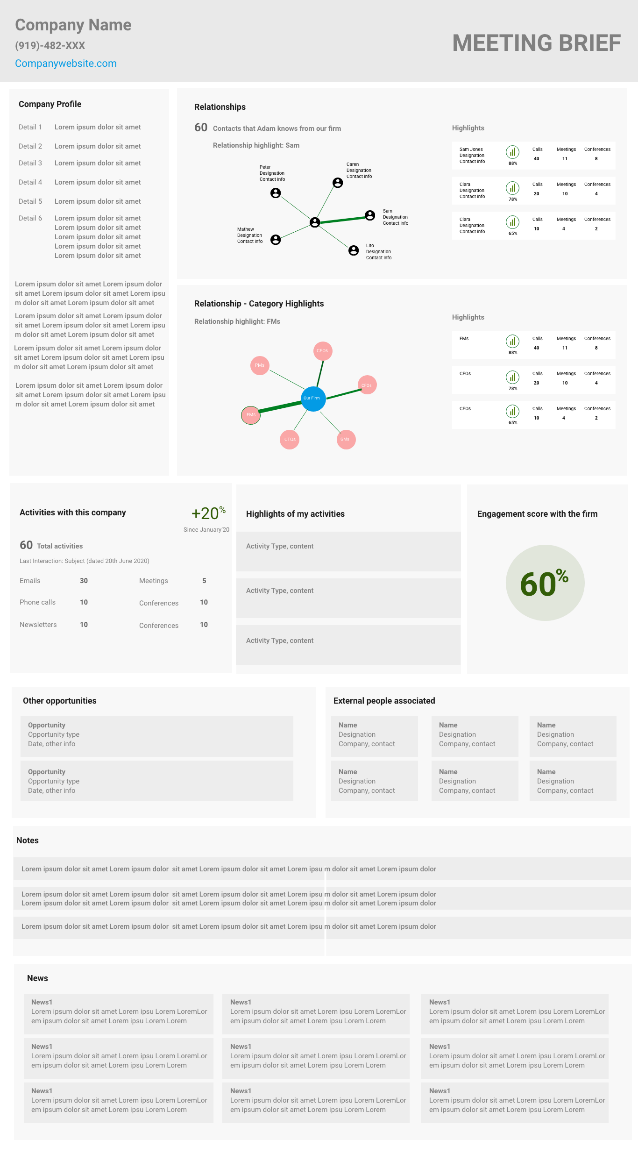
About SAS
SAS provides technology that is used around the world to transform data into intelligence. A key component of SAS technology is providing access to good, clean, curated data. The SAS Data Management business unit is responsible for helping users create standard, repeatable methods for integrating, improving, and enriching data. This project is being sponsored by the SAS Data Management business unit in order to help users better leverage their data assets.
Background and Problem Statement
With the increased importance of big data, companies are storing increasingly more data in their systems. A lot of that data goes unused because a lot of the data is unclassified. A data curator can manually inspect a small number of datasets to identify the content, such as travel information or sales records. However, manual classification becomes difficult as data sizes grow. Storage facilities for big data systems are often called data lakes. As data sizes grow, data lakes frequently become data swamps, where vast amounts of unknown, potentially interesting datasets remain untapped and unused.
Project Description
The goal for this project is to build an application for classifying data. It would be great if it was something that you put out on the open source community. The application would read in a set of data from a local machine from a directory of files; a web URI where popular data is stored such as a Kaggle dataset list, the UCI machine learning repository, or a user supplied URI to a location of data files; from a database of data such as MySQL; or by pointing to one of the cloud data systems storage like an Amazon S3 storage facility. You should then use natural language processing to pull out important and interesting information from the data and from the dataset column headers. Once you have these pieces of information, you should classify the content and generate (again using NLP) an overall business purpose for that data. Try to make the business purpose something that is understandable even by non-domain experts. Here are some examples of a good business purpose you would generate:
“RLData1 is a dataset containing real estate sales during the years 2012-2020. Most of the addresses in the dataset are in Salisbury, NC.”.
“The FertilizersProduct.csv dataset contains information on product amounts for the Production, Trade, Agriculture Use and Other Uses of chemical and mineral fertilizers products, over the time series 2002-present. The data is coming from many countries, and the most important items in the list are Ammonia and anhydrous data”.
You can template this and fill in the important values, or you can generate it using NLP and a bot.
To classify the data you should use an open source taxonomy. You will need to identify and use one or more open source taxonomies or publicly available APIs to use as the set of possible classifications. To get the data you would use a combination of NLP techniques. Named Entity Recognition to identify entities (you can use python spacey for example) and then word2vec or tf-idf or something similar to pick out important tokens. Don’t ignore column names because sometimes they have valuable clues as to what is in a dataset. Using that data, create a classifier using your taxonomy to identify the primary purpose of the data.
You should also write a UI where users can interact with your application. You can use a JavaScript library such as React to develop an application where users can provide you the location of the data they want you to classify, and you return the results in a report presented in your web application. Include some summary graphics in the results of the classified data
- a word cloud showing the most important words found in the set of data that you classified
- the number of datasets you classified
- the list of topics that you found by decreasing frequency,
- If you can provide information about when the data was last updated, include that because recently updated data is likely more important that data is really stale.
- Where the data came from. For Cloud data you can get Region information from the cloud, such as West Coast, East Coast, Eastern Europe, etc. The cloud vendors provide that information through and API. For URL see if you can get the URL location and include that.
- And any other interesting metrics you think are important
Make the report downloadable into a PDF format.
Assume that the data is structured (csv, tabular, database format) first.
There are a few additional features and capabilities that would be interesting to explore.
- An optional piece would be to come up with a method to also read unstructured data such as a directory of documents and turn them into a structure so that you can classify them. This is the format that the COVID-19 Open Research Dataset Challenge (CORD-19) is using. Could your application classify the papers contained in this dataset? (You would need to work with a subset of this data as it is quite large)
- Support a classification algorithm that works across multiple languages. You can either support different datasets in different languages or datasets that are multilingual. Can you use something like google translate to translate the content and classify it? Put it into English for your final result. Twitter is a great way to get datasets that have content in multiple languages. I can supply a dataset like this.
- Allow a user to change the classification in your application to something else. Perhaps you misclassified a dataset and they want to override your classification. It would be interesting to integrate a reinforcement learning component where the reward is the correct classification and users can provide an alternative classification that gets incorporated into your algorithm, such that it improves with use.
- Add a collaboration piece to your application so that users can talk about the data in your application results or annotate different datasets with more information. Include these annotations in the output when users choose the save a report to a file or pdf.
Objectives
This project has the following objectives:
- Build a web application for classifying data.
- Provide ways for users to point you to repositories of data in different formats and from different locations to classify. Local directories of files, web locations, Cloud locations, database tables are all places to be able to read data from.
- Identify useful taxonomies that can be used as the classification target that cover a wide variety of topic areas
- Use NLP and other Machine Learning methods to parse the content out and classify structured datasets based on open source taxonomies.
- Produce a result in your application that shows the results of the classification.
- Include some graphics in your output that summarizes the information from the set of data you classified. Some example of useful metrics are included in the description above
- Allow the user to save the results from your application to a persistent format. A PDF format would be good, but it would also be useful to be able to download the results into an excel file that they can use for further analysis.
- Allow the user to clear out the results and start over with some additional set of data
- Demonstrate your application on new sets of data. Let users point to their own set of data and see what they find.
- Optional: Provide a way for users to suggest alternative classifications on a dataset. Include these alternatives into your algorithm for continuous learning.
- Optional: Classify across multiple languages; accept datasets from other languages or that are multilingual (twitter is a good way to get multilingual data). Alternatively translate everything to English and then do the classification using a web API (like google translate for example).
- Optional: Add a collaboration piece to your application. Give users a way to annotate a resulting dataset or the entire report with their own comments. Use a rich text format method so users can add URLs., bolded data, and other nice features for their annotations.
- Optional: We are assuming this is structured data that you will be working with. Can you extend your project to support Unstructured data such as Documents and turn them into enough structure that you can classify them?
Technologies and Other Constraints
To ensure the success of the project, you should have some knowledge and background of machine learning and statistical methods. Some knowledge of natural language processing would be helpful as well. You will learn about JavaScript and writing a web application using React.
You will need some way to deliver the classification models that you will call with your web application. This could be Python, or you could deliver a docker container for one of the cloud computing vendors and interface with it through your application.
You will want to become familiar with methods for reading data from a web application in a variety of formats and from different types of data sources. For example, you can use JDBC or ODBC to get content from databases, and the Cloud vendors all provide data connectors to their data source content (Pick one cloud vendor to work with first, such as Azure or AWS). Web interface knowledge using REST interfaces is another technology you can use.
You may want to contribute your design into the open source community on Github.
You should also plan to use some open source taxonomy as the target classification. Several potential sources are suggested in the reference information below, but you do not need to limit yourself to just these and you may find others that are also useful. Try to provide a taxonomy that is sufficiently broad in order to be able to classify a wide variety of datasets.
You can get data from many places. In the references there are pointers to various places where you can get data to use and I can supply many more. Consider databases as well because many companies store a lot of content in relational databases.
Reference info, Data Sources, other examples, etc.
- SKOS a Guide to representing Structured Controlled Vocabularies in a Simple Knowledge Organization System: http://www.ala.org/alcts/resources/z687/skos
- Document Classification using Text Analysis: https://www.kdnuggets.com/2015/01/text-analysis-101-document-classification.html
- https://spacy.io/– A Multilanguage Named Entity Recognition library for Python
- Why Data Lakes Fail: https://www.arcadiadata.com/blog/the-top-six-reasons-data-lakes-have-failed-to-live-up-to-expectations/
- Why big data storage lakes fail: https://www.forbes.com/sites/danwoods/2016/08/26/why-data-lakes-are-evil/#40e379854f73
- Some possible open source taxonomies; note you may find others these are just a few options:
- US Commodity Futures Trading Commission Glossary: http://www.cftc.gov/ConsumerProtection/EducationCenter/CFTCGlossary/index.htm
- The Journal of Economic Literature taxonomy for Linked Open Data: http://zbw.eu/labs/en/project/jel-lod
- Google’s Open Source Dictionary: https://chrome.google.com/webstore/detail/google-dictionary-by-goog/mgijmajocgfcbeboacabfgobmjgjcoja?hl=en
- BERT - https://arxiv.org/abs/1810.04805
- React https://reactjs.org/tutorial/tutorial.html
- Writing Javascript web applications https://www.codecademy.com/catalog/language/javascript
- Here are some places you can go to get structured datasets that are already somewhat classified to use to build and test your algorithms:
- https://quantumstat.com/dataset/dataset.html ~200 NLP Datasets
- https://www.openml.org/search?type=data - Thousands of really useful datasets here
- https://www.iso.org/home.html - International standards
- https://ec.europa.eu/eurostat/data/database - European statistics and classifications
- Google dataset search –I have used a lot of data from this site (nice writeup - https://blog.google/products/search/discovering-millions-datasets-web/)
- Kaggle.com
- https://www.kaggle.com/allen-institute-for-ai/CORD-19-research-challenge
Project Archives
| 2026 | Spring | Fall | |
| 2025 | Spring | Fall | |
| 2024 | Spring | Fall | |
| 2023 | Spring | Fall | |
| 2022 | Spring | Fall | |
| 2021 | Spring | Fall | |
| 2020 | Spring | Fall | |
| 2019 | Spring | Fall | |
| 2018 | Spring | Fall | |
| 2017 | Spring | Fall | |
| 2016 | Spring | Fall | |
| 2015 | Spring | Fall | |
| 2014 | Spring | Fall | |
| 2013 | Spring | Fall | |
| 2012 | Spring | Fall | |
| 2011 | Spring | Fall | |
| 2010 | Spring | Fall | |
| 2009 | Spring | Fall | |
| 2008 | Spring | Fall | |
| 2007 | Spring | Fall | Summer |
| 2006 | Spring | Fall | |
| 2005 | Spring | Fall | |
| 2004 | Spring | Fall | Summer |
| 2003 | Spring | Fall | |
| 2002 | Spring | Fall | |
| 2001 | Spring | Fall |