Projects – Fall 2013
Click on a project to read its description.
Scorecard to Monitor Progress of Finance System Batch Processing
Finance Systems at Boeing Corporation consist of a host of organizations (or departments) that process financial information on a daily, weekly, monthly, and yearly basis. The closing process at the end of each month requires the involvement of many of the organizations. Some of these processes are dependent on the completion of other processes and may be organized in groups.
The Enterprise Finance Customer Scorecard is a tool that will help track the performance of the organizations involved in the processing cycles at month end by analyzing processes individually and in relation to other processes. It will be comprised of two elements: the Process Monitor Application and the Scorecard Application.
Process Monitor Application
End-of-month processes run on multiple servers and provide status information via email or by creating/updating database records. The Process Monitor Application will run continuously and will determine status of processes by handling incoming status emails or examining database records. It will process this status information and will store start and completion times in a database. Additionally, it will determine critical paths based on process dependencies and will send notification emails on these critical paths. The team will be expected to create processes that emulate Boeing’s Finance Systems so that the problem is abstracted away from the company’s internal specifics.
Scorecard Application
The Scorecard will be a web application that will display process completion times for individual processes and process groups based on the information supplied by the Process Monitor Application in a dashboard style. The Scorecard will create a “stoplight” like chart of the results allowing people to monitor the progress of batch processing. It will also allow the Scorecard administrators to manage status messages and the structure/content of the web interface.
If there is time, the team will also have the opportunity to develop the following command line tool for Boeing:
Program to Update Exchange Distribution Lists in Forest with Multiple Domains
Description: The ability to update Distribution Lists (DLs) on an Exchange server programmatically is a critical need in any organization. Using the Lightweight Directory Access Protocol (LDAP), several programs exist which can add or remove users in a DL within the same Active Directory domain. However, there is a need in larger organizations to be able to span multiple domains in an Active Directory forest to add individual accounts across multiple domains into one DL on a single domain. While this project should result in a relatively small executable program to perform the functions requested, it presents a challenge to students to set up a forest and understand problems encountered by larger organizations.
Home Control System iPad App
Duke Energy customers have traditionally needed to monitor and control many devices in the household to manage their monthly energy consumption. Devices such as thermostats, lighting, pools and appliances are typically managed individually to maintain monthly energy bills at affordable levels. This can be a tedious, time-consuming process for our customers. Even with the advent of new technology that allows customers to manage devices remotely, new challenges are being created that make it difficult to manage all these devices collectively.
Duke Energy is pursuing a new strategic direction where customers can manage their home energy usage centrally, through one device that is fully integrated with all electric components within the household. Based on primary and secondary research, we believe this will make energy efficiency more effective, sustainable and engaging.
To help realize this vision, the students will prototype an iPad application that allows our customers to control homes digitally and holistically. In addition to fully interfacing with all household energy consumers, the application should serve as a platform where the customer can be engaged in all facets of Duke Energy’s home energy program. For example, the application should allow our customers to change the temperature of their home via remote connectivity with the thermostat, accept a peak event or leverage personal storage as needed, just to name a few. However, it should also accept feedback from Duke Energy to modify temperatures automatically when energy usage across our service territory spikes. Other types of feedback should include:
- Energy conservation tips, based on time of day and historic usage
- Alerts when energy usage is outside the norm for that area
- Ability to receive system recommendations that can be easily accepted by the customer
- Impact of home solar panels on current energy usage
- Impact of changes to time of usage rates on energy bills
- The ability to sign up for new Duke Energy offers and choices
The application should provide Duke Energy with the ability to show regulators, customers, and all other stakeholders the full suite of our home energy management program. Students should be as creative as possible with the application’s presentation (graphs, images, charts, etc.), and should draw on personal experiences to help make this application effective, widely used and user friendly.
Tail
Background – A Short Introduction to Tail
With smart phones people have been able to do more while away from a traditional desktop or laptop computer. However, mobile applications are generally targeted to consumer or business groups, and are not available to meet the needs of IT professionals.
Tail is a Unix command-line utility used to read the ‘tail’ end of a file. This is tool is used to view and monitor the progress of processes that append information to files. Many people use this tool or a tool like it to monitor logging actions made by operating systems, build processes, or status logs.
Intended Audience
Tail for Android is meant to target the software developer, server administration, IT Operations Center employees that need to keep tabs on the status of systems and other processes that occur.
Software developers such as those my peers and I work with need to keep track of testing and build machine statuses across different machines and even across divisions.
Server administrators would find this application useful for easily monitoring the status of various servers. This could include information ranging from RAID failure to temperature in the server room.
IT Operations professionals could utilize the application to monitor network, machine, server, and other services to assess the current state of the environment they are tasked with monitoring.
These professionals need a clean and simple interface for their mobile device while at the same time maintaining the ability to monitor multiple files existing at various locations.
Web-Based Office Ergonomics Training, Assessments & Metrics
Project Description:
Potential clients are requesting ECNC to have a data management system that will allow us to provide web-based office ergonomics training, assessments, and metrics for their office personnel. Several competitors currently have systems available for these purposes and ECNC needs to create a similar product to stay competitive in our market. The system should also be able to facilitate the ergonomists data collection and reporting process for both internal and external use.
Project Scope:
Is:
- A web-based system for our office assessment process, capable of working in any platform/system.
- A product that includes: training, self-assessment, discomfort survey, documentation of reports and summaries, and metrics.
- A system for both internal and external use, and capable of being customized for ECNC, if modifications are needed.
Is NOT:
- For use in the industrial or lab environments.
Deliverables:
- Office awareness training (two PowerPoint presentations: one for initial training & another as refresher)
- Self-assessment questionnaire (to be incorporated into the PowerPoint initial training. Answers need to be recorded as part of the report and for metrics/dashboard.)
- E-data collection process:
- End user self-assessment inputs (within PowerPoint training. Answers need to be recorded as part of the report)
- Discomfort survey (form to be created to collect user’s data about discomfort for different body parts)
- Ergonomist’s input/observations (form to be created to collect observations and actions done by ergonomist during 1-on-1 assessment. Needs to be user-friendly for tablet use)
- Standardized/customizable reporting method (form to be created to provide end user with summary of important user information, findings, and recommendations resulting from the 1-on-1 assessment by the ergonomist.)
- Metrics reporting/dashboard format (Need to create an x-panel dashboard presenting the current status of the whole system. For example, # of employees trained, % 1-on-1’s completed, % of reports completed, % of employees with high level discomfort, etc.)
- Data mining capability (across multiple clients) for potential success stories, etc.
- System IT maintenance/support strategy (Need specific documentation of system development in order to be able to make modifications or additions in the future)
Exploration of Gadgets for Home Automation
Home automation is a term used to describe multiple things, from monitoring energy consumption to building the house of the future. In this project you will have the opportunity to obtain hands-on experience with home automation technologies.
Students working on this project will be given a set of programmable devices based on Microsoft’s .NET Micro Framework and Microsoft .NET Gadgeteer (http://www.netmf.com/gadgeteer/). These devices will be compatible with Microsoft’s Lab Of Things (http://www.lab-of-things.com), which is a research platform for wired and wireless connected devices in homes.
This project is divided into two parts: a research component and an optional free implementation component.
Research component
On the research side of this project you are tasked to explore all the hardware capabilities by building a showcase application that allows the user to manipulate features of each device (e.g., set a temperature threshold and sampling rate of the temperature sensor and display indications of measurements on the screen). Additionally, you are expected to build applications showing how multiple devices can interact with each other inside the Lab Of Things platform (e.g., use the touch screen to control the radio station, and to capture images using the camera and storing them on a USB drive when the temperature sensor reaches a certain threshold).
The expected results of this component are:
- An interactive application showcasing features of each device.
- At least three applications showing how different devices can interact with each other.
- Documentation describing not only how the applications were designed, implemented, and tested, but also all the implementation details you discovered and any issues found with the integration of the devices (and solutions to these issues, if possible).
Free implementation component
All the dedication and effort you put into the research component will surely pay off, because after completing the above requirements, and if you have enough time left in the semester, you will get the chance to apply what you have learned to create a solution of your choosing. During this part of the project you can use as many devices as you want to construct an integrated hardware and software solution inside Lab of Things. Be creative!
An App for Coaches to Train Athletes – Plan, Generate, Track
SportDrill is interested in providing support for coaches so that training athletes is easier. They envision a web application that allows coaches to plan, generate, and track athletes’ progress in their training schedules. The objective of this project is to replace paper with the creation of a user-friendly website for high school coaches.
If you choose this project you must be willing to step into the shoes of a coach to experience what goes into a successful training program. All the needed resources will be provided for your team to “think like a coach.” It will be your objective to put the steps together in such a way that the “average Joe” coach can design a workout for their athletes in a reasonable amount of time (30 minutes is a good goal).
Most high school coaches lack experience with advanced technology. Existing websites are unnecessarily complex to navigate. The primary goal of the new SportDrill website is to create a website which is intuitive for coaches to use. Navigation in the new website must be simple. This simplicity of navigation is lacking in existing websites.
When a coach starts to work with an athlete, the first step is for the coach to “plan” a training workout based on the available time and resources and enter a schedule of events into a calendar. The second step is to “generate” . . an appropriate list of exercises and drills along with performance targets. The final and most important step is for coaches to “track” the progress of althletes in their training regimen by entering actual workout performance data for an individual athlete.
Work on this website has been started, so students will have access to a database created for development and testing purposes. They will also be given access to a comparable, competitive website called TeambuildR to explore its functionality.
The existing Web app is built on ASP.NET. Students are expected to implement the new web interface using the same technology so that they can take advantage of some of the current backend implementation.
Preliminary requirements for this website are to:
- Manage 250 athletes at one time from many different sports and in smaller groups
- Include video demonstrations of at least 100 different exercises and drills
- Make it “easy” for strength coaches to generate a daily/weekly workout and put it on a monthly schedule of training with other events
- Track progress over a week, month, or year and display it visually on a chart or graph
- Allow coaches to copy successful workout programs and for athletes to view their upcoming workout programs
Further requirements details will be available at the first sponsor meeting.
If time permits, the team should also investigate the feasibility of a designing both a tablet and a smartphone companion application to facilitate mobile interactions with the SportDrill database.
Sponsor Background
Mr. Josh Allen is a former collegiate and professional baseball athlete. He is currently an entrepreneur and president of a fitness startup called SportDrill.
Mr. Chris Morland is an educator and coach who motivates performance and develops champions. Previously, he coached for 9 years for the Wolfpack as a strength and conditioning coach for Olympic Sports including 17 different men’s and women’s athletic teams. His responsibilities included pioneering a professional internship program where he recruited, trained, and scheduled young coaches to enter the coaching profession. The results of his planning, generating, and monitoring my programs has been 3 NCAA Champions and more than 60 ACC team or individual champions. Most recently he has made the transition to teaching at the high school level and has been a full-time student at Wake Tech for the last 8 months taking courses in Educational courses to get his license to teach science. He’s looking forward to entering the coaching field soon.
Personalized Interactive Video Tutor Systems
Erwin Aguayo, Inventor. Mr. Aguayo is an independent inventor who holds four US patents in wireless communications. He has a patent pending on the invention “Distributed Video Segments Microcasting” (DVSM). The next iteration of this video technology is called “Strategic Motion Video” (SMV). Previously DVSM technology advanced the state of the video editing art to a point were video could be edited on the fly through a web browser, which allows for mass customization of a video to the needs of an individual within a group. A previous senior design project report describing the functionality of the original DVSM can be found at:
http://www.csc2.ncsu.edu/sdc/students/information/resources/dvsm.pdf.
Project Description
Presently the use of training videos is limited to simply streaming a given pre-determined video on a linear basis, not on an interactive random basis. This lack of interaction inhibits the individual’s learning, severely limiting the effectiveness of the training session. The objective of this project is to solve this issue.
CSC 492 students are asked to advance the DVSM project to SMV by including real-time active interaction between the video viewer and the video in a Web environment. Real-time active interaction includes the functions associated with identifying the individual viewer’s personal characteristics, as is done by DVSM, but adds the ability to simulate a conversation between the viewer and the virtual instructor by exchanging information such as real-time video answers to specific viewer-posed questions. The system will allow for the individual to interrupt the subject matter expert’s presentation to ask questions and receive answers.
Initially, viewers could pose questions from a keyboard by simply typing the letter, “Q”, followed by the sentence in a question textbox. This question will be analyzed by the system to find and produce the appropriate video segment that answers that question. A stretch goal of the project is for the student team to investigate issues with posing questions via voice command.
After the new SMV system is created, the next goal of the project is for the student team to demonstrate the concepts of Strategic Motion Video by presenting a teaching module designed by Tim Hilliard of Trader | CEO, INC. This teaching module (called The Institutional Annihilation Method) instructs individuals who trade stocks on any of the available stock exchanges how to pick stocks.
Profile characteristics of the individual viewer of a Trader | CEO video will differ, as will their learning motivations. Students will associate specific video segments with the characteristics and motivations of the individual using the DVSM system to assemble the segments into a cohesive and effective playlist and video stream customized for the individual. Example characteristics and motivations are as follows:
Characteristics
- Never Traded
- Novice Trader
- Intermediate Trader
Motivations
- Like to learn things
- Make money on stocks
- Planning for future event, e.g., college for children, retirement, etc.
All appropriate video segments will be provided by the sponsor to the student team. In particular, the assumption is that all possible questions will have been anticipated by the originator of the teaching module and appropriate video answers pre-determined.
PAS-X Diagnostic System
Problem Definition
Werum provides a software product called PAS-X which tracks and manages the pharmaceutical production process. Supporting clients through the investigations of issues remotely is challenging particularly when people do not have the required knowledge which takes years to acquire.
Proposed Solution
Werum is interested in building a diagnostic system, based on expert system framework, to model the existing knowledge that is used by support engineers & use that knowledge to diagnose software problems when they occur.
Project approach
- Understand nature & structure of knowledge to be modeled (knowledge checklists that have been developed will be used as basis) through meetings with support consultants
- Research the Drools open source Business Logic Integration Platform
- Describe Drools system architecture and how it addresses knowledge representation (internal, as well as external – user model) and uses an inference engine (reasoning, management of facts). Using Drools as a baseline, determine if there are better open source solutions for Werum’s problem.
- Model existing knowledge to investigate PAS-X issues
- Demonstrate prototype system to facilitate investigation of PAS-X errors
Technical Details
The focus of this project is the understanding of expertise (structure, subject matter), and how that knowledge can be modeled to enable an expert system to reason about it. This is a research-oriented project. It is not intended to be a programming project. The system selected for evaluation is expected to require little programming. There may be some programming required to represent knowledge as a set of production rules, for example. The system is also expected to be a standalone system for now (no integration with PAS-X).
Implementation Requirements
The technical framework to be used is http://www.jboss.org/drools
Drools should provide an appropriate framework to model the knowledge at hand (i.e., diagnosis of PAS-X errors).
The system needs to be able to describe facts provided by operators of the system (such as error messages or observations) and handle the generation of questions to diagnose solutions, as the interaction with operators is key.
Enhanced Solution for Tomorrow’s Home with the Intelligent Multi-Service Gateway (iMG)
The Allied Telesis iMG devices provide broadband access and are deployed by a Telecom Service Provider – in their customer’s home or business. Typical services provided at this time include Video (IP TV), Voice (Voice over IP) and Broadband Data. Data services are provided within the home or business over Coax, Ethernet cables – or using an 802.11 Wireless Interface.
One of the challenges that Service Providers are now facing is how to increase their revenue per subscriber by offering additional services that they can charge for. We want to demonstrate some of the possibilities – that utilize the Allied Telesis iMG as a platform that can be used to manage the new Digital home. The resulting project delivery – should be a solution that can communicate with various devices within the home – and can be used to demonstrate the possibilities such a solution could offer. We also want to use this project as a platform for experimentation by our engineers.
Areas of consideration could be:
- Home Security & Monitoring
- Home Automation
- Tele-Health
- ...
This project requires incorporation of an open-source Home Automation framework, selected by us, into the iMG Linux based firmware base and the extension of that framework’s capabilities to meet the functional requirements. The Home automation package is written in Java – and runs on an OSGi framework.
We already have IP over Ethernet and 802.11 interfaces – Zwave and Zigbee will need to be added.
The starting point of this project will be a set of use cases – that will be used to define the devices required and the incremental feature content needed. We will provide some…but these should be seen as just a starting point – so plan to use your imagination!
By the end of the semester, a selection of these use cases will be live.
Corporate Background
Allied Telesis is a network infrastructure/telecommunications company, formerly Allied Telesyn. Headquartered in Japan, their North American headquarters are in San Jose, CA. They also have an office on Centennial Campus. Founded in 1987, the company is a global provider of secure Ethernet & IP access solutions and an industry leader in the deployment of IP triple play (voice/video & data), a networks over copper and fiber access infrastructure.
Real-Time Communication Utilizing WebRTC
Overview
Bandwidth is a leading IP-based communication services provider. We want to work with Computer Science students at our Centennial Campus office to build a new and innovative solution for real-time communication utilizing WebRTC, an emerging technology. The problem is a fundamental one - getting in touch with an individual. The solution is replacing phone numbers and other identifiers with a single URL.
Background
Individuals use traditional phones, email, Skype, Google Hangouts, Google Voice and many other means of communication. Every communication method has a unique identifier for each user. We have to keep track of the identifiers of our friends, family, and colleagues. Here is a scenario where this becomes inconvenient:
Scenario
John is trying to reach his friend Jane to have a conversation.
- John calls Jane on her phone, but she doesn’t answer.
- John checks Google Hangouts to see if Jane is available. She is not.
- John calls Jane on Skype, but she doesn’t answer.
- John remembers that Jane has a work phone, and finally reaches her through it.
Bandwidth actually powers many of these methods and sees a great opportunity in letting communicators be identified by one URL.
Enter WebRTC, a set of JavaScript APIs that enable browser-to-browser voice calling, video chat, and P2P file sharing in real-time. WebRTC was created to simplify online real-time communication. Google open sourced the project in 2011.
Your Task
You will work towards enabling users to replace their phone number(s) and potentially other communication identifiers with a single URL. This will be done in distinct phases:
- Web Application Backend
- User registration and account management
- Web Application Frontend
- WebRTC communication between clients
- Phone to WebRTC connection
- Call a normal phone from the browser
- Application Platform
- Provide these services through an API to other applications
These phases will be completed using the Scrum software development methodology, alongside other Bandwidth software engineering teams. There will be a product owner and Scrum master dedicated to this project. The team will be able to work in the Bandwidth office after our weekly standup meetings.
Design of an OpenFlow-based Replacement for Mobile IP and Similar IP Roaming Solutions
Introduction
As Internet devices become more mobile, constant connectivity is vital. Various techniques exist to ensure consistent IP connectivity mostly utilizing tunnels and/or anchor-point techniques. Such methods worthy of further study are:
- Mobile IP
- GRE
- GTP (GPRS Tunneling Protocol)
None of these are perfect, and create a number of issues:
- Traffic often flows in sub-optimal paths when no on the “home” network as it needs to return to a home device
- Tunneling adds protocol overhead which can affect performance in terms of packet overhead
- Complex roaming arrangements are required between corresponding networks with sufficient bandwidth to handle the “hair-pinning” sessions
- As IP addresses are associated with location, anomalies can occur where access to services is restricted in the “visiting” mode due to the geo-location of the IP address.
This project seeks to investigate whether new technologies such as OpenFlow, can be used to assist in providing “always on” IP connectivity as devices move between network segments.
Proposed Investigation
The proposed design uses techniques at the edge of the network to recognize “visiting” IP sessions and modify their IP parameters using flow-based recognition.
The key to the successful outcome of the project is to insert enough modifications to the flow so that traffic takes the most optimal route through the network and retains “rights” associated with the devices real IP address without using any additional components such as tunnels or labels.
For the purposes of this project, it is suggested that static IPs are allocated to the end devices. Thought should be given to how this would operate with DHCP-assigned address of local context – it may be necessary to consider a database that maps device MAC address to home subnet.
Methodologies will need to be designed and built such that “visiting” IP traffic is recognized at ingress (potentially by looking for ARP requests on the ingress switch) and OpenFlow commands built and installed quickly enough so that traffic is not affected.
The solution should be demonstrated over at least three subnets, with a number of devices roaming between the ingress devices. Egress points on the network may also need OpenFlow commands inserted to ensure consistent routing from mobile device to the public Internet.
It should be demonstrated that devices that are “visiting” still retain the ability to access content that is geo-locked to their “home” location.
Further Research
The current project should concentrate on IPv4 as it is available in OpenFlow today. However, the final design should allow for easy migration to IPv6.
It would also be worth considering an all 802.11 infrastructure using OpenFlow installed commands – reference should be made to the Stanford OpenRadio project:
Application Store for Fidelity Internal Applications & Documents
Fidelity Investments (FMR LLC) is a large mutual fund and service group. It was founded in 1946 and does business in almost every area of wealth management. Fidelity Investments is approximately 38,000 employees strong, with around 3000 of those persons working in IT.
Existing approaches to document template or application sharing involves either uploading them to sharing tools and technologies like Rabbit/ Spaces/ SharePoint or keeping them on the Network Drive location. However, this is not the most efficient way to share templates and applications. The primary goal of this project is to create an application store similar to iTunes/ Amazon market place for internal applications/ documents to share applications/ documents they have built. Other users can download it from this store, add reviews and give the rating based on their experience. This will help other employees to search or see the available information using group categories and ranking. To upload a software or document template, it will ask users to provide some key information like description, purpose, search keywords, technology used, some screenshots and contact information. The store can also provide a list of top downloads or ratings by categories. This can be built as a Web application using any Web 2.0 framework.
Database Visualizer
1. Problem
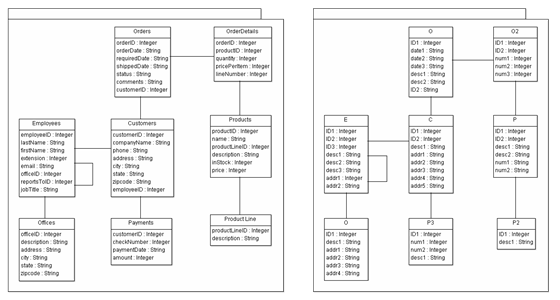
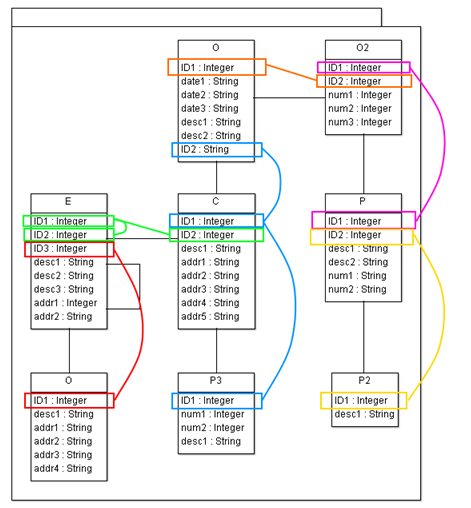
Databases contain a large variety of complex data that turns into a black box for most people. They may know that their data exists but it’s always a problem to find it. Even once it’s identified it becomes an even more difficult problem of seeing it and understanding it. Most existing database tools today allow users to view a single table as a grid. Or, for the brave few individuals, they may try their hand at actually writing a cryptic query. They’re rewarded with…. another grid. All the while they wonder about the results; what are they trying to convey or are they even what the user wanted.
Take the following two databases for example; they are structurally equivalent. However, one is self-describing and intended to be human readable. Unfortunately, many databases today are created to store model objects and end up much less intelligible. Now imagine that the user is asked to “figure out” the database on the right and retrieve information from it.
2. Overview
This project proposal is to create an application that goes beyond simple viewing; its goal is for the user to not only see their data, but understand it. Understand how the data is connected. Navigate between them. See specific instances of the data and their connections.
The application is intended to be a visual experience rather than a dull grid that can be confused with a spreadsheet application. It will have different layers of information that can be accessed by zooming and easily transitioned between by focusing on specific pieces of data.
2.1 Association View
This is a high level view that shows an overall display of how different tables are connected. Depending on the database type and definition this information could come from the schema itself which defines foreign keys or from values that match up but are not formally mapped together.
2.2 Table View
This view is as close as the application gets to an existing database tool. It is a view of a single table and its data displayed in the traditional grid format. This view should allow columns to be individually hidden and rows to be searched and filtered based on a lookup pattern.
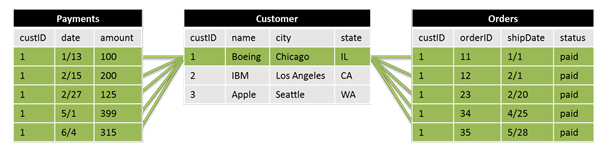
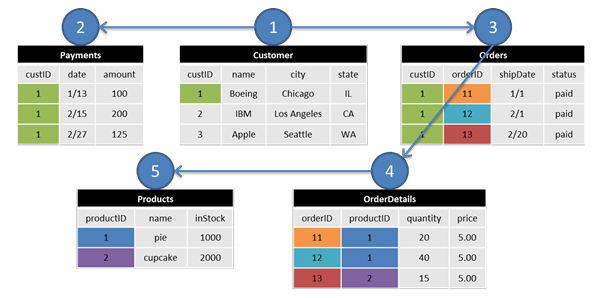
2.3 Detail View
This view is focused on one or more specific rows in a table and follows the table’s connections out to related rows in other tables. Once an individual piece of data is identified within a table the view can be expanded to other connected tables and highlight the related information. The connections spread out like a spider web to an adjustable number of levels out from the source. This view is intended to be a way to navigate from point to point in the same way that one might navigate bus or train routes in a big city. For instance, after arriving at station 1 there are several routes that can be followed to other transfer stations 2, 3, & 4.
This view additionally functions as a way to visually building up a query. As the user picks an initial piece of data and spreads out to another table, they can select an additional column and follow its connections to further tables. Once there, the related rows are shown and highlighted.
3. Technical Expectations
3.1 Application
The goal of the project is to develop an application for a Windows-based desktop PC. Any programming language, framework, or libraries may be used as long as they provide sufficient user interface, interaction, and visual capabilities.
3.2 Database
The application should support at minimum a MySQL database and be easily extendible others like Oracle as well.
3.3 Architecture & Design
The concepts outlined in this document are applied to relational databases. However, one could imagine extending this to other more general types of data that have relationships. In theory, the visual display and user interaction could be applied to viewing and understanding code within a library. Instead of tables, rows, and columns it could display connections between classes, functions, and variables.
Create a Software Version Management System for Snap Creator
Abstract
Snap Creator is NetApp's strategic direction for providing application-consistent backups with a uniform presentation layer to both users and providers of private cloud environments. Snap Creator allows you to create your own custom backup, restore, and cloning solutions for enterprise applications through Snap Creator plug-ins using NetApp storage technologies. Snap Creator is developed using an agile, community-based model, which offers the opportunity to collaborate on code with others within and outside NetApp who share the same passion.
The project team will enhance the Snap Creator solution with a version management system, which should be extensible by the Snap Creator team into a centralized software distribution facility.
Benefits
NetApp's Snap Creator product is a 3-tier (UI/server/agent), pluggable framework for performing application-consistent backup/recovery operations in large (i.e. cloud) environments. Various components (server, agent, plug-ins) may all have different versions, and a means is needed to ensure all components installed in an environment are compatible with each other and fully up-to-date.
This project has several components, suitable for dividing among a student design team:
- Define & implement version APIs in Snap Creator plug-ins, agent & server.
- Enhance the Snap Creator server's agent monitoring facility to gather agent & plug-in versions.
- Design a versioning schema for defining component version compatibility.
- Define & implement a simple RESTful web services interface in an Internet-accessible VM (provided by NetApp) that the Snap Creator server can contact.
- Enhance the SC server to call the new REST interface, and enhance the agent monitoring UI to report versions of all components and flag those which are downlevel or otherwise incompatible.
Resources Needed
Each team member will need a laptop and should be comfortable programming in Java. Storage and application environments will be provided by the Snap Creator team.
Bronto Fiddler
Bronto offers a powerful online marketing platform, with numerous features that permit corporate clients to design and execute new marketing campaigns and to analyze the effectiveness of existing campaigns. The fall 2013 Senior Design team will design and implement the Bronto Fiddler, a new component for customizing access to these features for each individual Bronto customer.
The Fiddler will offer a collection of feature toggles, feature sliders or other controls and maintain their state for each Bronto customer. These controls will determine whether the Bronto application activates a specific feature and may even let new features be activated gradually for selected customers. As the project moves forward, the team may identify more mechanisms for gradually enabling new features (e.g., randomly selected, alphabetically, based on data size).
The team will create Fiddler using Java, REST web services, and the ZooKeeper coordination service. To make bootstrapping your REST service easier, you'll get to work with our Bronto service wrapper. To make talking to ZooKeeper easier, you’ll get to use the Bronto ZooKeeper client library (based on Netflix's Curator). You'll get a lot of experience with writing good Java services and using ZooKeeper in a highly scalable environment.
Company Background
Bronto Software provides a cloud-based marketing platform for retailers to drive revenue through their email, mobile and social campaigns. The platform is used by over 1000 organizations worldwide, including Armani Exchange, Timex, Samsonite and Gander Mountain. Bronto is listed as the leading self-service email-marketing provider to the Internet Retailer Top 1000.
Bronto is frequently recognized for business leadership, as well as within the areas of marketing technology and customer service. Recent awards include:
- Seven-time Finalist, Stevie Award for Best Customer Service Department (2008-2013) and four-time winner (2009, 2010, 2012, 2013)
- CODIE Finalist for Best Marketing Software in 2011 and 2012
- Inc. Magazine’s Top 5000 Fastest Growing Companies, 2009-2012
- Best Place to Work by Triangle Business Journal in 2010, 2011 and 2012
- N.C. Technology Association Award for Software Company of the Year 2011
Bronto has experienced impressive growth in customers, employees and revenue. We believe there are two main reasons for this – one is that we fill an important need within the multichannel commerce market. The second is that transparency, approachability, award-winning customer service and a passion for marketing are built into Bronto's DNA and this way of doing business is shared by customers, employees and partners.
In 2002, Bronto was co-founded by Joe Colopy and Chaz Felix out of Joe's house in Durham, North Carolina. Since its humble beginnings, Bronto has emerged as a leader with a robust yet intuitive marketing platform for commerce-driven marketers.
Visualization of Big Data Sets
Global organizations deal with tremendous volumes of data every day. Many applications, tools, and reports try to make sense of the data for many different purposes. There are different analytical, regulatory, infrastructure, and financial needs that this data can provide that are of use to the bank. There is also the possibility of examining the data in different ways or combined with other data to see hidden patterns and connections.
Deutsche Bank and Data
Deutsche Bank has many transactions and data volumes globally. We currently use multiple traditional tools to report on this data but it is missing relationships and a graphical impact. Chief among them is a need to view these big data sets as a cognitive process. People need to interact and view this data; graphs and charts are typical but not a natural or elegant way to understand a sea of information. This visualization would be available to the different trade, finance, and information teams on multiple platforms to help facilitate their use and increase their understanding. The ability to correlate, view, and analyze these different data points quickly and clearly could lead to increased efficiencies, undiscovered opportunities, and better options for our customers.
This Semester’s Assignment
We are looking for a group of dynamic students who can help design and develop a web application that provides a user-centric view into the different data sets the bank uses, and to display this information in a rich and engaging way. The visualizations can then be used to demonstrate, present, and inform products, teams, or organizations what the data is trying to tell them. Deutsche Bank can provide a representative data set(s) and knowledge of bank practices, but we need your ideas and technical expertise to create a dynamic solution.
NCSU Student Experience
Senior Design students in the College of Engineering, Department of Computer Science will have the opportunity to collaborate with experts in the area of graphic/industrial design and to partner together over the course of the semester to develop a data visualization solution, as they would experience in real world product development. Additionally, top industry professionals will assist in the design principles, Agile/Scrum practices, overall developing/coding and testing.
WCF Mapping Tool
Project Description
Fujitsu America is one of the top three suppliers of retail systems and services worldwide. Using Microsoft’s .NET development platform, these systems offer a high performance yet open platform that retailers as diverse as Nordstrom and Payless Shoesource are able to customize.
Customizing these systems requires mapping between the business process and technologies of a client and the business objects defined within the Fujitsu Retail Suite (FRS). For example, a particular client may maintain pricing information in an Oracle database. In the FRS, this database might be used to create Price Lookup Records that are fed to the Fujitsu middleware tool, StoreCENTER. From there, pricing information can be delivered to the client’s stores. Of course, the FRS supports many types of business objects, and StoreCENTER will normally be fed from many different data sources.
In the spring of 2013, an NCSU Senior Design team developed a prototype C# tool to help automate the mapping from customer data sources to StoreCENTER business objects. The Fall 2013 team will generalize and extend this tool, redesigning and replacing components where necessary. In its current form, the prototype assumes customer data fields map one-to-one to fields and field types in StoreCENTER. The tool permits the user to select fields from a source file/database, connect them to corresponding fields in a target StoreCENTER Schema, and create a mapping file that records these connections. Once the mapping is completed, data can be “translated,” which consists of selecting a customer input source (a CSV file or a SQL Database) and a mapping file, resulting in a data push into StoreCENTER via the WCF service.
In practice, mapping customer data to StoreCENTER often requires more sophisticated techniques. Data may not map one-to-one, and the types may not match. The Fall 2013 Senior Design team will extend the existing tool with a flexible mechanism for specifying how fields are to be processed before being pushed to StoreCenter. This would include, for example, support for field transformations (e.g., from character to integer) or rules for generating missing data. The tool should be extensible; as new custom solutions are developed to solve mapping problems, it should be easy to hook these into the tool so they are available for future mapping problems. Individual mapping rules should be customizable, supporting parameters for how customer data should be processed, how missing data should be generated or how multiple customer data sources should be combined. These extensions will offer the team numerous design challenges and opportunities for creativity as well as exposure to relevant technologies.
Accessible Online Quizzes for All Students
Homework assignments and quizzes are important parts of education. They let students practice and internalize the material, and they give both student and instructor vital feedback on how much learning has occurred.
Unfortunately, students with disabilities can face a challenge. If the instructor is not good at preparing accessible work, a student with disabilities may not get the same education. Tablet computers like the iPad offer built-in accessibility features, but these features need readily available tools to make them useful for teaching and learning.
Your group will help solve this problem. Working with accessibility specialists at SAS, the Senior Design team will design and implement an application for creating accessible, electronic quizzes, along with supporting software for distributing the quizzes, administering them on a tablet device, and returning the results to the instructor. It is important that same software and processes works for all students, disabled or not. Support for automatically scoring submissions is desirable, but not essential.
The Senior Design team will be supported by a SAS team that includes software accessibility experts (one of whom is visually impaired), user experience designers, a teacher of visually impaired students, and a seeing-eye dog! You will get a chance to conduct some usability tests at the Governor Morehead School for the Blind, located just on the other side of Pullen Park from the main NC State University campus. For more information about some of the experts you’ll be working with, see:
- A short biography on the National Federation of the Blind website
- An interview on WRAL
- Unlocking the Power of the iPad for the Blind news report on BloombergTV
Immediate Feedback In Lecture Assignments
Project Overview
WebAssign’s vision is to, in part, “serve the human role in education by supporting the relationship between instructor and student.” With this in mind, we would like to create a new interaction allowing instructors to gauge and react to student responses in real-time, during lectures. This technology would allow an instructor to create an exercise such as a series of multiple choice questions that is shared with students during class. As students complete the exercise using their laptops and mobile devices, their answers are automatically aggregated and displayed as a simple bar graph for the instructor to review or even share with the class. Providing immediate feedback in lectures, with students participating in real-time, will enable instructors to respond instantly and adapt instruction effectively to the needs of their students.
Target Audience
- Instructors who desire more fine-grained feedback on student learning during lecture. Students who want to gauge their own understanding of lecture material and provide feedback that will improve lecture effectiveness for themselves and their peers.
Requirements
Student View
- Allow for anonymous login via an instructor-provided means (e.g. URL)
- Track a single answer per student
- Advance through a series of questions under the instructor’s control
- Display on iOS and Android default browsers, as well as modern desktop browsers
Instructor View
- Ability to generate a URL (or other method) for students to join the interactive session
- Ability to show and hide aggregated student responses
- Ability to control navigation to next question
Stretch Goals
- Dual-view for instructor (a control panel/navigation view, and a display-view for presenting)
- Ability to reissue a question without having to display responses to the audience
Your Task
You will be provided with a working API that returns static content in order to simulate our application’s services. You will solve the technical problems associated with the described feature set and implement each feature using the API where applicable. Your code should be extensible, maintainable, and well documented. Your deliverables should include tests using Mocha for unit testing and Cucumber for functional testing. WebAssign adheres to Agile principles of development, using Agile roles, artifacts and ceremonies. We recommend using an iterative Agile development style in order to ensure you meet the project goals.
Skills
The team will be working with the following technologies and tools:
- Node.js
- Mongo
- Redis
- Bootstrap
- Backbone
- Mocha
- Cucumber
We expect team members to have the following:
- Familiarity with Web Development Principles
- Competence with Javascript
- Understanding of unit testing strategies
Team members with the following would be especially well suited to this project:
- Web Application Development experience
- NoSQL datastore experience
- Familiarity with Node.js promises
- Familiarity with functional testing
Inspiration
The following links demonstrate various components of a shared interactive session that you may find useful when considering UI/UX decisions:
Here is a link to a description of how the described feature might be used by instructors:
Project Archives
| 2026 | Spring | Fall | |
| 2025 | Spring | Fall | |
| 2024 | Spring | Fall | |
| 2023 | Spring | Fall | |
| 2022 | Spring | Fall | |
| 2021 | Spring | Fall | |
| 2020 | Spring | Fall | |
| 2019 | Spring | Fall | |
| 2018 | Spring | Fall | |
| 2017 | Spring | Fall | |
| 2016 | Spring | Fall | |
| 2015 | Spring | Fall | |
| 2014 | Spring | Fall | |
| 2013 | Spring | Fall | |
| 2012 | Spring | Fall | |
| 2011 | Spring | Fall | |
| 2010 | Spring | Fall | |
| 2009 | Spring | Fall | |
| 2008 | Spring | Fall | |
| 2007 | Spring | Fall | Summer |
| 2006 | Spring | Fall | |
| 2005 | Spring | Fall | |
| 2004 | Spring | Fall | Summer |
| 2003 | Spring | Fall | |
| 2002 | Spring | Fall | |
| 2001 | Spring | Fall |