Projects – Spring 2015
Click on a project to read its description.
Monitoring the Power Grid – using the deployed Home Gateways
The Allied Telesis iMG family of devices provide broadband access and are deployed by a Telecom Service Provider – in their customer's home or business. Typical services provided at this time include Video (IP TV), Voice (Voice over IP), and Broadband Data. Data services are provided within the home or business over Coax, Ethernet cables – or using an 802.11 Wireless Interface.
One of the requirements for these gateways is to survive power outages for up to 8 hours. Several of our Telcom Service Provider customers also provide power in their service regions and have an interest in being able to map power outages in order to better respond to them. Deployed gateways are probably their most commonly deployed managed device – so receiving reports from these devices when power is removed – or restored – can be valuable in understanding the geographic scope of an outage.
We would like to create an application running on CentOS Linux that provides just this capability. The actual Language and toolset for the application is not specified – however the choice should be made with agreement from the sponsor.
At its very basic level the application shall receive SNMP Trap notifications of power outage or recovery from an outage, from the gateways deployed in the network. The application should also handle queries for any additional information required from that device or other external databases. This should include, but is not limited to:
- Device Address
- Name of user/business
- number
The application should provide a visual indication of the incidence by overlaying the location of that incidence on a map (e.g., GoogleMaps) by selecting a mapping API with sponsor approval.
Display of additional items/icons to provide additional context for the user should be possible based on extraction of information from at least one additional database to be provided by the sponsor.
Further extensions of the application to provide a level of analytics on the user interface may be considered. Possible options include 1) qualifying magnitude of an outage, 2) grouping device outage notifications into one issue for display and management (via coloring, etc.), and 3) transmission of alerts if an outage group reaches a certain threshold should be considered.
The starting point of this project will be a set of use cases. We will provide some…but these should be seen as just a starting point – so plan to use your imagination!
Initial development will be done with several sample devices – larger scale testing/feature validation will need to be done with some form of emulation.
By the end of the semester a subset of these use cases will be live.
As a stretch objective - Creation of Android app to provide a view into the state of the network could be considered.
Corporate Background
Allied Telesis is a network infrastructure/telecommunications company, formerly Allied Telesyn. Headquartered in Japan, their North American headquarters are in San Jose, CA. They also have an office on Centennial Campus. Founded in 1987, the company is a global provider of secure Ethernet & IP access solutions and an industry leader in the deployment of IP triple play (voice/video & data), a networks over copper and fiber access infrastructure.
Service Maker
At Bandwidth, we utilize an ever-increasing number of cloud-based resources for our software development efforts. These resources, such as virtual machines and storage buckets, enable our software developers to quickly setup the infrastructure they need for development and testing, allowing them to focus more of their time on writing great software.
As our use of these resources has grown, though, so have our related expenses. Lately, our monthly costs for these cloud-based resources have grown to four times our budget. Further, the tools at our disposal do not give us a means to know which resources are being utilized by which developer and for which purpose. This makes it extremely difficult for us to determine whether the money we’re spending is being well spent. We need a solution to facilitate tracking these resources and optimizing their expense to ensure we aren’t wasting money.
The Service Maker is to be a web service for provisioning cloud-based resources in Amazon Web Services. It will provide a RESTful API and a web portal interface for creating and destroying these resources, tracking which resources are created by which user and for which business purpose, and making it easy to identify resources which are no longer needed. It will also make intelligent decisions about how to setup these resources in the most cost effective manner, and make recommendations on which resources are being under-utilized and are therefore candidates for downsizing.
Students working on this project will work primarily in Javascript, utilizing Node.js as the server-side platform and Angular.js on the client side. They will also make extensive use of Amazon Web Services, becoming deeply familiar with the different resource types in AWS and the APIs exposed by AWS for managing those resources.
Students will also work closely with Bandwidth engineers in executing this project. We will collaborate utilizing industry-leading agile processes, giving you a real-world experience that goes well beyond the code that you’re writing. Bandwidth headquarters are located on Centennial Campus, making it easy for us to meet weekly to iterate on designs and code and to ensure we’re building a great product. In the process, we’re sure to have a lot of fun together.
Bandwidth is an innovative provider of next generation communication services that are helping change the way that people across the world communicate. We’re the Voice Over IP platform behind services like Skype and Google Voice. We also built and operate the Republic Wireless mobile phone service, which is disrupting the mobile phone industry with its wifi-first approach to mobile communications. We’re a software company that is revolutionizing the telecommunications industry by powering the companies who change the way we communicate.
Configuration Toolkit
Summary Description
One of our major International applications within Finance Systems is called Boeing International Business Systems (BIBS). The BIBS application is based on the Oracle E-Business Suite which is a delivered commercial off the shelf (COTS) application from Oracle. It is built on an Oracle database and the user interacts with the application through Oracle Forms and a web interface.
Boeing has offices in over 70 countries. The BIBS application has been deployed in ~20 countries so far and will be rolled out to the remaining countries in phases. The application has to be configured for each new country that is brought onto the application. The configuration involves manually going into the application and populating data on a large number of web pages. It is a time consuming process that has to be repeated for each country as they are deployed (since each country has their own localizations and regulations). This configuration has to be manually applied to the production environment as well as all of the development and test environments.
Examples of configuration include: Setting up a Business Unit, defining the processing that will be done on that Business Unit, defining default values, the allocation structure, vendor information, etc. There is a standard set of configuration items that have to be defined for each country and we will provide that at the start of the project.
The objective of this project will be to develop a toolkit that will help automate the configuration setup and provide a more user-friendly method to enter the information. This will help with the setup of the remaining 50+ countries to be brought onto the system, as well as help manage changes to the existing setup if changes have to be applied.
The toolkit will involve web development to build a web page (or series of web pages) with a more streamlined setup than exists in the application. The preferred technology would be utilizing .Net for the web page development.
This project will not require an understanding of the different requirements for each country. We will provide the configuration document that lists all of the configuration items. The team will build a questionnaire in the form of one or more web page(s) and interfaces based on the requirements we will provide at the start of the project.
Once the toolkit has the gathered information, it would connect to the BIBS application and populate the configuration. As an example, think of how Turbo Tax provides a more user friendly set of questions and input screens and then populates the more cumbersome underlying tax forms. In a similar fashion, this toolkit will provide a user friendly interface and an interface to populate the underlying configuration items. Note that for the purposes of this project, the team will not be populating the application tables with configuration. They will be creating their own tables so there is no need for them to have an understanding of the Oracle E-Business application.
Consumer Electronic Show Sentiment Analysis
Summary
Why, oh why, did you say that…about that product…at that venue…at that time of the day!?!? The goal of this project will be to better understand and improve sentiment, using Data Mining Techniques, towards Cisco Systems at the 2015 Consumer Electronic Show occurring on January 6th-9th, in Las Vegas, Nevada.
Background
The Consumer Electronic Show is the world’s largest technology conference that brings over 150,000 attendees from around the globe encompassing numerous industries.
Problem Statement
In order to take full advantage of CES, Cisco must use feedback from past conferences to better tailor their presentations, products, speakers, and advertising to the attendees at CES. In 2014 alone, there were over 6,500 media affiliates who were covering the conference. These journalists were reaching mass audiences through the use of blogs, news articles, and various social media platforms. To improve Cisco’s presence at the conference, students will data mine twitter to rate the sentiment towards Cisco’s topics/trends/products/speakers at the 2015 Consumer Electronic Showcase.
Project Details
- Students will need to use the Twitter AP; see:
https://dev.twitter.com/overview/api/twitter-libraries - The students should become familiar with Data Mining /Text Analytics /Sentiment Scoring / Data Visualization and Data Mining using Twitter
- The students will retrieve and analyze tweets while the event occurred, 1 week after the event ended, and 1 month after the event ended.
- The students will rate the sentiment during the event towards: products/ topics/ entities/ speakers/ Cisco/ venues/ keywords/ etc.;
- At the end of the semester, the students will deliver an analysis on their findings and make recommendations.
Efficient Random Writes
Background
DataDomain is the brand name of a line of disk backup products from EMC that provide fast, reliable, and space-efficient online backup of files, file systems, and databases ranging in size up to terabytes of data. These products provide network-based access for saving, replicating, and restoring data via a variety of network protocols (CIFS, NFS, OST). Using advanced compression and data de-duplication technology, gigabytes of data can be backed up to disk in just a few minutes and reduced in size by a factor of ten to thirty or more.
Our RTP Software Development Center develops a wide range of software for performing backups to and restoring data from DataDomain systems, including the libraries used by application software to perform complete, partial, and incremental backups and restores. As DataDomain makes its way into even more datacenters, the need to accommodate additional workloads is increased. Customers must be able to back up their data efficiently to meet constantly decreasing backup time periods.
One of these additional workloads to be considered is "random writes". With random writes, the backup application can write data to any file offset at any time during a backup. Our current backup library Application Programming Interfaces (APIs) perform de-duplication and compression of user data only when files are written sequentially, starting at file offset 0. If the application performs writes to random or otherwise non-sequential file offsets, the APIs no longer perform the distributed segment processing (DSP) that provides de-duplication and compression.
The project will provide the capability for write operations to any file offset in a manner that can still provide DSP and the de-duplication and compression capabilities of the existing. Students will devise and implement a method of efficiently backing up files even when the file data is written using write operations to random, non-sequential offsets in the file. This will be done by using the existing EMC provided APIs that perform DSP for sequential write operations. The purpose of the prototype is to serve as a demonstration of how random writes might be done without requiring any changes in the backup application software or to the DataDomain system. Additionally how the students’ random write solution compares with existing random writes as implemented in our current library, in terms of time spent / space used / bandwidth consumed will be determined.
Project Scope
We want to develop a simple prototype library that will act as a shim layer between the existing EMC library and a backup application. This extra layer will implement the same interface to the backup application as the current library does. But the shim layer will provide additional feature of efficient writes to any file offset while maintaining the DSP capability with full de-duplication and compression.
Students will be provided with documentation for the existing EMC C library as well as the library (in binary form). The library will be provided as a dynamically linked Linux library file (a Linux .so object). The library APIs are very NFS-like and provide functions such as file open, read, write and close. The shim layer created for the project will be written in C on Linux and make calls to the provided library functions. A simple application to write files using the shim layer will also be written in C and make calls to the shim layer and the provided library functions as necessary. Sample code illustrating use of the library APIs will be provided as a starting point.
Fidelity PI Architecture – Visualize Business Process Key Performance Indicators and Business continuity Risk mitigation with Containerization
Fidelity Personal Investing’s (PI) Architecture team is responsible for the evolution and adoption of innovative approaches and technologies. Ultimately, this team seeks to deliver the best customer experience in the financial industry.
The team has started to align with the Enterprise Compute Strategy. The compute strategy is a corporate effort to define and implement an enterprise standard cloud environment. The primary goals are to manage costs, decrease time to market and increase developer productivity. Going forward, all applications should be cloud ready and built using standard components that are provided in one of the enterprise environments.
This proposal is requesting the visualization of Business Process Key Performance Indicators (KPIs). Fidelity’s architecture seeks to digitally instantiate the fundamental behaviors of a business. A business delivers services to its customers; it makes decisions, and orchestrates its processes to deliver a differentiated customer experience. This business context framework has the following component parts:
- Services: Services offered to our customers must be instantiated to deliver positive end results
- Decisions: We make policy and regulatory decisions in the delivery of those services
- Processes: We orchestrate the work necessary to meet desired customer outcomes, policies, and regulatory requirements
- Customer Experience: We continually innovate to reach, and enable our customers to interaction with their financial present and future
Process orchestration is one of the behaviors of the business. Monitoring these processes provides critical visibility into our operations. The basic process monitoring KPIs we would like tracked are the following:
- Work initiated
- Work complete
- Cost
- Task execution time
- Labor cost
- Resource cost
- Rework
- Total time
- Wait time
Patrick Steiner, Redhat Architect, has contributed Container images of the Red Hat JBoss Business Process Management (BPM )Suite in Docker (https://github.com/PatrickSteiner/BPM_FSW_Docker). Containerization is an isolation concept and technology that isolates one process from another. Virtual machines are the most common isolation technology. The term containerization, however, finds its genesis through the Docker technology. Unlike Virtual Machines, Docker containers house the application and its dependencies, no Guest Operating System.
The sample insurance business process will provide the context for the set of KPIs to monitor. The KPI visualization should be rendered in a web-based UI leveraging AngularJS. Fidelity leverages a headless process model to support human interactions across our channels. For instance, a loan approval process is accessible from the loan officer’s desk, or their mobile phone. In other words, the business process is not responsible for performing the human interaction; it’s the presentation service accessing the process.
The following are the broad requirements for the project:
Setup the JBoss BPM Suite within Docker
- Use Patrick Steiner’s enclosed link to download and install the images (videos are at the bottom of the page)
- Explore the sample insurance process within the image
Enhance the process to track the KPIs
- Modify the given process by adding tasks to measure the process instance
- Store the KPIs information for reporting
- Note: You will need to generate enough data to visualize the KPIs
Presentation Services
- Replace the current inbox (task) presentation of the business process with a new AngularJS based front end
- Build a Business Monitoring page to visualize the insurance KPIs in creative ways leveraging an AngularJS front end.
- D3 is interesting http://d3js.org/
- Info on AngularJS: https://thinkster.io/angulartutorial/a-better-way-to-learn-angularjs/
Research phase: Does containerization, finally, solve the business continuity risk of shared compute resources?
- How is the container (Docker) technology being leveraged with JBOSS BPM?
- Can an instance of the process be launched in its own container?
- Are the process instances truly isolated from each other?
- Are compute resources (CPU, Memory) being consumed at the same level as Virtual Machine containers?
Device-Adaptive, API-Based Reporting & Infographics Framework
Background
One of the challenges in business intelligence and big data is visualizing the data, and getting that visualization to the right users in an easy-to-use way, regardless of their device. Today, most application developers are responsible for bringing together custom graphics, chart widgets, and responsive design techniques themselves. Developers need a consistent way to define adaptive reports across lines of business, so that the next generation of business intelligence can be more accessible and drive better decision-making.
Project Requirements
The project is to design and build the first release version of a framework that can run in any modern browser, on any modern device, that can take a report definition and adaptively render that report by balancing the intent of the report designer with the constraints of the device display. A second deliverable is a web-based interface for setting up a report definition and previewing the output. The framework will support basic common chart types like bar, pie, line, and an extensibility model so more types can be added in the future.
Involved in the project is defining a schema for a report definition that allows specifying data source, parameters, chart objects, and the spatial relationships between the chart objects to allow the rendering to adapt to the device.
The project team will be provided with capability requirements, technical requirements, and mockups. Use of open source libraries is encouraged. The completed solution will be in HTML, JavaScript and CSS.
Inspirations:
Versa Business Rule Management for Third Party Data Processing
Overview
Versa product is used by government agencies to issue licenses to entities. An entity could be an individual or a business. State agencies may require entities to pass a qualifying exam(s) to issue certain type of licenses. The entities take exam(s) in 3rd party test centers. Periodically, the state agencies collect exam data from the 3rd party agencies and imports the data into Versa system. The rules to process exam data varies between state agencies, license types, and exam types.
Inefficiencies
Code implementation may be required whenever one of the following events happen -
- A new government agency wanted to use Versa Product.
- New exam is added or an existing exam is removed/changed – global level.
- Exams are added/removed as a requirement for a license type – license level.
- A new license type is added which requires entities to take exam.
- The rules of processing exam data is changed.
The government agencies do not have flexibility to make changes to business rules without requesting for code implementations/changes. Cost of implementation and maintenance of the 3rd party data processing code is high. Also, government agencies incurs delay due to additional work involved in development and testing of the software based on new business rules.
Solution
To reduce the inefficiencies, the following architecture and design is proposed as a solution.
- Implement Business Requirement Management System to decouple business logic from software development team. BRMS system integrates with Versa system of Iron Data to process the rules. Business rules are built using combination of some of the techniques like plain English, flows, decision tables so that non-technical staff can put them together to meet business requirements.
- Each business rule will be small so that it can be easily reused to meet the needs of new business requirements.
- DROOLS will be used to implement Business Requirement Management System.
- Rules, flows, and decision tables will be implemented using Drools.
- The DROOLS framework will be integrated with Versa web application implemented using Java and Spring framework. The web application is targeted to be deployed on JBoss server.
- The drools processing at a very high level is shown below.
Please Only Select This Project if You Are a Member of the Oracle Preformed Team
Extend DVAT with Web GUI Test Capabilities
Background
The Oracle Communications Business Unit (CGBU) delivers a powerful combination of technology and comprehensive, integrated business applications for enterprises and service providers. Oracle Communications builds several products on a platform stack consisting of a customized Oracle Linux OS, a proprietary database system and several GUI interfaces. As the core of many products, this software stack is held to the highest standards of quality and is subject to rigorous testing procedures.
Oracle's CGBU Platform Design Verification group is responsible for this testing, and has developed the Design Verification Automation Tool (DVAT) to assist with the verification process. The DVAT executes automated test plans, collects pass/fail results, and reports these results back to the user. Previous senior design efforts with NCSU students have positively impacted the DVAT. These efforts resulted in two prototype features and one feature that was integrated into the production DVAT. This semester, Oracle Communications would like to further build on this success by extending testing capabilities to support web GUI testing on platform components.
Problem
Today, testers are able to interact with systems under test using SSH, SOAP, and SQL protocols. Many of our platform components also provide a web interface and some platform functionality is only available through the web interface. It would be beneficial to extend DVAT's existing protocol testing capabilities to include web GUI testing.
Project
Oracle's Spring 2015 senior design group will extend DVAT's capabilities with:
- Browser emulation that supports session cookies and a JavaScript implementation
- New actions via the browser:
- Get an HTTP page
- Click action for specified DOM elements as well as JavaScript alerts, confirms, and prompts
- Type action for specified DOM elements as well as JavaScript alerts, confirms, and prompts
- New assertions via the browser including:
- Assert page loaded
- Assert existence and content of DOM elements
- Assert URL content
- Assert the existence and content of JavaScript alerts, confirms, and prompts
Implementation
The team must:
- Gather requirements for resolving the above problem
- Select candidate technologies and review with the DVAT development team
- Update interface documentation and review with the DVAT development team
- Implement the design and review with the DVAT development team
- Participate in Oracle's code review process for all deliverables
The final solution must be:
- Compatible with existing server HTTP actions and assertions
- Extendible to support specific browser implementations required by our products including Internet Explorer 10 and Firefox 34
- Consistent with existing test actions and assertions
Implementation technologies include PHP, Doctrine, Bootstrap, and CoffeeScript on a Fedora platform.
Who We Are
Schwab Performance Technology (SPT) is a subsidiary of Charles Schwab that builds comprehensive technology offerings for financial advisors to help them manage their business and their client’s investments. A large part of SPT’s technology team is based in Raleigh, NC. This team develops applications for desktop, web, and mobile platforms that provide industrial strength solutions using technologies and frameworks such as C#, Mongo, SQL, C++, HTML5, Angular.JS, JSON, and REST. We concentrate on the fundamentals of architecture, design, development, and quality assurance to build applications that stand the test of time which is critical in the financial industry.
What SPT Gains From the Senior Project
SPT is interested in engaging with the brightest students in top tier computer science programs. New projects have allowed us to open a number of positions for recent and upcoming graduates. We hope to establish strong ties with the best students during their senior year which could then lead to jobs opportunities when they graduate.
These students will build a prototype application that is an extension of SPT’s new product development. SPT will use the prototype to gain advisor feedback on new ways to interact with their clients about investment strategies for their variety of life goals.
The Project
SPT is proposing a technology project that will provide a small group of students the opportunity to develop an application that allows financial advisors and their clients to project a variety of life goals against investment strategies in new and innovative ways. Currently advisor/client investment discussions focus on a list of life goals that usually translates into a single investment strategy or individual strategies that have no relationship with each other. The application will provide a clear association of goals with specific investments and the ability to view all the investment/goal combinations in a comprehensive way that shows how the variations of success with each investment contributes to the overall financial objectives. The tool will also provide an improved view of projected outcomes required to achieve individual and comprehensive goals and the variation of actual results for each. This will allow the advisor/client to make prioritized decisions about modifying investments and funds and see the projected impact on timeline for achieving goals which could lead to investment strategy modifications.
Prototype functionality (partial list) will include:
- Entry of 20 simulated investment funds with 5 years of historical data and advisor based projection range on future return (e.g. 2% to 5% estimated return) at an annual granularity.
- Entry of up to 25 clients data
- Entry of 10 goals per client including target date and target amount
- Ability to enter initial funding amounts against each goal as well as reoccurring or date specific funding into the investment for a specific goal.
- Users will be able to assign multiple investment strategies to each goal in sequence (e.g. one for any period of time but any number across a period of time to account for reducing risk as the goal target date gets closer).
- User interface that allows textual entry of the goal and investment information
- User interface that provides a graphed view of the goals and investment information. This view will allow drag capabilities for timeline and potentially other factors about the investment for each goal. As the user adjusts one of the inputs or targets, the other associated information will update dynamically to show impact of the change.
- All views (textual and graphical) will provide the ability to see each goal’s projections and actuals in context to the overall strategy while allowing users to filter based on goals, timeline, investments, and potentially other characteristics.
- Actuals for investment returns will entered manually to simulate result.
- Users will be able to store a snapshot at specific times to preserve the current state of the plan for future comparison to actuals. These snapshots will be “live” data however that allow the users to adjust factors at a later time to help interpret what happened between the plan and actuals. These manipulations do not require storage.
- Rudimentary printing capabilities will be required.
- Rudimentary authentication will be required.
The project will be based on technology SPT has been using for new product development. This will include:
- Developing a backend server capable of providing required functionality to store and retrieve performance information. This will be developed using C# with Mongo as the database and REST services for communication.
- Developing the user interface in HTML5, Javascript, Angular.JS, and potentially other Javascript frameworks. This user interface will communicate with the backend servers through the REST services.
SPT strives to develop using best practices while remaining agile. We use the SCRUM methodology and will run the senior project within a similar methodology used by our teams. One mentor will be selected from our development team to be the primary interface with the project team, but other members of our staff will be brought in from time to time to assist with the project.
Project Success
Success will be based on the following accomplishments:
- Participating using a SCRUM methodology to understand the benefits of agile development.
- Requirements (user stories) will be provided to the team. The team will successfully work through the requirements to produce architectural and design documentation for data and user interface components. A variety of UML and white boarding documentation will be used.
- Breaking down the user stories into logical tasks and providing task estimation. This will be used to prioritize features within the semester’s time box.
- Producing quality code (well organized, performant, documented)
- Developing a test strategy for unit, component, and end to end quality assurance. Testing will likely be done manually but students can be exposed to the automated quality assurance system that SPT has in place for existing products
- Prototype completed and demonstrated to internal SPT staff. The goal will be for the team to participate in customer feedback sessions if the timing can be arranged.
NCSU Big Data in the Cloud Project
Traditional organizations use Big Data services on "bare-metal" services, including certain public cloud providers. Cisco plans to deliver Big Data services on an Openstack public cloud. Why is Openstack important? Based on current market trends Openstack is the third fastest growing platform after Amazon Web Services and Google Cloud. Delivering Hadoop as a service on an Openstack has inherently been a challenge. Cisco will work with NCSU to ensure Openstack is available for use in the project.
Project Description
Within the Big Data eco-system there are several components that are designed to be multi-tenant. Some components are designed to scale horizontally over commodity servers but they are not multi-tenant at best. The Big Data ecosystem consists of various tools that address different stages of Data management.
- Data Ingestion
- Data Storage
- Data Processing
- Data Querying & Analysis
Cisco would like to build a Dynamic Hadoop as a service capability to support the Internet of Things (IoT) business. IoT business imposes several challenges technologically and from a business perspective. IoT requires that the infrastructure not only ingest data in a secure fashion but the Data Storage and Data Processing capabilities need to be fast enough to support various IoT use cases. One use case under consideration is to ingest structured data via a multitenant Sqoop infrastructure (to be developed as a project deliverable) and correlate that data with data streaming from a connected device e.g. fibit.
This project will require students to implement Hadoop on Openstack and also to implement a scalable and multi-tenant SQL bulk loader such as Apache Sqoop.
Equipment/data provided: TBD (potential personal devices for use case. E.g., fitbit)
Sonorous
The Problem
There are numerous websites for independent music artists to promote their music, but they do a poor job of connecting the artists with their fans. For independent artists to get their music noticed, they typically have to sell out to a record label or receive an incredible stroke of luck. There exist websites for distributing music, such as Soundcloud and Bandcamp, but neither of these websites focuses on promoting the artists; they simply provide a means of distributing their music. Sonorous aims to provide a way for independent artists to promote and distribute their music while allowing fans to support the artists directly through the website.
What is Sonorous?
Sonorous is a music discovery service designed to allow independent artists to distribute and popularize their music. Sonorous plans to offer a few "pay-what-you-want" bundles of music from various artists every month from each genre. This model encourages buyers to pay what they think the artists deserve. In this business model, the buyer is able to select how much money from their purchase will go to each artist in the bundle, and how much money goes to support Sonorous.
For example, let’s say there is an Electronic Music bundle released. It will include approximately 3 mini-albums with some songs by 3 different artists. If the buyer decides to buy the bundle, they can pay however much they want (let’s say $5.00) and select how much money goes to each artist (they could pay $1.00 to each and $2.00 to us). If the buyer pays above a certain threshold (let’s say $10.00), then they get access to bonus tracks from these artists in addition to the songs available at any level of payment. This incentive promotes paying for the music to support the artists as well as the website.
Other purchasing options, such as subscription-based purchasing methods, may be explored, but the goal for Sonorous is to primarily be "pay-what-you-want" driven. We will conduct market research throughout the semester to determine which method, or which combination of methods, will be most successful.
Intended Audience/Market
Fans/Consumers: Sonorous aims to provide a convenient and clean interface for avid internet users and music savants who have a desire to discover new music from independent artists they could not otherwise find. For example, our target audience is almost identical to those who use websites such as Soundcloud and Bandcamp to discover music.
Artists: Sonorous wants to give any independent artist (not signed with a record label) a free way to popularize, distribute, and sell their music while connecting with fans and growing their audience. I discussed this idea at length with my friend who produces electronic music independently, and he said he would definitely use Sonorous.
Preliminary Features
Planned features include monthly genre bundles that will spotlight songs of different artists, an artist spotlight that will post information about artists, and artist pages that will provide a forum for artists to create custom pages of their own on which they can upload their music. Initial mockups for the website home page and a featured artist page have been designed.
Team Members
Cory Scheviak - Proposed the original idea, has connections in the independent music industry and familiarity with a multitude of relevant programming paradigms to assist in the creation of the product. Knows graphic artists and designers to assist in website design.
Relevant Skills: Backend development (node.js/PHP), Javascript, HTML/CSS, SQL
Michael Clifton - Experienced in database and website development. Has connections to business owners and entrepreneurial resources willing and able to assist in the development of the business.
Relevant Skills: Database development, Javascript, HTML/CSS, SQL, Java
Jeremy Cline - Experienced with distributed systems, development of web applications in Python, and building automated test frameworks.
Relevant Skills: Python, Java, RESTful web services, NoSQL and SQL databases, test automation (Jenkins and TravisCI), Amazon Web Services.
Unknown Fourth Member - We only know the three of us will be in the same section next semester, so we will look to add a fourth during the project bid phase of the class.
OCR Text and Dimension Extraction from Images
Objective: Design and implement a C++-based Windows application that performs extraction of dimension and text information from Base-64-encoded images (from an XML file) using OCR.
Background: Mechanical drawings are created in various CAD systems (e.g. SolidWorks, AutoCAD, etc.) but are typically saved to PDF or TIF as a neutral format before sharing outside of engineering. InspectionXpert’s flagship product uses Tesseract OCR in a .NET based application to render images from these engineering documents and extract the dimension and text information. Our company now has a need for the same functionality in a C++ based application.
Scope:
- Parse an XML file to collect and render multiple base-64 image strings.
- Use Tesseract OCR libraries to extract text and dimensional information from the rendered images.
- Analyze OCR extracted data and perform calculations (formulas will be provided) to populate the following fields in an XML file:
- Type
- Subtype
- Nominal
- Plus Tolerance
- Minus Tolerance
- Upper Limit
- Lower Limit
- OCR Text
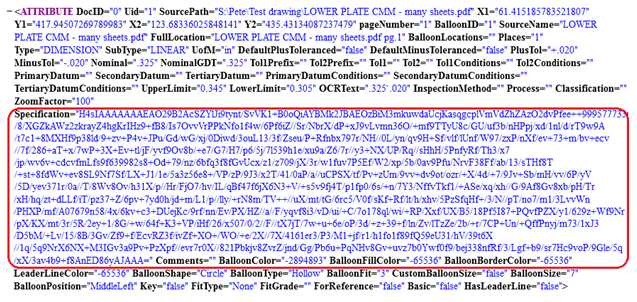
Figure 1 – Base-64 encoded image string from provided XML
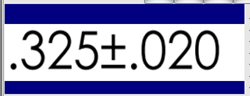
Figure 2 – Image rendered from XML
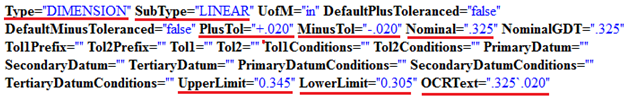
Figure 3 – Fields required for populating XML file for dimensional data underlined in red. Note: Other data shown is not required for this project.
General guidelines:
- Application will rely on Tesseract 3.x for Optical Character Recognition
- Developers are free to choose the toolkit to be used for displaying and capturing the image
- Application will be written in C/C++
- Image will be rendered visually to the user
- User will be able to choose the bounding box from which to extract text from the rectangle. For instance, the user could choose to process only characters ".020" from Figure 2 above versus having to process the entire image.
We will provide:
- Encouragement
- Tesseract 3.x libraries
- Sample Tesseract 3.x dictionary files
- Sample XML data prepopulated with Base64 image strings and data expected to be extracted
- Resources on Geometric Dimensioning and Tolerancing for analyzing dimensional data
Important Skills to Achieve Objective:
- C++ Programming
- OCR Technology
- XML Parsing
- Image rendering
- Customer-driven development
- Teamwork
Company Background:
InspectionXpert Corporation is a fast-growing software company locally headquartered in Apex, North Carolina. We are the creators of the InspectionXpert product line of quality inspection software for manufacturers and suppliers in the medical device, aerospace, automotive and energy industries. Our customers include the top companies and organizations in our target markets. Our customers include NASA, Los Alamos National Laboratories, SpaceX, Medtronic, Raytheon and others. InspectionXpert Corporation was founded in 2004 by Jeff Cope (BSME-01) out of his house in Apex, North Carolina and was grown organically with no outside capital.
Behavior Modeling and Games
This Senior Design Class (SDC) project has two primary foci. The first focus is on the creation of models of behavior derived from game logs. The second focus is to develop a simulation or "gaming" environment that can be used to run competitions between these models.
For this project, the game logs we will focus on are the NFL play-by-play data derived from the 2000-2013 seasons. The specific source of data is the research database provided at ArmChairAnalysis.com at
The data is very comprehensive and samples are available for all games in weeks 1-8 of the "current" season. The complete database from 2000-2013 will be available to the SDC team.
The models to be created can be at the player level or at the team level for both offensive and defensive modalities. It is expected that some level of statistical analysis of the data will be required to identify useful features in the dataset in order to create a probabilistic model of behavior from the raw data. These models can be at the player level and then an aggregate model of the (offensive/defensive) team can be built from these player-level models. On the other hand an offensive/defensive team-level model may be built directly.
The type of model to be built can be defined by the SDC team and may range from simple finite state machine (FSM) models through more sophisticated Hidden Markov Model (HMM) or hierarchical HMM type models of behavior. It is strongly recommended that the SDC team use internet resources to drive the modeling activity, i.e., do some research to determine what has been used, what the current "best practices" are for modeling entities, and leverage open source resources.
The simulation, or gaming, environment to be built can be a simple turn-based environment; one in which each team takes turns individually. When an offensive team takes a turn, a distribution of the results of possible plays is computed from the behavior model for that team. Some number of the "most likely" plays is then used as input to the defensive model for the opposing team and a distribution of results is computed. The most likely results are then used as the starting point for the next play.
The gameplay results are to be reported in some meaningful way that is to be determined by the SDC team. This project has no explicit requirement to design a visual experience for the simulated game. However, students are expected to keep track of their research and implementation process, detailing the strategies used to identify a suitable approach, any tests made, and all of the partial and final results.
As a stretch goal, students may consider building an iOS (iPad/iPhone) based display, perhaps in the Swift programming language to visualize a simulated match.
Email Slicer:
Finding conversations in email
Email Slicer will be an application which takes in forwarded emails and keeps track of conversations within those emails. It is expected to work for emails from all the major email service providers like Microsoft Outlook, Gmail, Hotmail, Yahoo etc.
An email can become a long running conversation thread among the people involved. It can be split into another thread with the same set of people or a different set of people. An email can have just two people on it or it can have many people on it. The Email Slicer will slice each conversation within an email thread and link them all together. It will also track all the recipients in the thread and is expected to look for metadata in the email content to suggest the creation of an appointment, contact, task, etc.
As an example, John Lawyer is working with Bob Criminal on a legal matter. They are discussing the details of next court date over email. John started the email conversation with Bob regarding that.
| John → Bob | John started email with Bob. |
| Bob → John | Bob replied to John’s email. |
| John → Bob | ohn replied to Bob’s email. |
| John → Bob | John replied again to Bob’s email. |
| John → Bob, Mary | John replied to Bob’s email adding Mary to email thread. |
| Bob → John, Mary | Bob replied to John’s email keeping Mary in CC. |
| Mary → Bob, John, Alex John → Bob, Mary, Cindy | Mary added Alex to the email. John added Cindy to the email effectively splitting the email thread into two. |
| Alex → Bob, John, Mary Bob → John, Mary, Cindy | The email thread continued after split conversations |
In this example, the email started between two people, then a third person was added to the conversation. After that the email thread was split between two different sets of people, with each being a back and forth conversation. While the exchange continues, the email can be submitted to Email Slicer a handful of times, where it will find each individual conversation in the email, relate them to each other, and store the result. Individual conversations are the parts of the email body appended between each send/reply cycle; the barrier separating them varies on the email client used. Email Slicer should be able to recognize the splits in conversations, other related conversations from previously submitted emails, the recipients and senders of each, and perhaps action items for the user to take.
Goals
- Produce a reusable system for processing email chains with a RESTful interface
- It should split a large email chain into individual conversations, and relate the parts together with previously submitted conversations.
- For each conversation,
- It should recognize the sender and recipients
- Identify conversations that directly preceded or succeeded each conversation, even across submits.
- (Stretch Goal) Action items & Information, e.g. Appointments, Tasks, Contacts.
Technology
Email Slicer will expose all the stored data via RESTful services for easy consumption. The service will be written in C# 5.0 with .Net Framework 4.5. For storing the conversations and other relevant data, SQL Server is preferred but the student team can decide the appropriate technology. Besides those, the student team is free to choose their own technologies.
The Enron dataset would be a good start if you need to train models, but we'd like to see exchanges between different email providers taken into account, since the way they all separate email is different. For the parts on discovering action items, appointments, etc., Stanford's NLP project provides some good datasets and prebuilt models.
A Touchable, Tangible and Mixed-Initiative Interface for Authoring Cinematic Machinima
Overview. This project involves the development of a novel user interface for the creation of machinima -- cinematics rendered within a virtual world created within a game engine -- that is intended to be used as a learning tool for beginning courses on cinematography and other visual storytelling contexts.
In the Narrative Processing research project, our ongoing research effort involves the creation of an AI engine that serves as a back-end for a cinematic generation capability: fleshing out the details of a story, driving the story’s action within a game engine and controlling a 3D camera to film it. The system lacks a user interface; however, that will allow users to design a film, suggest film structure or tweak, tune or edit cinematics produced by the AI engine. This project will look to build a touchable, tangible and mixed-initiative interface where users can explore the range of cinematics that can be told. The work will involve the use of large (27’) touch-sensitive table-top displays that will provide a top-down view on a virtual soundstage. Users will manipulate the set, the actors and a camera object within the set to specify shots and shot sequences, which will be rendered on a remote service and displayed on an external display. Once the system has a usable UI, the system will provide insight into the relationship between expressive, mixed-initiative user interface designs for storytelling and effective communication of action sequences using 3D game-based methods.
Scope of Work. The project will involve students collaborating with the project PI (Young) and a graduate student also working on the Narrative Processing project. The implementation would use C#, a language that many CSC undergraduates are familiar with, and be built on top of the Unity3D game engine, a tool that is also used in many of the games-specific courses in CSC. Because the project would focus on the user interface, no significant 3D programming skills will be required (decreasing start-up time/learning curve). The existing Narrative Processing team of developers will be available to help the Senior Design team while they are learning the tools and environment.
The project might be readily divided into three elements matching well with a 3 or 4-person team. First, the project requires work to design, create and control the touch-based UI elements for specifying actions and control within the virtual set. Second, the project requires the capability to translate from the UI elements being manipulated into a remote virtual environment that renders the view from the camera for display. Third, the system requires support for a flexible mixed-initiative interaction style, allowing the user to interrupt, revise, explore and review a scene under development.
At project initiation, the Senior Design team would work with the Narrative Processing team to develop project requirements and be responsible for brainstorming to settle on a novel UI metaphor that can be supported by the underlying software toolkit/SDK. At the completion of the project, the Senior Design team would be invited to participate in the design and execution of an experimental evaluation for the system, including the user interface. This work could involve input on experimental design, data collection and statistical analysis.
Columbus (Exploring uncharted territory)
Project Background
Today there is not an abundance of open source utilities to manage / create / visualize graph databases. Graph databases are used in many places; however, most of the tools used to create them are custom-written by companies to support their specific use for them. We would like to get a more robust set of tools out in the marketplace to enable a more mainstream usage of graph databases. While there are many graph databases in the marketplace, Neo4j is one that is free for not-for-profit work, and has a good set of available documentation to get started on it. Merck uses a few graph databases, but this project focuses on Neo4j because we believe it is one of the better "free" ones to get started on. We also believe that D3.js is a good visualization tool for the web, but its usage is more of a suggestion than a requirement. The general requirement is more around being web based, and readily available on the market at no cost.
Project Description
Develop a Web-based UI client to navigate and edit/create graph databases in Neo4j. The utility must be able to create connections to Neo4j databases and support the following requirements:
- Tool to visualize a graph database (be creative, graph databases are expansive, so think of innovative way to express the content.)
- Highlight the edges of the graph database
- Use inference and recommendation to suggest possible connection
- Create new nodes and relationships
- Add or edit existing nodes and relationships.
- Have a flexible interface to be able to navigate by topic / relationship / people / etc.
- Highlight orphaned nodes or broken relationships.
- Provide mining functions, if then else functions, query functions, and filter functions
- Use colors to infer strong relationships, and weaker colors to imply loose / distant / dormant relationships.
Our vision is that this tool will become what TOAD or ER WIN has become to Oracle. Additional requirements may be added as functionality becomes clearer. Students are expected to think about potential use-cases that will impact privacy, security, compliance or entitlements, and think about how that would impact any visualizations and management aspects. See if you can incorporate these ideas into your project.
Recommended Tools:
- Graph Database: Neo4j
- Graph Visualization: D3.js
Target Source Code: Apache Software Foundation (OPEN SOURCE)
Project: Asynchronous IPython Report Execution (Code Name: Rum-Runner)
Technical Leaders: Zach Jones, Fred Peiffer
Mgr: Ken Cantrell
Executive Sponsor: Greg Keller
Background
NetApp has developed a Web-based collaborative reporting environment for data and performance analysis. This environment is built around IPython, a rich architecture for interactive computing with support for rich-media visualizations. The IPython Notebook is a JSON-file with an array of cells containing python code and output (which can be empty). Since IPython is also rich-media aware, the output can contain images, HTML, JavaScript, etc. This collaboration and reporting environment provides engineers data analysis tools to easily explore data to quickly make discoveries and influence product development.
The environment has several tools, one of which is the Report Engine. The Report Engine provides a mechanism for casual users to fill in a Web form that is then fed into an existing IPython notebook (designed to expect the form input), executed, and rendered. This allows for casual users to easily obtain a sophisticated report with minimal investment.
The Report Engine is currently comprised of 5 components:
- Report Template: A special python script (IPython Notebook) that has input parameters passed in from the Report Submission Web UI.
- Report Submission UI: The user facing Web app that allows for selecting and executing reports.
- Report Configuration: An easy to modify INI-style configuration file that is used to populate the Report Submission UI
- Report Executor: The process that handles executing and rendering the Report Template.
- Report Cache: A performance-enhancing data store that bypasses the Report Executor when a Report Template has already been executed for provided parameters. (This component was developed as a previous Senior Design Project.)
Project
Currently, the Report Engine is a synchronous foreground process used through a web browser. For the common use cases, Report Templates execute in a short time span resulting in minimal waiting between clicking submit and viewing the results. However, there are use cases that require longer execution times. Waiting on a web page to load for a significant amount of time increases the probability the request will fail due to many factors such as network connection disruptions.
The team’s project is to extend the Report Engine to provide an asynchronous report execution framework: the Background Executor. The framework will allow reports to be executed without maintaining a connection to the user’s browser, provide a method to allow users to execute reports on regularly scheduled intervals, and provide a method for tools to trigger report execution.
For the Background Executor, the team will need to complete the following features:
- Deploy and configure Celery: Distributed Task Queue [1]
- Create CLI submission tool to queue requests
- Input parameters are report template name and parameters as input
- CLI tool should queue requests in Celery and then exit.
- Modify the Report Engine to
- Support report execution as a Celery Task while not altering the behavior of the Report Executor
- Store executed reports from Background Executor in the Report Cache
- Email notification on completion
- Success/Failure message
- Provide link to executed cached report
- (Optional) Modify Report Submission UI to allow user to choose for Report Template to be executed via Report Executor or Background Executor.
- (Optional) Web Interface to view status of the Task Queue
The Report Engine and larger environment is written in Python and uses the Flask web development framework. Web page components are built on Bootstrap and several JavaScript libraries. NetApp Performance Engineering Group already uses Celery and will integrate the Background Executor into the existing infrastructure.
The team members should have some familiarity with Python and web programming. They will be provided with the Report Engine application, dependency requirements, and example Report Templates of varying complexity. The team will have to configuring Python test environments, deploy the Report Engine application, and deploy Celery.
Benefits
The project provides an opportunity for the students to gain experience in designing and implementing new features for a real-life production environment. For NetApp, the asynchronous report execution framework will provide an improved user experience for long running Report Engine tasks while providing a framework that can be easily scaled to handle demand.
[1] Introduction to Celery: http://docs.celeryproject.org/en/latest/getting-started/introduction.html
Strategic Motion Video
Strategic Motion Video TM (SMV) is a set of interactive video tools intended to be used by instructors to customize courses specifically to the skills and needs of an individual learner. Additionally, instructors can produce interactive video lessons in which learners view the lessons and participate in real time two-way Q&A sessions with the instructor's on screen image. The result is a web-based system for delivering instructional content that is unmatched in today’s online practice. One way of describing this approach is that SMV is a system in which "video talks back."
SMV has been under development for more than one year. Existing designs and a code base provide a solid architecture for continued development. The SMV system is organized around a series of three dashboards. Each dashboard is a management tool for learning, as appropriate to different levels of responsibility in the learning process. The first dashboard allows a learner to track personal progress - the lowest level of learning responsibility. A second dashboard permits a learning administrator to assign individual video trainings to learners – a mid-level administrative function. The third dashboard represents an upper level management function to authorize overall access to SMV functions. For example, think of a learner as a student who wants to keep track of his/her progress on assigned video trainings. The learning administrator could be the instructor of a course who would assign individual training videos to students based on lecture topics and individual pace. Upper level management functions set the SMV system up to recognize those instructors using SMV in their courses and authorize them to access SMV functionality. A database schema is in place that supports these dashboards.
The current state of SMV implementation provides stubs only for most functions in the dashboards, but the architecture is sound. Video streams exist for testing purposes. SMV code is written in PHP. The database is MySQL. Extensive documentation exists.
Goals for the semester include filling out dashboard functionality and running simple experiments to document the usefulness of SMV in action. I.e., provide an answer to the question and backup data supporting the conclusion: Does the use of SMV help the learning process?
Google Glass Kitchen Display System (G2KDS) Evolution Proposal for the Evolution of a Google Glass in Restaurant Industrial Application
Introduction
One of the core functions in a commercial restaurant’s kitchen is the Production Line. While deceptively simple-looking when observing a kitchen in operation from the outside, Quick-Service and Fast Casual operations present a fairly complex automation challenge. For example, think of Taco Bell for Quick-Service and Chipotle for Fast-Casual operational examples. We are particularly interested in the Quick-Service operation model, where during peak hours, a high-volume location produces between 300 and 400 orders over a period of 120 minutes.
Current systems use overhead-mounted flat-screen displays and specialized keyboards called bump-bars to interact with the food orders that have to be prepared. Using the bump bars, the staff will mark items or the orders as ready to serve, recall orders that need modification, accessing instructions about how to make or assemble a food item, or accessing nutritional information, among other tasks. This presents a challenge for the staff, with lots of hand-eye movement, sometimes difficult for people who are of low or high stature or who have vision problems.
Objective
Through the Senior Design Center project for Fall 2014 we validated the feasibility and the team implemented a working prototype of a Google Glass-powered Kitchen Display. Considering the success of that experiment, we want to build a "next generation" set of capabilities on top of that prototype, as follows below.
- Update the prototype to use the updated data feeds and newer data model of the most recent release of the Kitchen Display Service. XPIENT has improved and enhanced the Kitchen Display Service during the past few months.
- Add the capability to use voice control and/or gestures to navigate and interact with orders and items displayed by the G2KDS.
- Explore the options and capabilities to display media files and play audio content related to the order that is on-screen, controlled by gestures and other interactions allowable by Google Glass.
- Explore options to evolve/enhance the navigation paradigm (User Experience) between items/orders, etc. in the Glass App.
- Add capability to connect the Glass to different user-selectable KDS feeds (i.e. Drive Thru Expeditor, Counter Expeditor, Fryer, etc.), allowing the user to switch "kitchen roles" or stations dynamically.
- Implement one or more data feeds that send information back to the Kitchen Service with "Bump" of items and order information when a user performs those actions.
Description
We will provide students working on this project with Google Glass devices programmable using the Glass Developer toolset (https://developers.google.com/glass/design/index) so that, working with assistance from XPIENT engineering staff, they may enhance and evolve the existing prototype adding both production-level and experimental features to the Glass Kitchen Display Video. XPIENT will also provide a working Kitchen Service system that feeds order and item information in support of developing and testing the resulting Glassware application. You will have to document challenges, solutions, workarounds and limitations as found throughout. Students are free to use any template code available (provided that they do not violate any third-party license restrictions), or to create software solutions from scratch.
We envision that work will be divided in two phases:
Phase 1: "get to Know" Glass, the existing prototype and determine Requirements and Design
This phase involves getting familiar with Glass, Glassware, its Design Principles, the Glass API and the existing working prototype of the G2KDS application. This phase also includes designing and documenting a solution approach, assisted by XPIENT staff. The expected results of this phase are:
- Implementation approach.
- Refine the feature list to implement in coordination with XPIENT.
- Design review and/or revision for the application
- Supporting documentation
Phase 2: Solution
In Phase 2, augment the prototype Glassware Kitchen Display System. During this part of the project you will use your design and chosen approach to construct the new Glass software solution. The expected results of this phase are:
- G2KDS Glassware "v2".
- Documentation describing how the system was designed, implemented, and tested, including implementation details that you discovered, issues found, limitations of the platform and any solutions to these issues you’d like to recommend.
Product Recommendation Engine
Bronto Software offers a sophisticated marketing platform for its corporate clients, tracking billions of events per month. Customer events such as opens, clicks, and purchases (conversion) are recorded and analyzed in real-time and displayed to our customers to give them a clear view of how their campaigns are performing.
The Spring 2015 Bronto Senior Design project is a product recommendation engine. The recommender will consume data from Bronto’s Product Catalog (prices, descriptions, categories), Order Service (purchase history), and Cart Recovery App (items placed in a cart and then abandoned). It will generate recommendations based upon each customer's behavior and demographics (which are also available via Bronto’s Contact Service). These recommendations will be used in marketing emails, sending coupons and other special offers.
The recommender will function as a stand-alone REST API. In addition to aggregating Bronto data sources to make recommendations, as a stretch goal, the recommender may draw from customer Twitter feeds to enhance recommendations. As a more ambitious stretch goal, the recommender may include data from Facebook. Bronto collects customers' Twitter and Facebook handles in addition to their email addresses.
Bronto recommends Java or Python as the implementation language for this project, and we will provide advice when choosing other necessary technologies. However, students will be ultimately responsible for making their own technology choices (language, web server, etc.) based upon their own competencies and preferences.
Design Collaboration Space
Imagine trying to write code without version control. You might email around source files, compile and run them locally, add new features, and then email your updates to your team members. This is a terrible way to collaborate, but it’s similar to what our designers often get stuck doing.
Designing software is a highly visual process, using sketches, wireframes, libraries, and other related project information. When your project team consists of people all over the globe, that’s a recipe for a LOT of email, and documents can quickly diverge into multiple inconsistent versions.
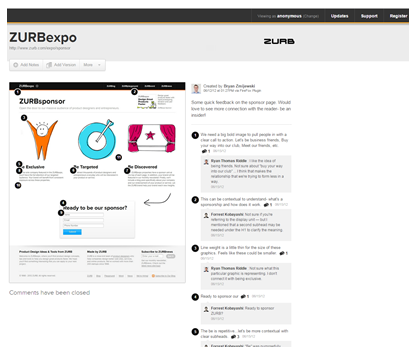
The DBGT design team has had some success using a tool called Notable for this type of work. It offers a centralized loction where designers can collaborate and leave comments on shared resources.
Project Description
Notable has been a valuable resource, but it is not ideal for the DBGT environment and workflow. We are looking for a senior design team who can design and implement an online collaboration environment that builds on these ideas to offer a user-centric tool that help organize and share design artifacts in a rich and engaging way.
Deutsche Bank has already implemented a minimal proof-of-concept system using Node.js, Angular.js, and HTML5/CSS3. This prototype, along with representative data sets will be made available to the team. The goal for the team is to build on these examples to deploy a working version of the product at Deutsche Bank.
Using an agile scrum process, designers at DBGT will work closely with senior design students to refine requirements and design, and to create a novel collaboration tool that meets the needs of DBGT designers and provides senior design students opportunities for collaboration and creativity.
Fujitsu America is one of the top three suppliers of retail systems and services worldwide. Using Microsoft’s .NET development platform, these systems offer a high performance yet open platform that retailers as diverse as Nordstrom, RadioShack and Dressbarn are able to customize.
With mobile applications becoming key to most business’s portfolios, including retail, Fujitsu is looking to expand the mobile footprint and interface capabilities of their Point of Sale (POS) offerings. Fujitsu has two primary POS Systems. A project is underway internally to support REST/JSON in our legacy POS, GlobalSTORE. Fujitsu’s next generation POS, Market Place, was built on architecture to support various external and mobile applications.
Fujitsu believes the Spring 2015 project involves accessing and understanding the use and interfaces of two of their core applications, CustomerCENTER (Customer Relationship and Loyalty) and GlobalSTORE (Point of Sale).
Customer Mobile Store Application
For the Spring 2015 project, Fujitsu would like the investigation / research development of a proof of concept customer facing store application which could / would interface into both Fujitsu POS and CustomerCENTER applications.
Product development is not only design and implementation, but it is also market and user research, and the definition of those requirements. Fujitsu would like to leverage the experience and demographic group of the NCSU Senior Design team to not only produce a proof of concept, but define the actual functional user requirements. Fujitsu will help the Project Team with direction on project goals and suggested markets, as well as what current functions their applications can support, but is looking for the Project Team to drive the innovation and research of the functions *expected by a customer* and the proof of concept design of a true customer-level application in a Retail Store environment.
As part of this project the Team will be responsible for the following:
- Development the high level functional requirements of what a customer facing, in-store phone application should contain.
- Detailed functional requirements, including a story board, for the mobile application
- Define interface needs from POS and CustomerCENTER applications
- Determine if current interfaces exist in available interfaces
- Fujitsu Interactive Transaction Service
- CustomerCENTER APIs
- Develop Proof of Concept and GUI implementing the NCSU team’s view of a customer facing store application.
- Use available interfaces if applicable, or stub out unavailable interfaces for demonstration
- Use appropriate public 3rd party services where necessary to introduce ancillary functionality (e.g. Google, Facebook)
- If unavailable, write user requirements for all unavailable interfaces
As part of the project, we see some of the high level areas as being:
- Use of REST/JSON interfaces, if applicable, developed by Fall 2014 NCSU Senior Design Team
- Base integration with both GlobalSTORE POS solution and Fujitsu CustomerCENTER solution
- Identify and architect web technology
- Development of Proof of Concept code to work on more platforms and formats (Priority as Follows):
- Compatible with all iOS formats (iPod/iPhone and iPad)
- Compatible with Android Phones and Tablets
- Compatible with Windows 8 Tablet
- Functional Design and User Documentation
Interface Self-Service Market Place
Humana Inc., headquartered in Louisville, Ky., is a leading health and well-being company focused on making it easy for people to achieve their best health with clinical excellence through coordinated care. The company’s strategy integrates care delivery, the member experience, and clinical and consumer insights to encourage engagement, behavior change, proactive clinical outreach and wellness for the millions of people we serve across the country.
Problem Description
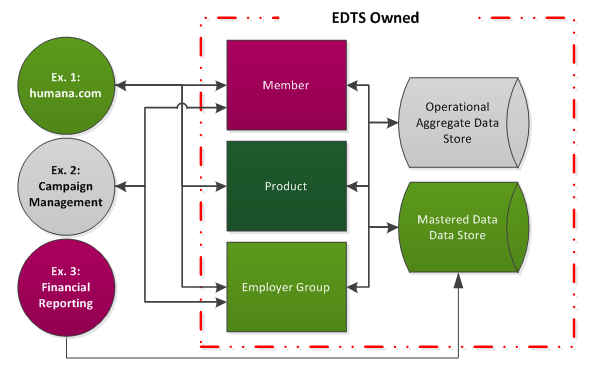
Enterprise Data & Technical Solutions (EDTS) is a department within Humana whose systems and initiatives comprise several large data stores and accompanying realtime, near-realtime, and bulk interfaces. These interfaces provide access to member, prospect, consumer, product and employer data and are used widely within the company. For example:
- humana.com may need data describing a member, the product that member has purchased, and the group that the member belongs to from a real-time web service.
- Campaign Management may need member demographic data and corresponding group data to do a mass mailing, with data made available just before printing starts – more of a near-realtime need.
- To generate financial reports the data warehousing team may need a bulk extract directly from a data store.
Several pain points have been identified by the consumers of this data – 1) Lack of definition surrounding EDTS data elements 2) Time to resolution for identifying the interface between EDTS and consuming applications 3) Lack of self-service tools / information for consumers to define consumption patterns
These problems could be alleviated by a web application available to both the EDTS team and teams consuming EDTS data. The Humana Senior Design team will develop a .NET application with the following capabilities:
- The ability for a requestor to identify the specific data elements in existing EDTS data stores needing to be consumed
- The ability for a requestor to define their input criteria to determine if they will be using ‘get’ or ‘search’ operations minimum criteria to identify a single record or a group of records
- The ability for a requestor to define the parameters required for a particular interface (e.g. Definition of Service Level Agreements; Service Operation Requirements; Security Requirements)
- The ability for the administering team to seek approvals for granting access to consuming team via approval workflows initiated in this tool
- The ability for the administering team to provision security access via this tool
- This tool should be able to assist consuming teams formulate different service requests to achieve the desired response; driven by the required data elements
Interactive Visualization Tool for CRSX
Every compiler is, at some level, about rewriting. Several tools exist to let us create a new compiler by defining rewriting rules, and CRSX (https://github.com/crsx/crsx) is one such tool. It lets us specify higher-order rewriting rules and use them to create a compiler written in C/C++ or Java. CRSX is an open-source project; in addition to professional use, it is used to teach a compiler class at NYU.
Rewriting can get complicated, and it can be difficult to diagnose problems that occur during rewriting. A CRSX-generated compiler can report a textual dump of every rewrite step it performs, but this report may be huge and difficult to navigate. An interactive visualization tool could really help; that’s what the IBM Senior Design team is going to build.
The student team will select the implementation language and appropriate technologies for the visualization. After working with CRSX and getting some first-hand experience navigating textual rewrite dumps, the team will work with the developers at IBM to identify and refine specific visualizations and navigation options their tool will offer. This may include:
- Jumping among different steps in sequence of rewrites
- Searching for a particular pattern in a term being rewritten
- Letting the user specify how particular terms should be displayed
- Opening and closing sub-trees in a term being rewritten
- Searching for application of a particular rewrite rule
- Finding the rewrite rule that produced or removed a particular sub-term
- Support for debugger-style features like breakpoints in the sequence of rewrites, activated, for example, when a particular term is introduced
This project will contribute to the CRSX open-source product. Contributions made by this team could greatly benefit both professional development of compilers using the CRSX as well as courses in compiler construction.
Retail Gesture Wall
Background
Infusion is a Consultant Development company based in New York. We have clients in all shapes, sizes and markets. La Mer (one our clients, a high end beauty products company) is looking to explore digital interactive at retail.
Experience
Imagine a customer walks up to a product display to check out one of La Mer’s moisturizer creams. The customer picks up the container, briefly examines it and places it back on the shelf. The LED display mounted atop the shelf automatically starts playing a video highlighting the advantages of the particular product the customer picked up and the customer is swayed into a purchase, thereby driving a sale. To start this initiative they would like to pilot a “gesture wall” in one store, monitor and capture interactions and track sales impact.
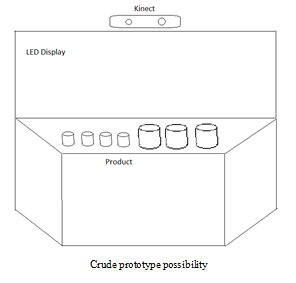
Implementation
- Gesture Wall
Retail fixture - has yet to be designed, and we will be meeting with the team early on to brainstorm the best format (as this may depend on the motion sensing technology chosen). We will quickly have a prototype fixture built once a design is agreed upon.
Windows PC
LED display - Interaction Sensors
This is a design decision for the team to consider; ideas include Kinect, Leap Motion, Weight sensors, or RFID sensors. Infusion will provide whatever the team decides to go with based on their experience and interests. - Software
As a consumer reaches out to a product, the sensor should capture the metrics around those interactions while prompting the PC to play specific videos on the display, based on the particular product interaction. All metrics will need to be written to a CSV or similar repository on the PC. - Training plan for store employees
The user’s guide submitted with the final report should include instructions for employees who will be setting up and using the fixture.
Stretch Goals
- Additional features that may be accomplished if the basic project is completed with time to spare.
- Point of sale integration
Software for reporting sales crossed with the recorded metrics. For example a customer might seem to be putting the product down, but instead might decide to purchase it because of fixture. - Fixture beautification
Making the unit more attractive and closer to being presentable in a store. - Scalability
Connecting multiple systems to a remote server to easily aggregate metrics from multiple stores.
At Ipreo, we have a team of talented analysts on our Global Market Intelligence (GMI) team who build relationships with companies and inform their clients of their stock’s movement in the market. One of the ways they do this is by creating a customized mini webpage that shows that stock data which their clients can view on their BlackBerries. In the past, the process to create one of these BlackBerry Daily reports has involved a lot of manual effort, which can be automated with a well-designed web applet that focuses on simple image manipulation, file transfer, transaction logging, and good user experience.
The BlackBerry Daily is composed of a logo section at the top, and a table of numbers at the bottom. The process to construct one is the following:
- The GMI analyst requests a new BB Daily to be made by the UX team and provides a logo image, a company name, and a stock ticker
- The UX team sizes the image to fit according to a predefined template
- The UX team chooses a color from the logo to act as a background color
- The UX team chooses a font color for the text of the report title
- The UX team uploads the appropriately named file to a specific folder on one of Ipreo’s web servers
- The UX team replies to the request with the appropriate color codes
- The Analyst then uses those codes and file name in a small app on their computers to generate an HTML URL that will point to the correct location on Ipreo’s server, and they share that URL with their client
In the end, this is what you get:

The logo was added to the template to fit in the right side, the company name was added to the title, the title background was changed to match the logo, resized, and the color of the title was changed to be legible.
Straightforward, but tedious. We would like to have a ‘self-service’ portal that allows authorized users (employees of Ipreo) to upload their own logos, pick their own colors, and have the files get uploaded to the appropriate folder locations on their own. Some review process should also be implemented, that allows the UX team to correct any mistakes the analyst might make on their own.
Here is how we’d like to see this work:
Analyst workflow
- Log into the web app
- Enter data into a Name field and a Ticker field
- Upload a logo image
- Edit the image (resize and crop) to fit into the template space
- Select a primary color for the title background and text font
- Submit the design for approval
UX approval workflow
- Receive email of a new file
- Logs into the web app to see a list of jobs waiting for approval
- View the generated graphic
- Either approve the graphic or deny it
Approved jobs then get FTP’ed to a pre-defined location by the system. Denied jobs get to be remade by the UX team. They will then pull the original logo file that was uploaded by the Analyst, the ticker and company name, and generate their own image that can replace the one the Analyst submitted. Upon final approval or replacement, an automated email should be sent to the original analyst letting them know the job is done, and give them the color codes and filename that they would need to create their URL.
While it seems straightforward, there are some technical challenges:
- The app must be hosted within the Ipreo firewall
- It must authenticate the users to only allow employees access
- It should have a database in the backend to track and log jobs
- It needs to allow users to upload an image file and process it (resize, pick colors)
- Allow UX team members admin rights to review the jobs
- Transfer the file via FTP with the proper credentials
- Email the original requester with the proper color codes and file name
As a stretch goal, it would be nice for the Analyst to automatically get the URL they need from this web app – instead of having to type the codes and text into an application on their computer, which could generate errors and just adds unnecessary redundancy to the process.
This would require uploading an Excel spreadsheet (to create the table part of the BlackBerry Daily report), and having the web app generate the proper URL from all of the other parameters that were set by using the app. This is our long-term goal, but just having the tedious part of the logo creation done automatically would be a great help.
Creo View Augmented Reality Mobile App
Background
In the world of discrete manufacturing, it has been common practice for many years for companies to share engineering design documents with suppliers and manufacturing as 2D drawings. With the market maturity of 3D CAD, there has been a growing movement in discrete manufacturing to implement Model-Based Definition (MBD). This approach places the annotations (e.g. dimensions, tolerancing, process notes) that would normally go against projected faces in the 2D drawing directly within the 3D CAD Model. Thus the CAD model contains all of the information needed to define the product.
Why do this? Studies have shown that the human mind can understand three dimensional data more readily than two dimensional data resulting in a shorter learning curve. In addition, it is more efficient to simply reuse and organize the information needed while modeling a product than recreates that information in an additional file. This traditional approach results in more files to be managed, additional time needed to recreate product information, and more chances of error. MBD, on the other hand, results in a single source of truth (the model) that is created efficiently and in a shorter time.
Problem Statement
The MBD movement has not taken off over the last 5 years as expected, in part because of the lack of an easily accessible transport mechanism for the information. While 2D drawings in PDF are easily transported and displayed on just about any machine, large file size and significant hardware requirements have made MDB infeasible for the types of workstations normally available on a manufacturing floor.
The CSC 492 student team will create an Augmented Reality Android app to solve this problem, CreoView AR. The PTC CreoView Java toolkit makes it possible to view 3D models within a Java Application. Using this toolkit along with other technologies selected by the team, CreoView AR will provide views of 3D parts, 3D assemblies and 3D animations, all accessed via traditional 2D printouts or displays.
Design Constraints
- CreoView AR will be built with PTC CreoView Java Toolkit, which will be provided by KPIT (http://www.ptc.com/product/creo/visualization/view-mcad/extension/toolkits).
- CreoView 3D models will be viewable using an Android app for smartphones and tablets; the models will be stored on a PTC Windchill server and downloaded and rendered by the app.
- A separate desktop application integrated with the PLM system will use a QR Code generator (to provide the download link to the CreoView viewable). This will be provided by KPIT.
- A watermark should be included in the view to add a tracking template to the existing format. The tracking template is simply a set of images used to align the 3D viewable file to the real-world image. See example at: http://augmentedev.com/trackers.php
The concept for this project has been derived from some commercially available uses of Augmented Reality. For a great example of this use case, refer to the company, Augment and its website: http://augmentedev.com. The Lego® Store also uses a similar approach to turn the static images of toy boxes into animated 3D digital dioramas of the assembled toys.
IDI Web Interface Make-Over
The existing web interface for the MetLife Individual Disability Income (IDI) System is illustrated below. This interface has been developed over a span of 18 years using a collection of technologies. The challenge facing the 2015 MetLife Senior Design team is to re-imagine this interface using state-of-the art technologies, including HTML5, CSS3, Anjular.JS and RESTful web services.
Updating this interface offers opportunities for creative UI design as well as technical challenges. The team will also get to address design issues like authentication, authorization and logging. The overall architecture of the solution will be shaped by the MSR technology stack being adopted within MetLife. Compared to the existing IDI system, MetLife developers have found that these technologies simplify UI development substantially. The team is also welcome to identify additional technologies that could be brought to bear on the project
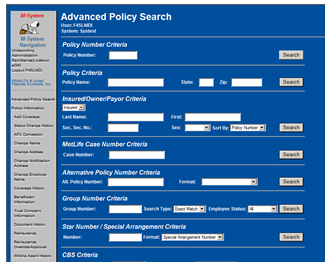
MetLife will provide the team with relevant parts of the existing IDI implementation and dummy data. MetLife will work closely with the team to formalize project requirements, to develop and refine UI mock-ups and to prioritize application functionality to be targeted in each iteration. Thorough documentation of the design and the implementation is particularly important to MetLife.
The MetLife senior design team will be expected to sign over IP rights to the sponsor.
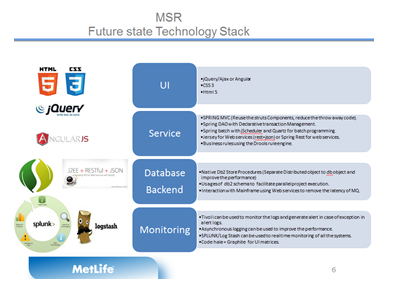
Javascript Dependency Analyzer
Javascript is the primary language used to develop web applications with rich user interfaces. SAS uses Javascript to develop many of its Enterprise applications and is making a large investment in developing reusable components based on the open source OpenUI5 framework. One of the challenges in developing any such system of components and applications is knowing which components are in use by which other components and applications. Currently we do not have any meaningful way to determine these relationships between Javascript classes. This inhibits our ability to determine the testing impact of changes made to a particular component.
For this project, you will work with a Senior Development Manager with over 20 years experience developing reusable components in various technologies. The project will be developed in two parts. Part 1 scans the source provided for definitions of classes and functions and stores the information in either a database or XML format. This part of the project may take advantage of an open source parser like Esprima.
The second part of the project will provide an interface for examining and querying the results from the scanner. It will expose direct and indirect (recursive) relationships between classes and functions. Queries can reveal upstream and downstream relationships among classes (i.e., what other classes are used by class X; what classes use class X). The results can be printed to the terminal or optionally be used to generate an HTML report.
A relatively simple command line interface to the tool would be best at this point. One command (for part 1 above) will initiate a scan of a directory structure of code and generate the database. Another command line interface (for part 2 above) will allow the user to query for relationships:
- ScanCode.py
[–recursive] - QueryRelationships.py
[-recursive] [-uses|-usedBy]
This project will provide the team the opportunity to work on a real-world problem that leverages many open source technologies while developing new functionality to solve the problem at hand. While specific technologies are mentioned in this proposal, we are open to suggestions for alternative implementations that meet the goals outlines.
Possible technologies used:
- Python (Part 1: file processing , relationship determination, and database creation; Part 2 : querying database)
- Esprima Javascript Parser: https://github.com/ariya/esprima
- Node.js (possibly for running the Javascript parser as a web service, so that the Python tools can access it)
Project Archives
| 2026 | Spring | Fall | |
| 2025 | Spring | Fall | |
| 2024 | Spring | Fall | |
| 2023 | Spring | Fall | |
| 2022 | Spring | Fall | |
| 2021 | Spring | Fall | |
| 2020 | Spring | Fall | |
| 2019 | Spring | Fall | |
| 2018 | Spring | Fall | |
| 2017 | Spring | Fall | |
| 2016 | Spring | Fall | |
| 2015 | Spring | Fall | |
| 2014 | Spring | Fall | |
| 2013 | Spring | Fall | |
| 2012 | Spring | Fall | |
| 2011 | Spring | Fall | |
| 2010 | Spring | Fall | |
| 2009 | Spring | Fall | |
| 2008 | Spring | Fall | |
| 2007 | Spring | Fall | Summer |
| 2006 | Spring | Fall | |
| 2005 | Spring | Fall | |
| 2004 | Spring | Fall | Summer |
| 2003 | Spring | Fall | |
| 2002 | Spring | Fall | |
| 2001 | Spring | Fall |