Projects – Fall 2014
Click on a project to read its description.
Batch Scheduler Previewer
Summary
Determine and prototype a solution to analyze and embed Batch Processing Schedules into a Microsoft Sharepoint Calendar to facilitate schedule viewing based on date and time to identify and assess processing timeframe windows.
Background
Our Batch Scheduling tool/software is Autosys which holds all of our schedules (dates and dependencies). The scheduling information is stored in an Oracle database. In order to view schedules or to be able to see when jobs (programs) are scheduled to run, it requires access to the Autosys environment.
We would like to provide a means to view the schedule information outside of the Autosys environment. This will help teams determine to plan for activities (such as a server outage) by viewing what will be running at any given time.
Problem Statement
There are thousands of jobs that run on our Finance server every month. There are daily, nightly, weekly and monthly processing jobs. There are times when it is important to know what will be running during a given timeframe. For example, if the server needs to be brought down for maintenance it is important to find a window that will impact the least amount of jobs. This tool will help the team more easily analyze the processing windows.
Additional Details
Boeing will provide the Oracle table layouts and sample test data (including sample historical data to evaluate run times). The NC State team should set up an Oracle database with the table structures and load the test data. A program will then need to be developed to query the tables and identify when the jobs process. Since Autosys has no specified “end-time”, a review of historical runs for the same job would have to be calculated to get an average run time. Outlier runs (extremely long or short) would need to be identified and discarded by the program to get an accurate duration.
The program will perform a conversion/processing on the data to format it before actually doing the update to the calendar. The team will decide on the appropriate programming language(s) (i.e., C#, Java, Javascript, etc).
In order to test and view the calendar, it will require access to SharePoint. There is a free hosting website (http://www.cloudappsportal.com/) that can be used to build a basic SharePoint which is all that is needed for this project.
This project would result in a tool that programmatically analyzes the scheduling information and formats it appropriately into a Microsoft Sharepoint calendar. This way it could be easily viewed by anyone to determine what is scheduled to run and when. This will assist in the ability to determine impact to planned or unplanned outages. Access and knowledge of the actual scheduling tool is not required as the tool will accept a feed to be used as input.
Home Control iPad Application
Overview
Duke Energy customers have traditionally needed to monitor and control many devices in the household to manage their monthly energy consumption. Devices such as thermostats, lighting, pools and appliances are typically managed individually to maintain monthly energy bills at affordable levels. This can be a tedious, time-consuming process for our customers. Even with the advent of new technology that allows customers to manage devices remotely, new challenges are being created that make it difficult to manage all these devices collectively.
Duke Energy is pursuing a new strategic direction where customers can manage their home energy usage centrally, through one device that is fully integrated with all electric components within the household. Based on primary and secondary research, we believe this will make energy efficiency more effective, sustainable and engaging.
To help realize this vision, the students will prototype an iPad application that allows our customers to control homes digitally and holistically. In addition to fully interfacing with all household energy consumers, the application should serve as a platform where the customer can be engaged in all facets of Duke Energy's home energy program. For example, the application should allow our customers to change the temperature of their home via remote connectivity with the thermostat, accept a peak event or leverage personal storage as needed, just to name a few. However, it should also accept feedback from Duke Energy to modify temperatures automatically when energy usage across our service territory spikes. Other types of feedback should include:
- Energy conservation tips, based on time of day and historic usage
- Alerts when energy usage is outside the norm for that area
- Ability to receive system recommendations that can be easily accepted by the customer
- Impact of home solar panels on current energy usage
- Impact of changes to time of usage rates on energy bills
- The ability to sign up for new Duke Energy offers and choices
The application should provide Duke Energy with the ability to show regulators, customers, and all other stakeholders the full suite of our home energy management program. Students should be as creative as possible with the application's presentation (graphs, images, charts, etc), and should draw on personal experiences to help make this application effective, widely used and user friendly.
Interfaces
The students should simulate all communication between the iPad and the devices it will manage. Investigate the best, most effective ways for an iPad application to communicate with its surroundings. Implement the solution based on these results. Build out a server to simulate all communications that the iPad is managing. The server will be used to demonstrate how the iPad app communicates with its surroundings, whether to/from Duke Energy or to/from the home environment. The format of the communication could be the same for every type of communication (e.g., XML). Perhaps a header to indicate the communication sender/receiver (Duke Energy, the air thermostat, etc.) could be included. Security is not a concern with this application since it will be a prototype only.
Reports
The users should be able to pull reports dynamically which detail the current energy usage in the household. This report will list which devices are online and the energy usage for each. The report should also indicate if there are any issues or connection problems within the home network, and suggestions for resolving should be providing. The reports should be in a format that are easy to read and send to others.
iPhone Version
As an additional challenge, the students will create a “lite” version of the application for use on an iPhone.
Documentation
Full documentation of the system is required. This includes:
- Source code documentation
- A User's Guide, in the form of a Word Document, fully describing the features of the system. This is to be a “how to” guide for the users.
- A Technical Guide, in the form of a Word Document, that describes the architecture and major components of the system from a technical standpoint. The intended audience will be software developers who will be providing support for the application in the future.
Customizable Dashboards for Unisphere Central
Background
EMC's VNX/VNXe products are industry leading mid-tier storage systems developed in EMC's Enterprise and Midrange Storage Division (EMSD). Unisphere is our management platform for administering and monitoring the storage systems. It is capable of managing hundreds of EMC storage systems.
The RTP Software Development Center provides a framework, Unisphere Central (UC) that customers can deploy to be a centralized management and monitoring service in a customer environment. One challenge we observe in monitoring a large environment is to display modern looking health dashboards that rolls up data from 100s of storage systems each containing 1000s of elements.
Project Scope
We want to develop a scalable, general purpose 'Heat Map' widget and an algorithm for populating the widget using abstract concepts that can be adapted to multiple situations.
This heat map 'system' will be provided the following input:
- A table of 'objects', with some basic attributes about the object (id, name, description, etc). Each object also has a special attribute called weight that can range from a value of 1 to 100. The number of objects in the table can be anywhere from one to one million.
- A table of 'relationships' between the objects. Each object can optional be a child of another parent object. Likewise, a parent object can itself be a child of another object. The number of levels in this hierarchy will be limited to 10.
- One or more tables of object 'states'. Each table will be specific to a specific date/time (today at 6pm, yesterday at 11am, etc). Within each table, the objects are listed with their states. The value for the state can be one of Green/Yellow/Red/Grey.
- Size of a rectangular area (in pixels) within which the heat map need to displayed.
The resulting heat map should possess the following attributes:
- Partition the rectangle in the heat map into a number of distinct areas. Each such area should be clearly and separately recognizable by human eyes.
- Dedicate one such area of the rectangle for each object in the table. If the number of distinct areas cannot accommodate all objects, roll up the objects into higher level objects using object relationship.
- All objects on the dashboard should be at the same level.
- The size of the area must be proportional to the weight of the object.
- The state of the object must be displayed using color; it must also accommodate color-blind people
- When rolling up objects, the most critical state must be rolled up.
- When rolling up objects, the weight must be summed up and scaled down to 1-100 range.
- The most recent state of the objects must be presented by default and the date-time must be shown.
- Users shall be presented a control that allows them to choose one of the other available date/times and refresh the heat map.
- Users shall be able to 'play' through the available dates and watch the heat map refresh at a configurable interval with the ability to pause any time.
- Users shall be able to (recursively) drill-down a rolled-up area, and refresh the heat map for the next level object. They should be able to go back up to the next level.
- Users shall be able to 'hover over' an area and get the details about the object.
This shall be delivered across multiple phases:
Materials Provided
- Balsamiq Mockups license to create / provide GUI mockups for review.
- Access to the Sencha Toolkit, if required.
Benefits to NC State Students
This project will give the students an opportunity to influence a user interface element for a multi-billion dollar product line. They will gain valuable, in-demand skills around user experience design and HTML5 development. They will experience all aspects of a product development lifecycle – design, development, demonstrate, in an agile setting. The project will foster out-of-the-box thinking and innovation. EMC will work with the team closely to provide guidance and give customer feedback as necessary to maintain project scope and size.
Benefits to EMC
EMC will benefit from the perspectives on UI design from next generation innovators at a leading institution.
Company Background
EMC Corporation is the world's leading developer and provider of information infrastructure technology and solutions. We help organizations of every size around the world keep their most essential digital information protected, secure, and continuously available.
We help enterprises of all sizes manage their growing volumes of information—from creation to disposal—according to its changing value to the business through big data analysis tools, information lifecycle management (ILM) strategies, and data protection solutions. We combine our best-of-breed platforms, software, and services into high-value, low-risk information infrastructure solutions that help organizations maximize the value of their information assets, improve service levels, lower costs, react quickly to change, achieve compliance with regulations, protect information from loss and unauthorized access, and manage, analyze, and automate more of their overall infrastructure. These solutions integrate networked storage technologies, storage systems, analytics engines, software, and services.
EMC's mission is to help organizations of all sizes get the most value from their information and their relationships with our company. The Research Triangle Park Software Design Center is an EMC software design center. We develop world-class software that is used in our VNX storage, Data Domain backup, and RSA security products.
EMC where information lives.
Grocery Gadget
Summary
The basic premise of this mobile application is simple: allow users to spend less time in a grocery store. We plan do this by allowing them to create a shopping list, and from that create the most efficient route through the store. We have spoken to countless friends and family members who all state that they hate wandering back and forth through the store looking for items that they need. Why does everyone have stories like this? Because the current model for the grocery store is to keep the customer in the store as long as possible. Our application will allow users to spend less time in a store, but will give us a platform for an intimate advertising experience tailored to specific users. We argue that it is more valuable for both the grocery store and suppliers to target individual consumers than time spent in the store. Tailored ads will also benefit consumers as they will not wander the store picking up unneeded items, but will instead impulsively buy items that benefit them. It will also give us access to customer data in higher detail than ever before achievable during their shopping experience, which we believe will be of great value to grocers and suppliers.
Semester Goals
Within the scope of this semester’s project, we hope to achieve three things: allow users to create a shopping list within our application, allow users to have a session in a grocery store where they are efficiently routed through using our application, and create an advertising platform with our application. There are several things that we will have to do and build in order to achieve these goals. We will need to create an android (or other smart phone) application in order to perform these actions. We will need to create a database and web service that will standardize data injection and allow our application to retrieve information about any store in a standard way. We will need to obtain store data on all items for sale and the location of these items in the store. To accomplish this, we will need to plan interactions with grocery store chains and with individuals who are experts in the grocery and data analytics industry.
Candidate Profile
Most importantly, we are looking for someone whom we can work well with. We believe our success critically hinges on our ability to function as a strong team unit, and be aware and sensitive of others strengths and weaknesses. We are also looking for someone who is self-motivated and driven by risks and rewards of entrepreneurship. In terms of technical ability, we are looking for someone who has some experience with android and/or iOS7 development and for someone who is strong in user experience design.
Fidelity ACI –Consolidated Project Management Tracking & Status Tool
Fidelity Personal Investing (PI) Acquisitions, Communication, and Insurance software development team has several responsibilities, one of which is the creation of dynamic customized communications destined for Fidelity customers on behalf of Fidelity Representatives and business units. The applications are also responsible for the distribution of the communications through one of the many channels available, print and mail, electronic delivery, outbound email, etc.
The team within this area currently manages and tracks the development/enhancement of applications using Microsoft Project, Word, and Excel. MS Project is a project timeline and tracking tool which list out a project’s task, deliverables, start dates, end dates, dependencies, and resources responsible for each task. MS Excel is used in a variety of ways, but primarily to often convert the data from MS Project into a format that everyone can read (as many people do not have MS Project), to track issues / risk, and to maintain a backlog of items for future releases.
Challenges arise when there are multiple projects occurring at the same time with various people (business, technology, legal, design, operations and support, etc) in various locations working across the projects, all of which have different communication needs and level of information/ detail required for their specific job functions. Additionally, it becomes challenging for project managers to continuously coordinate and keep up to date all of the various project information and updates that occur throughout the lifecycle of a given project.
The proposal here is to build in additional capabilities to the project management and tracking capabilities of the Atlassian JIRA 6.3 application. The overall goal is to r simplify and centralize both project activity tracking and summary status reporting. The backend should be integrated with Oracle11.2.0.4; however we are flexible and open with the technologies used.
The following are the broad requirements for the project:
Priority 1: Project Timeline / Milestones
Develop a detailed project timeline that eliminates the need to use both MS Project and MS Excel in order plan and track project deliverables
- Deliverable/task name
- Milestones high-lighted
- Dependency capability
- Percentage complete
- Assigned resource
Priority 2: Project Dashboard
Develop a consolidated project dashboard of high-level project status and key metrics
- High-level timeline with milestone/deliverable dates – percentage complete status
- Primary accomplishments
- Risk/Issues and Mitigations
- Budget summary
**STRETCH MODULE: Alerts / Notifications
Develop a mechanism for emailing the designated Project Manager and assigned deliverable resource a message when we are within one week of a project deliverable due date, in addition to a follow up email for any past due deliverables.
- Email notification
- Ability to generate a report of approaching deliverables (one week out)
- Ability to generate a report of past due deliverables
Notes:
- Detailed business requirements as to data points required and sample of reports and formats will be provided to the student team at the beginning of the project. All “proprietary” data will be either deleted or masked.
Google Glass Kitchen Display System (G2KDS) Proposal for the Exploration of Google Glass in Restaurant Industrial Application
Introduction
One of the core functions in a commercial restaurant’s kitchen is the Production Line. While deceptively simple-looking when observing a kitchen in operation from the outside, Quick-Service or Fast Casual operation presents a fairly complex automation challenge. For example, think of Taco Bell for Quick-Service and Chipotle for Fast-Casual operational examples. We are particularly interested in the Quick-Service operation model, where during peak hours; a high-volume location produces between 300 and 400 orders over a period of 120 minutes.
Current systems use overhead-mounted flat-screen displays specialized keyboards called bump-bars to interact with the food orders that have to be prepared. Using the bump bars, the staff will mark items or the orders as ready to serve, recall orders that need modification, accessing instructions about how to make or assemble a food item, or accessing nutritional information, among other tasks. This presents a challenge for the staff, with lots of hand-eye movement, sometimes difficult for people who are of low or high stature or who have vision problems.
Objective
Our desire is to experiment with Google Glass as a device to provide the same interaction options as the video/bump-bar combo, but using the features that Google makes available for its Glass devices. You will get the opportunity to learn how to develop applications for the Glass platform (“Glassware”) and create a prototype product that may eventually be used in live systems all across America.
Description
We will provide students working on this project with Google Glass devices programmable using the Glass Developer toolset (https://developers.google.com/glass/design/index) so that, working with assistance from XPIENT engineering staff, they may determine the feasibility of and develop a working prototype showcasing the use of Glass as a Kitchen Display Video. XPIENT will also provide working POS systems to produce order information in support of developing and testing the resulting Glassware application. You will have to document challenges, solutions, workarounds and limitations as found throughout. Students are free to use any template code available (provided that they do not violate any third-party license restrictions), or can create software solutions from scratch.
We suggest a division of work in 2 phases:
Phase 1: Explore Glass, Determine Requirements and Design
This phase involves getting familiar with Glass, Glassware, its Design Principles and the Glass API. This phase also includes designing and documenting a solution approach, assisted by XPIENT staff. The expected results of this phase are:
- Glassware implementation approach
- Feature list to implement (selected from the multiple options researched with XPIENT assistance)
- High-level design of the application
- Demonstration code/test implementations, as required by the exploration
- Supporting documentation
Phase 2: Solution
Phase 1 pays off here, as in Phase 2 you will build a functional prototype of a Glassware Kitchen Display System. During this part of the project you will use your design and chosen approach to construct a software solution integrated into Glass. The expected results of this phase are:
- G2KDS Glassware Prototype
- Documentation describing how the system was designed, implemented, and tested, including implementation details that you discovered, issues found, limitations of the platform and any solutions to these issues you’d like to recommend.
Bandwidth On-Call Escalation Manager
Problem Statement
As a telecommunications company, Bandwidth must maintain the highest possible availability of its services. The software development team at Bandwidth currently manages its oncall rotation using a spreadsheet and a manual process. There is a primary and secondary on-call phone number that our Network Operations Center (NOC) will call in the event that something goes wrong. These numbers forward to whomever is assigned to primary or secondary oncall duty.
This current solution presents several pain points:
- It is the responsibility of oncall team members to configure forwarding of the primary/secondary oncall number when they start duty.
- There are currently only two people that can be called. If primary and secondary on-call don’t answer, what is the NOC supposed to do?
- Maintaining the spreadsheet of who goes on call when is error-prone.
- Knowledge of both primary and secondary on-call phone numbers is required. This adds additional training required for NOC employees.
- Oncall team members might forget that they are on duty, which leads to late night calls to somebody who is not on call.
The Solution
For our Senior Design project, we’re looking for a team to build a system to automate oncall escalations for companies, like Bandwidth, who offer 24x7 operations support. The system shall understand multiple staff groups for multiple applications that each have their own calendar of oncall responsibilities. Each staff group will have an associated phone number that when dialed by the NOC will automatically route the call to the current primary oncall staff member. If the staff member does not answer the call, the system will next dial a secondary oncall staff member.
This will be a webbased application, that you’ll build using Node.js, HTML, and Javascript. Bandwidth’s web services provide REST APIs that you’ll utilize to handle all of the telephony aspects (it’s really quite easy). You’ll create a web UI that allows escalation groups to be created and managed, and allows users to establish the schedule of oncall duties in advance of an escalation event occurring. When an escalation happens, your application will use the
Bandwidth APIs to initiate a call to the staff member on duty.
Once this initial phase of the project is working, there are many avenues for further enhancement such as:
- Creating the phone call as a multiparty conference that many users can join
- Building a web interface for managing conference call attendance to add other relevant staff members as necessary
- Automatically sending text message notifications to other interested parties so they can optionally join the conference call
- Tracking time spent by oncall employees so we can appropriately reward them for their afterhours efforts
About Bandwidth
At Bandwidth, we've made a business out of disrupting the telecom industry. We're the voice network behind innovative brands like Google Voice, Skype, and Pinger, and we've created the country's bestvalue wireless plan in Republic Wireless.
Our corporate headquarters is located on NC State Centennial Campus. Each semester, we strive to deliver a Senior Design experience that mirrors our modern inhouse development process. You’ll have frequent onsite design and collaboration meetings with our software engineers, and follow an agile software development process that uses our leadingedge engineering tools. You’ll also have a chance to learn new technologies and skills that will be valuable resume enhancers as you approach graduation. This project will provide an authentic and exciting professional engineering experience.
Problem
The Windows 8 touch-enabled table device in our company’s lobby is non-functional. When visitors view it, they are immediately disappointed that it is not responsive – which leaves a bad impression. It does not show off our company information, assets, culture, or present ourselves as a technologically focused company.
Inspiration
While looking for alternatives for what can be done with this device, we came across a project at Carnegie Mellon University (http://www.etc.cmu.edu/projects/surfacescapes/index.html). A group of students at the CMU’s Entertainment Technology Center created a proof of concept application for playing a tabletop Dungeons & Dragons game.
Video of their work can be seen here: http://vimeo.com/11471075. What they produced was very impressive. The Table could recognize objects (miniatures) placed on the Surface, place them on a map, create custom and contextual displays for each player, calculate all aspects of the game for the players – including virtual dice rolls, and engage multiple players at the same time in the same environment.
That level of engagement for our device would be amazing for our visitors and boost their perception of our company. NC State has an excellent pool of students with a broad range of skills that could produce something memorable and engaging for our device.
Proposal
For this year’s Senior Project, we propose that the NCSU students create an interactive application for our Windows 8 touch-enabled device, such as a game or interactive information kiosk – where visitors to our offices can sit and entertain themselves as they wait in the lobby – creating a positive impression of the experience.
Expectations
The students will have the responsibility of learning the specifications required for such an application. They must obtain and learn how to use the MS Windows 8 API to create their software. They will also be expected to come up with the idea for the experience, whether it be a game or some other interactive software. Finally, the students will be expected to complete the application in the time available.
Considerations
Since this device is in the lobby of our company – its primary audience will be visitors to our offices. They will more than likely only have a short amount of time in the lobby, before they meet with whoever they came to see. This inevitably means that they will have only a few minutes – 15 at the most, to engage with the device.
This kind of time limit requires that application be casual in nature – more akin to a casual game available for a mobile phone, rather than a game designed for a tabletop. A visitor should have the same great experience whether they have 10 minutes at the device or even 1 minute. For an example of many of these kinds of simple interaction games, see Orisinal.com.
The application should make use of the device’s most engaging aspect – the ability to interact and respond to a user’s direct touching of the screen. The students should explore a variety of options to interact with the table – single finger, multi-touch, detectable objects, etc.
Another feature that should be taken advantage of is that multiple people can be sitting around this table at the same time. The application should be able to intuitively incorporate several users of the table, interacting with the application environment and with each other, concurrently.
Lastly, our company is a financial company that makes great software. The application should reflect that identity. It doesn’t necessarily mean it has to be a financial simulator of some kind or a complex economic role playing game, but some connection to the world of Investor Relations, Equity Markets, IPO’s, or finance in general would be ideal. Even rebranding a simple game with appropriate financial visuals would be a good start. Another option is to create an interactive visualization of some aspect of our data. We have some ideas in mind and will share those ideas with students before the initial sponsor meeting.
Conclusion
This is the kind of project that benefits everyone involved. The students get to work with very interesting technology, create a visually impressive application, and design an engaging experience. They get to apply not just coding and development skills, but also possibly game design, user interface and user experience design. And of course, Ipreo gets something useful which generates a positive opinion of our company.
Collaboration Instrumentation
In order to understand the way teams of people collaborate when answering a question, measurements of the collaboration can be made, and there are many choices of measurements available to the researcher. For example, audio recordings and an analysis of the transcripts can lead to an understanding of the ad hoc verbal collaboration. Recently a study was undertaken of a 3-person team collaborating to answer a question. Each person had a laptop that was instrumented to collect the text queries entered into a search engine, e.g. Google, and the URLs of links followed. Additionally, screenshots were taken whenever the person clicked on a link, highlighted text passages or otherwise engaged with the data displayed on the screen. Finally, each person was “mic’ed” so that an audio recording (and subsequent transcript) for each person was available to the researcher studying the collaboration. All of this data was put into a database and made useable by the researcher.
One important piece of data not measured during these studies is the physical interactions between the persons under study. Researchers engaged in studying collaboration recognize this kind of data as being valuable to a more complete understanding of collaboration. For example, the physical relationship between persons—how different individual behaviors enable or restrict interaction and collaboration, classifying the kinds of physical interactions—can lead to understanding an additional component of collaboration heretofore unstudied.
The focus of this SDC project is to address the collection of physical measurements of a small team engaged in a collaboration exercise. The data should be curated in such a way that a three-dimensional reconstruction of the interactions of the persons from any “reasonable” perspective can be reconstructed and played back (via a VR-like interactive GUI or suitable “video” interface) by a researcher studying the collaboration.
Specifically, consider a round table centered in a cubical room around which three or four persons are seated, engaged in a collaborative activity—they could be simply discussing a topic, playing a card game, or collaboratively answering a question using internet resources: for the SDC project the particular activity is not relevant. In order to make measurements of the participants, the SDC team shall use a suitable array of Kinect sensors – initially up to 4 (but a compelling argument may lead to more) – positioned in the room so as to provide adequate coverage of the participants such that a three-dimensional reconstruction can be made.
The initial sequence of “deliverables” include:
- A means for determining the proper placement of multiple Kinects and the alignment of each relative to the others and the scene being measured;
- Collecting data from each Kinect and putting it in an appropriate database. Initially the target is a Windows platform, but the stretch goal is an Apple platform (using, e.g. http://blog.nelga.com/setup-microsoft-kinect-on-mac-os-x-10-9-mavericks/);
- Creating a three-dimensional rendering system from the collected data such that a researcher can reconstruct the subject interactions from any desired angle, e.g. place a virtual “camera” at some three-dimensional point in space a pointing it in a direction. Any limitations to this capability should be explained and documented. Putting this in a Unity Game engine framework is a suggested approach, and may require developing an application for translating from Kinect data representation to the Unity framework.
Given suitable time and depending on the experience level of the students stretch goals can include
- Developing a coordinated multi-modal instrumented collaboration system that integrates the Kinect-based measurements with an existing measurement system including audio, URL link sequences, search engine queries, etc. This may be as simple as coordinating a time-stamp between measurement modes and databasing the observations.
- Given multiple sensor-modalities, integrate all measurements in the Unity Game engine replay system enabling the researcher to create reconstructions of collaboration activity from different perspectives/camera viewpoints.
Contact Grabber
Extracting contact information from email signature lines.
Description
“Contact Grabber” will implement services and algorithms that will parse emails to extract out contact information from the signature line and email header. It will use the extracted information to return a contact object which includes the following:
First Name
Middle Initial
Last Name
Email Address
Company Name
Address
Office Phone
Mobile Phone
Home Phone
Company Website
Date of Email
Contact Grabber will be implemented to be hosted in a standard application server and will expose its features as RESTful web services via JSON payloads.
In addition to returning the results of a parse, Contact Grabber should maintain a log containing the successful parses, confidence factor, and the contact information. This log should contain enough details to identify signatures and emails that were not parsed successfully so that this data can be used in improving the algorithm. A log aggregation tool like Splunk may be used to view the logged data.
The parsing technology may use regular expressions, and the services should be implemented in such a way that you can extend the service to parse signatures that were not successfully parsed previously. (i.e., the service returned an error).
You should use the Enron email dataset available at http://enrondata.org/ as the dataset for this project. This dataset contains a large amount of emails, each in its own plain-text file, with email headers and body. Other datasets can be used during the development; however, the Enron dataset will be used to measure the success ratio of the service.
Technologies
As a part of implementing this project a few technologies will come in use. The following is a list of some potential (but not limited) technology choices, however, C#/.NET technologies are preferred.
- Programming language and platform
- Java/J2EE
- C# and .NET
- Webserver
- Tomcat or TomEE (enterprise edition)
- ASP.NET 4.5
- REST library
- RESTeasy is a good Java library
- ASP.NET 4.5 has great support for REST in .NET
- JSON serializer/deserializer
- Java: Jackson is the best Java library
- JSON.NET for C#/.NET
- IDE
- Java: IntelliJ Community Edition or Eclipse
- .NET: Visual Studio
Students will be required to sign over IP to LexisNexis when team is formed.
iPython Report Caching Extension (Code Name: MasonJar)
Background
NetApp has developed a web-based collaborative reporting environment for data and performance analysis. This environment is built around IPython, a rich architecture for interactive computing with support for rich-media visualizations. The IPython Notebook is a JSON-file with an array of cells containing python code and output (which can be empty). Since IPython is also rich-media aware, output can contain images, HTML, JavaScript, etc. This collaboration and reporting environment provides engineers data analysis tools to easily explore data to quickly make discoveries and influence product development.
The environment has several tools, one of which is the Report Engine. The Report Engine provides a mechanism for casual users to fill in a form (including, for example, text fields, drop-down boxes, and radio buttons) that is then fed into an existing IPython notebook (designed to expect the form input), executed, and rendered. This allows for casual users to easily obtain a sophisticated report with minimal investment.
The Report Engine is comprised of 4 components:
- Report Template: A special python script (IPython Notebook) that has input parameters passed in from the Report Generator.
- Report Generator: The user facing web app that allows for selecting and generating reports.
- Report Execution: The process that handles executing and rendering the Report Template.
- Report Configuration: An easy to modify INI-style configuration file that is used to populate the Report Generator interface.
Project
The current design of the Report Engine requires that the Report Execution be invoked for every request from the Report Generator. When an engineer chooses to share the report, every request to view the report will have to wait through the process of execution. Each request consumes computer resources and engineers’ time.
The team’s project is to extend the Report Engine to provide a caching framework, the Report Cache, to store and retrieve report results. The Report Engine should utilize the Report Cache when possible to prevent repeating execution when results already exist. Because Report Templates take parameters, two requests for results are considered the same if and only if they are for the same Report Template and the set of input parameters are identical.
For the Report Cache, the team will need to implement following the features:
- Design and implement a file store for cached report results
- Keyed on the report and input parameters
- Provide an API for accessing the file store
- Modify the Report Execution component to
- Check the cache for results prior to execution and
- Cache the results after first execution of a report.
- Detect when a report has been modified and invalidate cached report results
- (Optional) Extend the Report Configuration to allow developers to prevent report results from being cached.
- (Optional) Provide new interface to look at cached report results.
- (Optional) Provide an API to execute a report asynchronously form the Report Engine web application.
The Report Engine and larger environment is written in Python and uses the Flask web development framework. Web page components are built on Bootstrap and several JavaScript libraries. The team members should have some familiarity with Python and web programming. They will be provided with the Report Engine application, dependency requirements, and example Report Templates of varying complexity. The team will have to configure Python test environments and deploy the Report Engine application.
Benefits
The project provides an opportunity for the students to gain experience in designing and implementing new features for a real-life production environment. For NetApp, the caching framework will provide increased performance to the Report Engine by reducing duplicate work and allowing for better scalability of the infrastructure.
Constraint Based Responsive HTML Report Layout
The Problem
Business Intelligence reporting has evolved over the years to become increasingly interactive by taking advantage of web technology advancements. Report content is now more dynamic and viewed on a much broader range of device types and sizes, but the layout of reports has remained relatively static. The onset of mobile first and responsive web design has yielded new techniques for dynamic layout of basic web content, but none are well suited for report layout due to the diversity of data-driven report elements. Report elements include but are not limited to graphs, maps, tables, and filter controls. Each of these have different visual layout requirements, and those requirements can change based on the data they represent. Often a report layout is designed in terms of a grid, or tiles, for a specific reference size and aspect ratio. Reports are less desirable when viewed on devices with different aspect ratios and display resolutions. A non-responsive layout may rely on scrolling to view all of the content, or at best scale the grid uniformly to fit the display. The most common responsive layouts will reposition elements using a grid system as the view is resized, but often this repositioning disregards the intent of the report designer or makes the report harder to interpret. What is needed is a responsive layout that takes the constraints of the designer and of the elements themselves into account.
The Project
The goal of this project is to design and implement a constraint based responsive report layout algorithm. There are various types of constraints that need to be considered, including but not limited to element dimensions, positions, and logical relationships with other elements. Constraints could be preferred values, minimum/maximum values, or relative to other element properties (ie element1.width == element2.width). Constraints may also be assigned a priority ranging from an absolute requirement to important to simply nice to have. This priority setting is used for resolving constraint conflicts. The main deliverable for the project will be the layout engine itself, but an additional deliverable will be a harness that allows for interactive constraint modification and layout testing. The final system should run in the browser utilizing HTML, JavaScript, and CSS. Use of available third party open source libraries will be allowed.
What this project involves is to add constraints as one of the primary parameters when doing responsive layout. We want to make constraints generic enough for our usage. Constraints could be the content it is displaying, for e.g., a container with a pie chart would always retain a square aspect ratio. This will allow us to display better looking content even after doing responsive layout. Other constraints could be max height / width of container or ratio. For example, one never wants widget buttons to look too large and each button could have a max height constraint. Taking this one step further, it could be a nested layout; an example would be a grid full of KPI. In this case, based on KPI it would apply constraints when doing responsive layout.
Bronto Twitter App
Bronto Software offers a sophisticated marketing platform for its corporate clients, tracking billions of events per month. Customer events such as opens, clicks, and conversions (to track revenue) are processed and analyzed in real-time and displayed to our customers to give them a clear view of how their campaigns are performing.
The Bronto platform includes an app marketplace and a 3rd party SOAP API that lets apps interface with other Bronto software. Your challenge is to build an app that collects customer contact information on behalf of Bronto’s clients. The app will do this by listening to the Twitter Firehose. Whenever someone tweets a particular hashtag, the app will create a new contact via the Bronto API. Bronto clients will be able to configure the set of hashtags they would like the app to monitor.
There are many opportunities to leverage this app to offer additional features for Bronto’s clients and their customers. Additional features the team will focus on will be discussed during regular meetings with the sponsor. For example, the team may be asked to implement:
- Raffles - after a set time period has passed, the app randomly chooses a winner from the list of collected contacts and sends an email or tweet, via the Bronto API, to the winner
- eMail address collection - if a user DMs their email address to Bronto’s client, parse the tweet to recognize and extract that email address and add it to the client's account
- Dashboard - showing Bronto clients the number of hashtag retweets, number of contacts collected via twitter, etc
- Your own ideas – the Senior Design team is invited to be creative and propose their own enhancements for this project
This project will involve integration with the Bronto API, light UI elements (not the focus of the project), some analytics for a dashboard display, and general development in Java or Python.
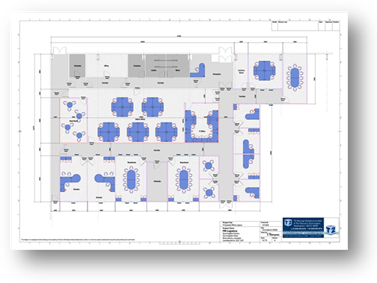
Movin’ Up!
Growing companies and organizations are constantly changing. Adding, moving, and restacking people and teams to different desks, or different floors is a challenge to keep straight. Familiar tools like MS Word, Excel, and PowerPoint are useful but aren’t well suited to helping manage this process. A better and more interactive way is needed.
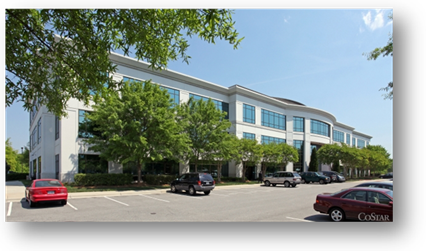
DBGT is growing at a very fast rate. We have nearly doubled in size in 2014 and plan to double again in the next 2 years. We are also constantly shifting people and teams to new areas or spaces as they open up. This takes a lot of planning, documentation, and updating of several spreadsheets, power points, and other internal system information to keep equipment and desks assigned. As the moves are preparing to happen, several different options are reviewed and shared with the various domain leadership for feedback. Once everyone is settled, reports are needed for occupancy levels, equipment usage, etc.
Senior Design Project
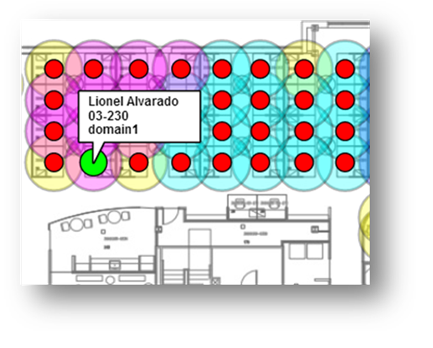
We are looking for a group of dynamic students who can continue the design and development of a user-centric tool to help organize and share the location information in a rich and engaging way. This can then be used to demonstrate, present, and inform products, teams, or organizations about their current and future location. Deutsche Bank can provide code and documentation for the current state of the application, a representative data set(s), and knowledge of our current and future situations, but we need your creative ideas and technical expertise to create a dynamic solution.
Spring 2014 Project
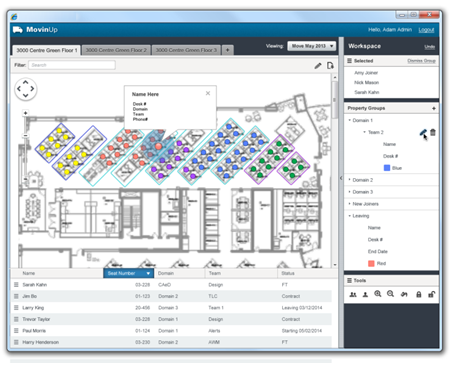
A proof of concept was created and deployed with baseline functionality last semester. There were several challenges with implementing the students’ ideas in the time frame and technical limitations of a corporate environment (e.g., IE8). The students used Java, mySQL, CSS, HTML5, and JavaScript to create a working prototype.
Fall 2014 Project
The fall 2014 senior design team will have the opportunity to extend and refine the prototype in several areas, with the goal of deploying a working version at DBGT. First, the team will need to understand the design and technical choices reflected in the current system. With some constraints relaxed (e.g., now using IE10), some of these choices need to be reconsidered in the interests of creating a more responsive and maintainable application.
This tool is intended to help solve a challenging problem, and presents technical and non-technical design challenges. The team will work with experts at DBGT to identify opportunities to improve the user interface, in an effort to make the tool more genuinely useful. Likewise, adding support for sharing and collaboration will help make the tool more effective. Finally, support for collecting and analyzing usage information will enable continued refinement of the tool.
NCSU Student Experience
Senior Design students in the College of Engineering, Department of Computer Science and industry professionals will have an opportunity to partner together over the course of the semester to continue the development of this office management tool. During this process, students will also learn about design principles and Agile/Scrum practices.
Project
Fujitsu America is one of the top three suppliers of retail systems and services worldwide. Using Microsoft’s .NET development platform, these systems offer a high-performance yet open platform that retailers as diverse as Nordstrom, RadioShack and Dressbarn are able to customize.
With mobile applications becoming key to most businesses portfolios, including retail, Fujitsu is looking to expand the interface capabilities of their Point of Sale (POS) offerings to include RESTful and JSON capabilities. Fujitsu has two primary POS Systems. A project is underway internally to support REST/JSON in our legacy POS, GlobalSTORE. Fujitsu’s next generation POS, Market Place, was built on architecture to support various external and mobile applications.
Fujitsu is proposing a two-part project. Part I in the Fall of 2014 and Part II in the Spring of 2015.
Part I: Market Place Interface Enhancements
For the Fall 2014 project, Fujitsu would like to expand the interface of Market Place to allow building mobile applications using REST / JSON technologies.
As part of this project the team will be responsible for the following:
- Design and implement a RESTful interface that supports the concepts of price enquiry and inventory functions
- Develop connectors to allow this interface to access the following (listed by priority):
- Market Place Interactive Transaction Service (MP ITS)
- Transaction / inventory simulator.
- GlobalSTORE Interactive Transaction Service (GS ITS) *Stretch goal*
- Enhance the CustomerCENTER mobile application (Spring 2014 Senior design project) to provide price and inventory check functions using the new REST/JSON interface.
- Develop a Programmer’s Guide that fully documents the usage of the REST/JSON interface with examples.
- Provide a simple queue busting (quick transactions with mobile device) application. *Stretch goal*
The REST/JSON interface will be implemented in C# using Microsoft components (WCF).
Policy Change Engine
Humana’s goal is to be an industry leader in providing our health care members and health care providers the tools and information that they need, when they need it, and in a way that is meaningful and convenient for them. We want to rethink our routines and challenge our teams to pioneer simplicity.
Change is constant in the health care industry and it is important that Humana is able to communicate efficiently and effectively to health care providers who treat our members. When changes negatively impact how a provider bills or how they are reimbursed for the services that they provide to our insured members, we must provide advance notice at least 90 days prior to implementing any adverse change. It is critical to our health care providers that they can find information about these changes quickly, and easily.
The current notification process is to create the notification statements in an MS Word document and convert to a PDF, which is posted on the public facing portion of Humana.com on a set schedule of five notifications per year. The notification documents are approximately 150 pages each, and growing at approximately 30 to 50 pages each year. The limitations of the current process are limited search functions for the end user, difficulty navigating through 300+ pages of text to find a particular notification, and poor provider experience as providers often complain that they were not aware of a particular notification because they may not remember to check the notification updates regularly.
Project Description
The fall 2014 Senior Design team will design and build a user-friendly repository to store and display the provider notification statements that we make available. The goals of this project are to drive a deeper understanding and awareness of these changes that Humana implements, allow providers to find and review the notifications that are of most interest to them, and to improve communication to providers. In particular, the new system should offer:
- Improved search functionality for providers who need to be aware of changes to billing policies.
- Reduction in redundancy by combining the notifications into one repository with the ability for an end-user to select either Professional or Facility notifications, or both.
- Improved communication to providers of when new changes are posted by allowing Humana to push reminders to providers who opt-in to the email notifications.
- Improved "look and feel" of the notification statements to make them easier to read and provide a more professional presentation of the information.
- Multiple views of the information captured in the repository.
- Internal (review team – all data, all notifications) to be posted on the Humana intranet and not available to external users.
- Internal (all Humana associates – only approved notifications, and limited fields) to be posted on the Humana intranet and not available to external users.
- Providers (external users – only approved notification, with additional limitations) to be posted on the Internet to be available to all providers, and publically.
Students will be required to sign over IP to Humana at first sponsor meeting.
Remote Application Monitor Based on the Internet of Things Technology
Background
The Internet of Things is upon us. The age of interconnectivity between people, systems and the physical world allows product and service providers the capability to monitor, analyze and even predict future service requirements for disparate applications and devices regardless of their locations. Gartner predicts the Internet of Things (IoT) will provide $300 billion in incremental revenue by the year 2020. Cisco states the IoT "creates $14.4 Trillion of value" for companies over the next 10 years.
Many companies will embed proprietary IoT technology into their products. Others will use off the shelf IoT platforms, such as ThingWorx™, to implement IoT into their products. ThingWorx (www.thingworx.com) is an event driven execution engine with a rapid application development platform supporting Java, .NET, C, iOS, and Android. With ThingWorx one can gather unstructured, transactional and time-based data, apply big data analysis and present the information using mashup technology.
I-Cubed’s project will involve using the ThingWorx platform to extend Internet of Things functionality into computers used for loading client CAD data into Product Lifecycle Management systems.
Problem Statement
I-Cubed has a client-server application called Legend that loads CAD data into Product Lifecycle Management (PLM) systems (see Figure 1). The Legend Load Master manages a number of Load Clients—which are separate computers or VMs that do the actual work of loading CAD data into a PLM server—via SOAP. In actual engagements a given load can run for many hours. It is critical for the user to know the status of the Load Master and the Load Clients even during off hours . The problem is to create a monitoring system that informs the user if a Load Client becomes inoperative or if the success rate for loading drops below a reasonable threshold--say 80% success rate.
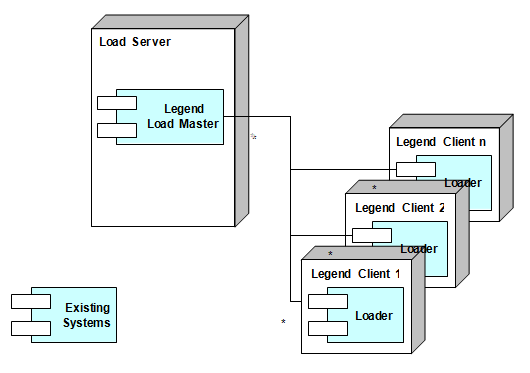
Figure 1. Existing Loader Application
Requirements
- The monitoring solution is to be built on the ThingWorx platform.
- Monitor output will be accessible from a mobile device.
- The monitor will show:
- Number of active clients
- The overall rate of processing (number of CAD objects loaded per hour)
- The individual rates for each application client
- The success rate of the requests (number of CAD objects successfully loaded against the number processed)
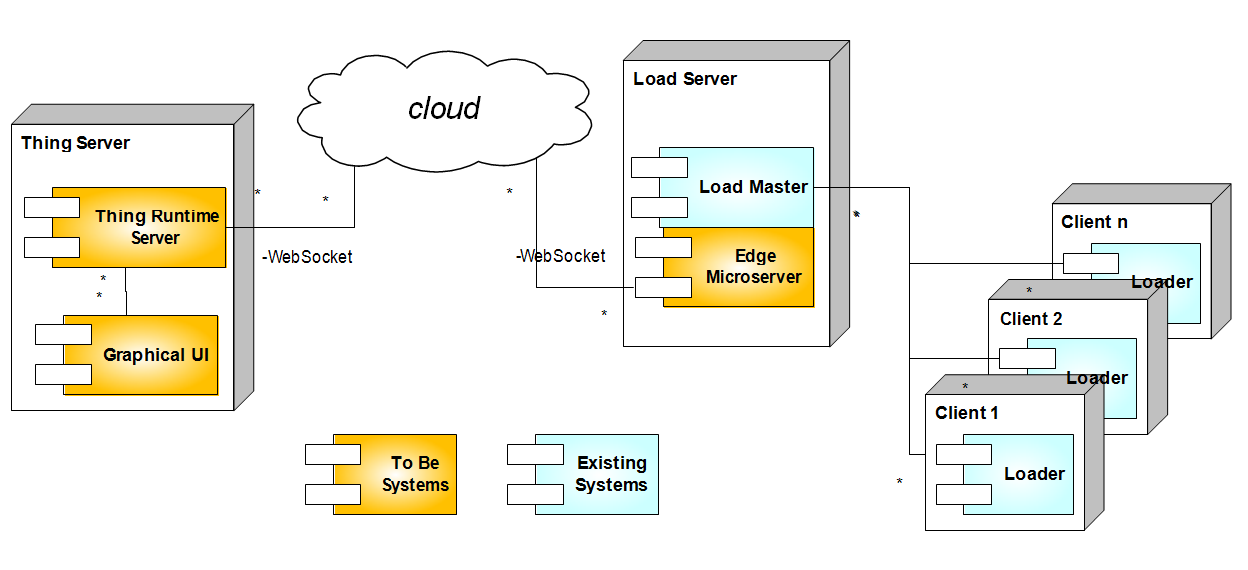
Figure 2 - High Level System Diagram
Description
Figure 2 shows a diagram of a potential solution. The Edge Microserver would gather request and response data from the Load Master. The team can choose the method of gathering data. Monitoring log files or inserting methods into the Load Master source code are two possible ways.
The team will use the ThingWorx Composer to create the business logic on the ThingWorx Runtime Server to handle the data gathered from the Edge Microservers. The team will also use ThingWorx tools, SEQUEL and Mashup Builder, to create the information to be shown through the GUI.
Legend is Java application that runs on a Windows 7 platform. Source code will be provided, if required. The Legend Clients provided to the team will be part of a test harness that can simulate different load rates and success rates. Access to the ThingWorx Runtime Server and training materials will be provided to the team.
ThingWorx, Composer and SEQUEL are a trademark of PTC.
Risk and Vulnerability Assessment Management Program (R-VAMP)
Overview/Background for Project
At MetLife, our vision is to be One MetLife, recognized as the leading global life insurance and employee benefits company. The largest employee group within MetLife is GTO or Global Technology and Operations which supports numerous functions, one of which is Global Corporate Security. As one of the world’s largest insurance companies, we have over 1400 offices in more than 45 countries. In Global Corporate Security, our responsibility is to protect MetLife’s brand, assets and people around the world. An important part of our team’s value is establishing security standards for our facilities and then performing site assessments against them to identify exposure before an incident occurs.
The Senior Design team will build "R-VAMP", a web-based tool that will be utilized globally by MetLife personnel to quickly and uniformly assess risk at each site and measure compliance with risk-based security guidelines and standards. Test data will be provided by MetLife and access to our actual development environment will be set-up as if you were a technology employee for Met. The tool you are building will be moved through our standard development and testing cycles as well.
Because of the high volume of assessments that will be performed by various on-site users, the critical acceptance requirement is that the tool should require minimal to zero instruction to use. We have an existing set of excel spreadsheet containing the risk assessment methodology and associated security guidelines and standards. These documents will be leveraged for their content as we build a transactional website to support the assessment process. The product will be beta tested by a small group of internal users and will eventually be deployed worldwide. The program will drive Facility Site Level risk assessments, and measure compliance with security guidelines and standards that are associated with the facilities based on risk. The tool will create recommendations for improvements that will include cost and implementation timelines and reports will be generated which will be utilized by local, regional and global decision makers. This product will establish both the short and long term objectives of the Corporate Security team with output used at the highest levels of MetLife.
The technology platform on which we develop this will be determined in initial design discussion meetings with our technical architects as we would with any solution so students can experience the decision criteria that goes into that.
Requirements/Project Description
Information provided will include MetLife facility locations and building codes along with the existing spreadsheets currently developed for data collection and analysis as well as security guidelines and standards. The tool developed will ultimately be populated by the end-user at each facility over an extended period of time.
The product will function in several steps.
Step One – Authentication – Log into application
Step Two – Assess Risk – Users will answer approximately 50 questions regarding risk and will score each question 1 – 4 based on significance. An excel form has been developed and contains all of the methodology logic and instructions for completion. Upon answering the questions, a risk score of 1 – 4 will be generated for each facility with 1 being low risk and 4 being high risk.
Step Three – Compliance Measurement – Once the risk score is generated, uses at each facility will receive an automated security compliance checklist that corresponds to the facility risk score (1 – 4). Low risk facilities will have minimal security compliance requirements while high risk facilities will have extensive security requirements. The compliance requirement and measurement tool has been created for each facility type using excel. There are up to 200 questions for high risk facilities. Users will assess their compliance with each security requirement thus generating an overall compliance score for the facility. For areas of deficiency, recommendations will be developed to obtain compliance. Recommendations will have cost estimates and implementation timelines.
Step Four – Reporting – Reports will be generated for local, regional, national and global leaders.
This application will be available within the MetLife intranet only.
Documentation
We will provide business requirements, risk calculation spreadsheet, security guidelines and sample reports. We ask that students support both an analyst role for functional specifications and then a developer role for technical specification (ideally this is at least two separate students.) The analyst role would then provide quality assurance testing of the product against the functional specifications after which it is handed over to the business for user acceptance testing.
Deliverables to be submitted include the following, templates to be provided for each:
- Project Plan with bi-weekly updates
- Functional Specifications
- Technical Specifications
- Unit Test scripts with results
- Quality Assurance Test scripts against the Functional Specifications with results
- Fully commented code
Anticipated Benefit to Students
This is a real world tool supporting an area that is common to Fortune 50 organizations, Corporate Security. By the completion, the students involved should have a functional understanding of what risks and vulnerabilities corporations tend to focus on and how we use data to drive capital investment. More importantly, they will also get experience with delivering solutions according to a standard SDLC in a development environment.
The students will interface with senior management at MetLife who are fully supportive of developing talent.
Will the students be required to sign over IP to MetLife?
Students will be required to sign over IP to MetLife at first sponsor meeting.
Project Archives
| 2026 | Spring | Fall | |
| 2025 | Spring | Fall | |
| 2024 | Spring | Fall | |
| 2023 | Spring | Fall | |
| 2022 | Spring | Fall | |
| 2021 | Spring | Fall | |
| 2020 | Spring | Fall | |
| 2019 | Spring | Fall | |
| 2018 | Spring | Fall | |
| 2017 | Spring | Fall | |
| 2016 | Spring | Fall | |
| 2015 | Spring | Fall | |
| 2014 | Spring | Fall | |
| 2013 | Spring | Fall | |
| 2012 | Spring | Fall | |
| 2011 | Spring | Fall | |
| 2010 | Spring | Fall | |
| 2009 | Spring | Fall | |
| 2008 | Spring | Fall | |
| 2007 | Spring | Fall | Summer |
| 2006 | Spring | Fall | |
| 2005 | Spring | Fall | |
| 2004 | Spring | Fall | Summer |
| 2003 | Spring | Fall | |
| 2002 | Spring | Fall | |
| 2001 | Spring | Fall |