Projects – Fall 2015
Click on a project to read its description.
Number Porting Authentication Service
When you change your phone provider, and take your phone number with you, a complex and error prone process takes place to update the Public Switched Telephony Network (the PSTN) so that future calls will route to you via your new provider. This process is called, number porting.
One of the common hang-ups of number porting involves validating that you truly own the phone number that you are attempting to move to your new provider. Think about it... somebody walked into an AT&T store and expressed a desire to move your phone number from Verizon to AT&T. How does Verizon know that it was really you? More often than you'd think, somebody is actually attempting to steal your number.
The phone industry has adopted a set practice for authenticating a number port, but they are all cumbersome. Strangely, none of them involves the very obvious solution of having your old provider ask you whether you indeed initiated this process.
For this project, you will implement this alternative approach for Bandwidth. You will build a web service that will send a text message to a phone number when it is requested to be ported away from Bandwidth. The recipient of the text message will simply reply "yes" in order to authenticate that the true owner of that phone number (or at least the person currently possessing the phone) has requested that the number be ported. When you receive the reply, you will capture the details of the exchange in a serialized format and digitally sign it before delivering it back to the system that initiated the process.
As time permits, you will expand the application to support the same flow with traditional voice phone calls. If a text message is undesirable, the application will simply call the phone number and play a recording that says, "press 1 if you want to move your phone number." Once that piece is working, we will consider adding multi-tenancy that would allow this service to be valuable to more telephone companies than just Bandwidth.
For this project you will work primarily in JavaScript, utilizing Node.js as the server-side platform and Angular.js for any client side UI. You will utilize Bandwidth's telephony APIs for sending and receiving text messages and or making phone calls. You will host your application and your data in the cloud using PaaS services such as Heroku or OpenShift.
You will also work closely with Bandwidth engineers. We will collaborate utilizing industry-leading agile processes, giving you a real-world experience that goes well beyond the code that you're writing. Bandwidth headquarters are located on Centennial Campus, making it easy for us to meet weekly to iterate on designs and code and to ensure we're building a great product. In the process, we're sure to have a lot of fun together.
About Bandwidth
Bandwidth is an innovative provider of next generation communication services that are helping change the way that people across the world communicate. We're the Voice Over IP platform behind services like Skype and Google Voice. We also built and operate the Republic Wireless mobile phone service, which is disrupting the mobile phone industry with its Wi-Fi-first approach to mobile communications. We're a software company that is revolutionizing the telecommunications industry by powering the companies who change the way we communicate.
Data Visualization of Finance Systems Integration
We have a large number of systems/applications within Boeing Business Systems. This results in a significant number of interfaces between the systems. Understanding which systems are interacting and what data is being passed is very important.
This project is to evaluate options and develop a data visualization of the interfaces between systems. This should be a web application and the students would be expected to choose the technology stack (with input and guidance from Boeing). Students should feel free to leverage any open source tools or code.
The goal is to provide a visualization that makes the presentation simple and informative. The view should provide information such as:
- What systems integrate with each other?
- What technologies are used for each integration?
- What data is being passed?
- For the data being passed, is the source system the authoritative system?
- Is the integration considered internal or external?
The data visualization should address the items above and the students will decide how best to display the information and if it is a single view or multiple views. The team (students and Boeing together) will evaluate the options to decide on the most useful display.
Students will be provided the following information:
- A list of systems
- Identification of what systems are internal versus external
- A list of integration points between systems
- Technologies used for each integration
- Fields included in each integration
- Authoritative owner of the data
The main focus of the project is the visualization of the data. But there are supporting pieces that will be required (such as the storing of the data and the ability to update/add data). Students will be expected to:
- Evaluate visualization tools and technologies and work with Boeing team to make selection.
- Develop a prototype to best depict the information provided for the integrations.
- Decide how best to store the data.
- Provide an interface to update the data and to add to the list of integrations.
Students will be required to sign over IP to Boeing when team is formed.
Web-based Flow Chart Editor
Flow Chart is a Web app that allows its users to visually create flow charts by selecting various components from a toolbox to create workflows. Primarily targeted for lawyers, the workflow app allows them to automate certain routine tasks so that they can focus more on other important tasks.
The toolbox of a flow chart editor should have components for:
- Entry Criteria: This will have criteria which kick off the flow chart. You have to have another control associated with the output of this control.
- Decision Control: This has two outcomes of Yes or No. Both outputs have to be associated with some other control.
- Foreach: Typically used for executing an action over multiple values of a collection.
- While: Used for iterating over and over again until a certain condition is met.
- Set: set a value to a specific field. The setting of the field can trigger some action like generation of an email or notification. The output from this control has to be associated with another control.
- Delay: Add delay of certain minutes/hours before proceeding to the next step. The output from this control has to be associated with another control.
The idea of the toolbox is to let a user select various controls to create a flow chart based on his/her needs. The project is not about executing the flow chart but collecting all the data needed to kick off the execution. Behind the scenes the data will get stored in JSON format so that it's easier for another system to consume and process that data.
Goals
- Create a rich set of tools that a lawyer can use to generate flow charts to automate tasks.
- Generate all the decisions and flow in JSON format. The JSON output can be stored in file format or in a database.
- The UI should be able to retrieve a previously created JSON workflow and display the flow chart generated by the user earlier.
- A user should be able to clone an existing workflow to start a new workflow.
- The flow chart editor should be touch friendly.
Technology
- Use typed parameters and variables for storing all the information.
- It should be a web control like Kendo.
- It should use client side MVVM.
A good example of a flow chart is when a lawyer creates a specific kind of document for a case. Based on that document creation, the lawyer would like to automate the subsequent tasks that involve sending an email to the paralegal to review the document, waiting for the review for a few days, and then sending another reminder email to the paralegal. If the court date is nearing, then send another high profile email to remind the paralegal for review. The task is complete when the paralegal has reviewed the document. Using the flow chart editor, the lawyer should be able to automate the entire task which can be pictorially represented as below.
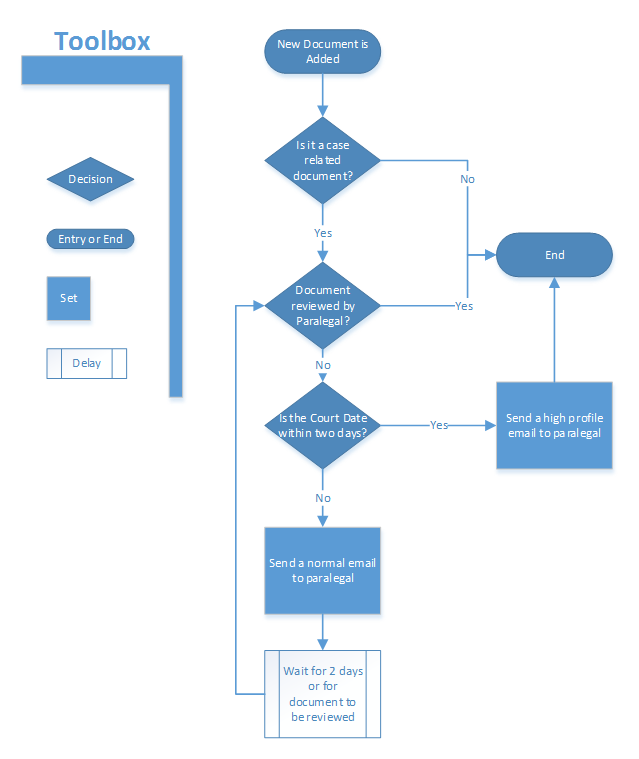
More such flow charts can be created for calendaring rules, Intake forms, auto-communications with clients etc.
Students will be required to sign over IP to LexisNexis when team is formed.
OpenUI5 Calendar Component
The goal of this project is to build an OpenUI5-based calendar component with robust APIs to be used in Enterprise Solutions. There are currently no OpenUI5-based calendar views which show scheduled events and their details. An OpenUI5-based view is needed to seamlessly integrate with the other OpenUI5 components we use in our custom applications.
The architecture of the component must be one that considers re-use at the very core from both the component developer's perspective (making sure any similar functionality across the different views is packaged such that all views can reuse it) and the consuming app's point of view (thinking of how a consumer would want to customize the component as well as manipulate it programmatically). Development should follow OpenUI5 guidelines at https://github.com/SAP/openui5 so that the code could be contributed back to OpenUI5 or made available as an Open Source library. The design should be reviewed with SAS UX periodically to ensure it fits the interaction paradigms and overall layout of SAS applications so that it can be integrated seamlessly into any application.
- The component should function completely in the browser using a Javascript accessible model without any required backend technology. The project team can use a backend for development and testing, but the component should not require it.
- The component needs to be themeable, which is driven via external CSS. More precise CSS constraints will be provided later.
- Accessibility support (screen readers such as iOS Voice Over and JAWS)
- Localization support (follow OpenUI5 standards)
- Documented APIs
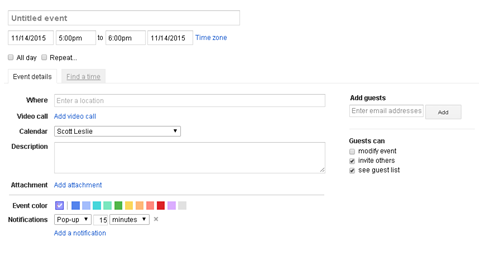
The Calendar Component will support four main views: Daily, Monthly, Weekly, and Gantt (see Figures 1-5, below). The Daily and Monthly views have priority, but also implementing the Weekly and Gantt views is preferred. This should be taken into consideration during design of the API and models (extensibility).
Feature highlights
- Ability to display the calendar based on the input data provided (XML or JSON).
- Consuming solutions should be able to update the data model for the calendar and the UI will refresh with the new data without refreshing the page. The control should follow SAP data binding guidelines
- Date Range filtering appropriate for each view.
- Global & My View of calendar (view items from all users vs. current user). This may require binding multiple models to the view.
- User should be able to add a new calendar entry to the data model (JSON or XML) attached to the calendar.
Additional considerations for the Gantt View
- Additional modelling will be required in the JSON or XML model for the calendar to support displaying optional hierarchies for entries in the Gantt view.
- Users can zoom in or out using the slider.
The team assigned to this project will receive a document with more detailed requirements and specific constraints for the system in general and for each of the views before the initial sponsor meeting.
Figure 1. Daily View
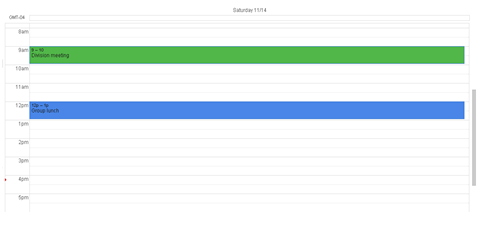
Figure 2. Weekly View
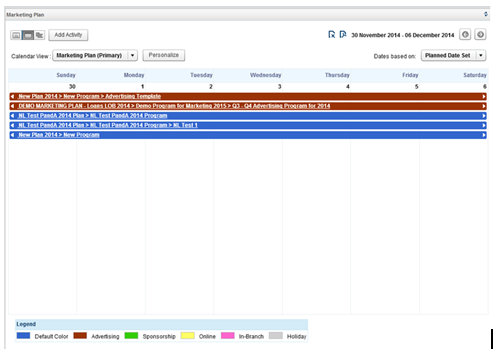
Figure 3. Monthly View
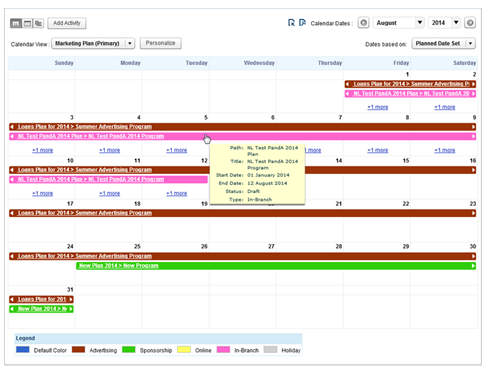
Figure 4. Gantt View
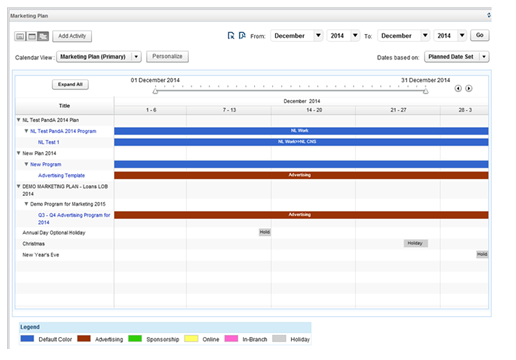
Figure 5. Add Event
Watson
Problem
Intelligent Virtual Assistants (IVAs) mine unstructured data to derive insights that allow them to answer human language queries. However, many of the more important queries cannot be fully answered without the inclusion of structured data. So this project will look at how best to include structured relational data (such as is commonly stored in relational databases) into the question and answer functionality of an Intelligent Virtual Assistant.
Solution
The solution will have the following characteristics:
- Will interact with IBM Watson using the public Healthcare corpus or other similar. (Watson is an IBM platform that can be leveraged to provide an IVA. We can share a simple demo with partial functionality to illustrate.)
- Will be able to provide answers that are specific to an individual's current status and details.
- This status and detail will be stored in a data store that is separate from the Healthcare corpus. This data store will contain realistic dummy data (no PHI or confidential data for actual customers).
- Example questions:
- How much do I have left on my deductible? (needs to detect that structured data from another system is required, then retrieve specific financial amounts from the other system, then integrate it into response sent to user.)
- Which medication for (condition) will cost me the least under my current plan? (needs to look up person's health plan, coverage amounts, then apply those to the medication in question, and form a response to send to the user.) (please note: the approaches described here are for illustrative purposes only and not intended to limit the thinking or approaches that students may want to leverage)
Key Takeaways Expected/Questions to answer
Think of these as challenges you could take on. Teams are invited to take on one or more of these.
- What are the recommended methods for integrating structured data from a separate data store into the question and answer functionality of an Intelligent Virtual Assistant.
- What are the limits of reliability for this approach? Are there cases where queries could return misleading responses? (technical risks, not asking for advice on legal liability)
- How does the use of structured data impact the approach for "training" the Intelligent Virtual Assistant?
- What additional design or implementation requirements will the structured relational data store have to support in order to integrate most effectively with the Intelligent Virtual Assistant?
- What can you learn about the best methods for getting good answers to Watson? Are there certain rules or approaches that provide more accurate answers than others?
- What are some creative applications or uses for Watson that could provide a new way of solving a healthcare related need or challenge?
- Are there applications that could be layered on top of Watson that could provide additional value or a better way of doing something?
Students will be required to sign over IP (and NDA) to BCBS of NC when team is formed.
The Internet of Everything: Connect the Unconnected
Project Background
While the Internet is not a cure-all, it is the one technology that has the potential to rectify many of the challenges we face. Already, the Internet has benefited many individuals, businesses, and countries by improving education through the democratization of information, allowing for economic growth through electronic commerce, and improving business innovation by enabling greater collaboration.
So, how will the Internet evolve to continue changing and improving the world?
Cisco defines the Internet of Everything as bringing together people, processes, data, and things to make networked connections more relevant and valuable than ever before — turning information into actions that create new capabilities, richer experiences, and unprecedented economic opportunity for businesses, individuals and countries.
Project Deliverables
The focus of the capstone project is to recognize innovators that can help change the world by re-inventing the manner in which unconnected people, processes, data and things are connected. We are requesting that students propose and develop innovative technological ideas, technology-based prototypes and proof of concepts (PoC) to perpetuate the goal of "Connecting the Unconnected."
Example IoE Use Cases
Connected Fridge
Wouldn't it be nice if your fridge knew exactly what, and how much, food it contained? What if your fridge and phone could sync together and notify you of the groceries you may need. What if it could calculate the recipes you could cook with the contents that your fridge currently contained? The Internet of Things can solve this by connecting the contents in your fridge with recipes and ultimately relay this information to your phone.
Stop Driving in Circles!
Finding a parking spot is a pain! What if your phone could tell where, based on your current location, you are most likely to find an open parking spot? Think of the amount of time you would save if you knew exactly where to park. Not only would this save you time, but the city would benefit by the decrease in traffic caused by cars constantly stopping and driving in circles looking for parking spots. Based on historical data, and using predictive analytics, create a connected parking application that will inform its users where to park during busy times of the day.
Wireless Lighting
What if your house knew exactly when to turn on the lights based on past history of when your lights were turned on/off? Not only would you save time, but your energy consumption would decrease dramatically. Combining machine learning techniques with motion sensors/energy sensors, provided by Cisco, create an application that will automatically turn your lights on and off.
No-More Wilting Plants
You put so much time into growing your plants to the point of harvesting. Sometimes, due to your schedule and forgetfulness, your plants are neglected which results in wilting and, ultimately, a delay in the time it takes for your plants to grow to the point of fruition. What if your phone could notify you of when it was time to water your plants? Using moisture and heat sensors, provided by Cisco, create an application that connects your garden to your phone.
Monitoring/Managing Stream Usage
Background
Data Domain is the brand name of a line of disk backup products from EMC that provide fast, reliable and space-efficient online backup of files, file systems and databases ranging in size up to terabytes of data. These products provide network-based access for saving, replicating and restoring data via a variety of network protocols (CIFS, NFS, OST). Using advanced compression and data de-duplication technology, gigabytes of data can be backed up to disk in just a few minutes and reduced in size by a factor of ten to thirty or more.
Our RTP Software Development Center develops a wide range of software for performing backups to and restoring data from Data Domain systems, including the Data Domain Boost libraries used by application software to perform complete, partial, and incremental backups and restores.
As Data Domain makes its way into even more data centers, the need to accommodate additional workloads is increased. Customers must be able to backup their data efficiently to meet constantly decreasing backup time periods. Multiple customer systems may be backing up data to a single Data Domain system simultaneously. The different backups may require different amounts of resources from the Data Domain system and place different loads on the Data Domain system. One such resource is streams, representing the number of files being actively backed up at any time by the backup application. Streams are a limited global resource provided by the Data Domain system and shared by all backup applications using the Data Domain system. Currently there is no means for different backup applications to coordinate their usage of stream resources. The focus of this project is to implement in the Boost libraries used by the backup applications a method of monitoring and managing stream usage among multiple applications so that stream usage can be monitored and managed among the applications. Students will devise and implement a method of tracking the streams used by a backup application and managing this usage between multiple backups, taking advantage of existing interfaces provided by the Data Domain Boost libraries. The purpose of the prototype is to demonstrate how stream resource usage might be better monitored and managed to improve overall backup performance without requiring any changes in the backup application software or to the Data Domain system.
Project Scope
We want to develop a simple prototype library in C that will act as a shim layer between the existing Data Domain Boost library and a backup application. This extra layer will implement the same interface to the backup application as the current library does. This new shim layer will monitor the stream resources available from the Data Domain system being used for backups, keep track of the streams used by the backup application, and share the information on streams used and needed by the backup application with other backup applications so that the backup applications can coordinate and manage stream usage among the applications. The goal is to be able to apportion the streams among the backup applications in a way such that all the backups receive the needed number of streams to complete their backup in an efficient and timely manner.
Sharing stream usage information among multiple backup applications will require implementing some method of sharing information between the backup processes, such as Linux shared memory segments, memory mapped files, etc. The new shim layer will need to implement some such mechanism for sharing each backup application’s stream needs and usage, and for updating this information appropriately so that all backup applications can access it. The new shim layer will also need to provide a means to update this shared stream usage data when backup applications start using a stream and finish using a stream.
When the application opens a file for writing a backup or for reading to restore a file, the shim layer will check the current stream usage of the application and other applications, and the current availability of streams on the Data Domain backup system. The shim layer will need to decide whether to allow use of another stream, based on the application’s current stream usage, the stream usage of other applications, and the streams available on the Data Domain system being used for the backups.
When a file is closed the shim layer will update the stream usage information to indicate the stream is no longer being used. This may make the stream available to the backup application closing the file, or to other backup applications depending on the current stream allocations and usages.
For the purpose of this prototype, the backup/restore application can be combined with the new shim layer. Source code from previous projects may be provided that can be used as a starting point for the backup/restore application. These sources can be modified appropriately to incorporate the new stream monitoring and managing features.
The project being proposed consists of two phases: (1) creating the shim layer with the optimized random writes and creating/modifying a backup application that performs random writes, and (2) evaluating the performance of the new shim layer.
Phase One
Design and implement the basic shim library that automatically monitors and manages stream usage in a basic backup application. The library should:
- Be able to monitor and manage the stream used and needed by the backup application, and share this information in a manner that can be used by other backup applications.
- Monitor and track the streams available from the Data Domain system being used for backups.
- Record in a stream usage log file stream usage information at appropriate intervals and on occurrence of stream usage change events.
- Coordinate the usage of streams among all the backup applications on a client system.
- Allow configuration of any relevant parameters, for example the expected or maximum number of streams the application can use, the priority the application should have to the available streams, etc.
- Be written in C for a Linux environment, but be readily portable to other Unix-like environments as well as Windows. This means OS-specific functions should be avoided to the extent possible, and if used kept separated into specific OS dependent modules that can be replaced for other environments. The implemented library need not be run on or tested on anything other than a modern Linux system.
Phase Two
Phase 2 is an open-ended evaluation, performance measurement and analysis phase using the monitoring & managing library and application produced in Phase 1 to do one or more of the following. How many and which of these items are done will depend on the capabilities of the software developed in Phase 1 and the time and resources available after Phase 1 is completed.
- Determine the performance effects (e.g. backup time, network bandwidth) of the backup applications when the stream monitoring and managing feature is used compared to the current "un-managed" case.
- Use the results of the previous step to recommend and possibly implement additions or extensions to the monitoring and managing capabilities to further improve stream usage and backup performance.
- Extend the backup application to retry requests denied due to lack of stream resources.
- Propose and possibly implement extensions to stream resource management coordination to backup applications running on multiple client systems.
- Others as suggested by the team or by their analysis.
Materials Provided
- Either: A DataDomain hardware loaner system to be used for the duration of the project. Or: One or more DataDomain software Virtual Machines (VMs) to be used for the duration of the project
- Documentation for administering / using the DataDomain system.
- A set of binary libraries with documented Application Programming Interfaces (APIs) that can be linked with students’ software acting as a backup application.
- A sample backup application using the provided APIs that can be used/modified to produce the efficient random write backup application.
- Possibly additional sample source code.
Benefits to NCSU Students
This project provides an opportunity to attack a real life problem covering the full engineering spectrum from requirements gathering through research, design and implementation and finally usage and analysis. This project will provide opportunities for creativity and innovation. EMC will work with the team closely to provide guidance and give customer feedback as necessary to maintain project scope and size. The project will give team members an exposure to commercial software development on state-of-the-art industry backup systems.
Benefits to EMC
The monitoring and managing stream layer will serve as a proof-of-concept for a more efficient Data Domain backup library and will allow evaluation of architectural and design decisions in current and future versions of Data Domain backup software. Performance results will aid in estimating expected application performance customers would experience in backing up and restoring their data.
Company Background
EMC Corporation is the world's leading developer and provider of information infrastructure technology and solutions. We help organizations of every size around the world keep their most essential digital information protected, secure, and continuously available.
We help enterprises of all sizes manage their growing volumes of information—from creation to disposal—according to its changing value to the business through big data analysis tools, information lifecycle management (ILM) strategies, and data protection solutions. We combine our best-of-breed platforms, software, and services into high-value, low-risk information infrastructure solutions that help organizations maximize the value of their information assets, improve service levels, lower costs, react quickly to change, achieve compliance with regulations, protect information from loss and unauthorized access, and manage, analyze, and automate more of their overall infrastructure. These solutions integrate networked storage technologies, storage systems, analytics engines, software, and services.
EMC's mission is to help organizations of all sizes get the most value from their information and their relationships with our company.
The Research Triangle Park Software Design Center is an EMC software design center. We develop world-class software that is used in our VNX storage, DataDomain backup, and RSA security products.
OpenStage
Music performances have seen an explosion of visuals being used during performances. Performers set up complex video systems, but the currently existing software packages designed for live music visuals are often proprietary and cost hundreds of dollars. The high price of the software does not even include the hardware necessary to run the software. Our answer to this problem is OpenStage, a stand-alone open source system that can ingest sound, analyze it, and then create visuals on the fly. The system shall be aimed to run on small and cheap computers, such as RaspberryPi, but will work on all major operating systems. Unlike traditional video-jockey systems, this system would be more generative and hands-off during the performance. Rather than be purely driven by a human picking the clips to play, this system will decide what to show based on the sound, additional data sources, as well as basic configurations set by the user through the user portal.
OpenStage aims to take visuals driven by sound and broaden them to the mass number of data feeds we have available in today's world. These additional data sources will come in two forms. The first, being physical sensors placed around the environment and networked together. These sensors can range from video, ambient light, temperature, humidity, or an accelerometer. The second data source would be virtual, such as social media feeds, weather forecasts, or Wikipedia. Not only do these data sources help keep the visuals fresh, but can lead to audience participation, creating a new concert experience.
The visualizer itself will be built upon openFrameworks, a C++ framework. This gives us the ability to easily and intuitively create visuals that will be supported on many different operating systems. The wide array of add-ons for audio, graphics, and animation already built for openFrameworks greatly reduces the time investment of building the base components and opens up our time to create the most important part of OpenStage, the visuals themselves. In order to make setting up OpenStage and configuring the visualizer theme and settings as easy as possible, we will make it so that these processes can all be done via an HTTP webpage hosted by OpenStage on the physical system.
OpenStage aims at giving budding music performers an affordable and less technical avenue for creating visuals for their live performances. Since the software is open source, our revenue stream is in selling completed systems pre-configured to run OpenStage and custom made assets for visualizers.
Semester Goals
- Base sound input and processing
- Four competed visualizers
- These will be both 2D and 3D designs
- One shall use a video camera
- One shall use another non-audio source
- Basic user portal
- Ability to make adjustments to visualizers
- Ability to pick which visualizers will play during a set
- Deployable onto a Raspberry Pi or similar micro-computer.
- Live performance in Hunt Library Creativity Studio
IBM Services Asset Program: Enterprise Exception Handler (EEH)
Open Project for NCSU: EEH Web, REST and Pattern Interface developmentBACKGROUND
The Enterprise Exception Handling (EEH) pattern provides a standardized method of reporting exceptions in the organization through the Enterprise Service Bus (ESB) that may be analyzed in the future. Most application and system exceptions are reported in an inconsistent manner and often reported in logs that are distributed across every node in the subsystem. The pattern addresses this concern by standardization and centralization of system-wide exceptions in a heterogeneous environment.
Community: https://www.ibm.com/developerworks/community/groups/community/asset/eeh
Repository: https://hub.jazz.net/project/arunava/eeh/overview
Documentation (To Be Provided Once Team is Formed):
PROJECT SCOPE
A Web interface to the EEH has been developed and published. However, the user interface provides a basic framework to view exceptions from the database. This interface will be enhanced in the proposed project by:
- Improving the look-and feel of the website
- Adding functionality for viewing events from the database
- Adding functionality for event based Web updates based on MQTT protocol
Creating a REST API based interface for consuming exception data and storing them in the database. The Java code for the exception handling daemon exists in the Core package for processing of exceptions. The project objective will be to provide an interface to this command line utility so that the functionality can be ported to API based applications.
The exception handling pattern has been one of the most effective methodologies for standardizing and reporting of exceptions for Java and Message Broker flows. However, thousands of existing applications find it difficult to manually incorporate changes to enable EEH in their applications. This project will provide the ability to scan and discover existing exception handling in the Java and Message Flows and present the developer to engineer their code with EEH by mapping these to the exceptions in the catalog.
Technology knowledge required: Java, Java Script, Ajax, Servlets, Apache Tomcat Preferred
Additional optional knowledge: IBM MQ, MQ Telemetry Transport, IBM Integration Bus, WebSphere Application Server
The Problem
Ipreo has a large number of corporate clients like Microsoft, Nike, etc. Their main job is to help companies increase their valuation or in other words manage the stock price. To do this they reach out to current and potential investors and tell them about their company to create a demand for their stock. Investors have varied portfolios. They may have a portfolio comprised of securities in different regions and industries that were purchased at different times for different prices. An investor may choose to sell some or all of their shares of a given security. These decisions can be based on a variety of factors (a few detailed examples listed below). The goal of this project is to find correlations between these factors in historical data and use the correlations to identify trends that can be used to predict if an investor is going to sell in the future.
Example Factors Influencing an Investor to Sell Securities
- Return Percent
- Based on the effective "cost basis" price of a company's holdings of a given security
- Cost basis is a computed value of a company's holdings in a given security based on the previous purchase prices and sold shares over time
- A given company may be most likely to sell if the return percent is very high or low (to cut losses)
- Different companies (in different regions or industries) will have varying trends
- Ultimately, once a trend is identified, we can compare a company's cost basis price of their shares to the current market price and apply an estimate of the likelihood of a sale based on what the return percent would be if they sold on that day.
- Turnover
- An individual portfolio's volatility (The rate of trading activity in a fund or company's portfolio of investments, equal to the lesser of purchases or sales, for a year, divided by average total assets during that year.)
- How much change has happened to this portfolio over the past year
- High activity in general should imply a higher chance of sales
Example Trend Factors
- Region
- Issuer's location
- Industry
- Issuer's industry
- Performance of the security
- Fundamentals such as:
- Price-to-Sales Ratio—a valuation ratio that compares a company's stock price to its revenues
- Return on Asset—indicator of how profitable a company is relative to its total assets
- Enterprise-Value-to-Sales—a valuation measure that compares the enterprise value of a company to the company's sales
- Price/Earnings Ratio—a valuation ratio of a company's current share price compared to its per-share earnings
- Price/Earnings To Growth—a stock's P/E Ratio divided by the growth rate of its earnings
- Management change
Why do this Project?
- The issuer of a security may do some damage control during the quarter if Ipreo's predictive analytics indicate one or more major holders of their security may be unloading shares soon. E.g., "We have a new product hitting the market soon or we are expanding our services in China."
- They will be able to reach to out to the potential seller and convince them to hold it longer. This predictive analysis will help Ipreo clients (corporations) focus their energy in the right spot.
- Our client is expected to see their complete list of holders (we currently have this) along with the five most likely sellers based on current price and fundamentals.
Platform/Technologies
- It should not matter whether the solution is web based or stand alone. The more important thing is that we are able to calculate these predictions on a given dataset.
- We are open to using any language or tool but we will be able to help with RDBMS, Analytical Cubes or R. Ultimately, we want an algorithm/formula, which can be used for predictive analysis.
Data Source
- Ipreo will provide you with historical holdings data that is amassed from both publicly available fillings and our own non-public sources. This data will be in a CSV format.
- Ipreo will also provide some historical security fundamentals and pricing data. If any more information is helpful that is available publically, then we are open to using that as well. Again the idea is to predict which investor is most likely to sell a stock in the current situation based on the data available. We will not have transaction data but just holdings. We will not know exactly what date the stock was sold, but just a time-period based on the holdings.
Design
This model should start simply and expand from there. Start with a single model that can compare historical point-in-time cost basis price compared to the quote price with individual portfolios and use this data to make sense of those factors in the present. I.e. "Companies identified as 'Portfolio Type A' almost always sell when there is at least a 30% profit or a 50% loss, 'Portfolio Type B' is 20/70, etc..." From there, if other factors are found to be relevant they can be included if it's helpful or make different types of predictions in different models. All of these decisions will be left up to architects of the analytic models.
Students will be required to sign over IP to Ipreo when team is formed.
Approaches to & Challenges of Storing Time-Series Data on Graph Database Platforms
Problem Description
During one's life expectancy, there are innumerous events impacting health and wellness both favorably and adversely. Some like nutrition, hygiene and genetic disorders tend to be a direct source of causality while others like access and affordability are a secondary source of causality. Today, the health and wellness events and the recommended next steps are often captured in personal health records (PHRs), electronic medical records (EMRs) and electronic health records (EHRs). The lack of interoperability of these systems and protocols not withstanding, the advent of wearable devices used for continuous measurements on vitals as well as those used in telemedicine, poses additional challenges with aggregating multiple parallel streams of information. Imagine a physician treating a patient for an illness on an ongoing basis. Data pertinent to the patient from many disparate sources need to be viewed holistically and in select combinations, contrasted against disease progression models, in order to assess and come up with a diagnosis. It can be very challenging to assimilate this information and even worse very difficult to quickly share and discuss with peers and specialists. How can we address these challenges?
Project Description
Develop an approach to manage longitudinal time-series data such as exercise, diet, medication, vitals, and feelings in one or more time-series database instances. Use OpenTSDB as the time-series database. Come up with an approach to securely manage multiple users' stream in these database instances. Users should be able to manage the privacy and consent of whom they wish to share their time-series data with and expose the interface accordingly.
Develop a mobile application that is based either on Google Fit or Apple's HealthKit that would upload configurable personal information into the above time-series database platform.
Develop an UI/UX approach to manage discrete milestones on an underlying graph database. Use Neo4J as a graph database. A milestone is a memorialization of a visit to a physician or a hospital visit during which one or more time-series of the patient may be deliberately viewed, started, altered or terminated all based on prior consent. An example of that would be a physician commencing a new medication or altering an existing dosage or exercise regimen. Also, the milestone UI should be able to visualize them in meaningful permutations and combinations. An example of that would be to view the pulse and pressure superimposed with daily exercise.
Our vision is that this collection of capabilities can mimic real-world challenges with users integrating their personal devices to their PHR systems and selectively sharing data with consent from their PHRs with their physician's EMRs and EHR systems respectively. Additional requirements on analytics may be added as functionality becomes clearer. Students are expected to think about potential use-cases that will impact privacy, security, compliance or entitlements, and think about how that would impact analytics, report generation, any visualizations and management aspects. Some research on standards, interoperability and compatibility across protocols and standards are highly recommended.
Recommended Tools:
- Time Series Database: OpenTSDB
- Graph Database: Neo4j
- Graph Visualization: D3.js
- Single Page Application: AngularJS
- Authentication and Authorization: Apache Shiro
- Mobile Health Kit: Google Fit or Apple's HealthKit
Target Source Code: Apache Software Foundation (OPEN SOURCE)
Who We Are
Schwab Performance Technology (SPT) is a subsidiary of Charles Schwab that builds comprehensive technology offerings for financial advisors to help them manage their business and their client's investments. A large part of SPT's technology team is based in Raleigh, NC. This team develops applications for desktop, web, and mobile platforms that provide industrial strength solutions using technologies and frameworks such as C#, Mongo, SQL, C++, HTML5, Angular.JS, JSON, and REST. We concentrate on the fundamentals of architecture, design, development, and quality assurance to build applications that stand the test of time which is critical in the financial industry.
What SPT Gains From the Senior Project
SPT is interested in engaging with the brightest students in top tier computer science programs. New projects have allowed us to open a number of positions for recent and upcoming graduates. We hope to establish strong ties with the best students during their senior year which could then lead to job opportunities when they graduate.
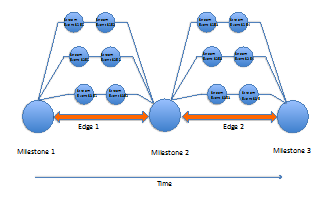
These students will build an application that will help SPT improve how the company uses agile development practices. Schwab uses SCRUM development methodologies. One of the challenges is the ability to provide a roadmap view for our business partners who require longer term planning information that is not consistent with SCRUM practices. Our development teams have created an ad hoc methodology to provide this information but it is a manual white board activity that takes significant effort to transcribe to electronic format (currently Excel) and maintain.
Project Roadmapper
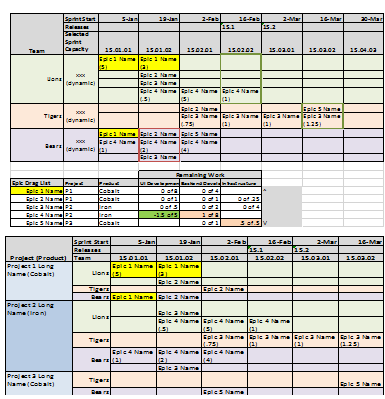
SPT is proposing a tool that will allow users to create visual representations of roadmaps and team layouts for Agile projects. Most SCRUM tools focus on epics, user stories, tasks, team velocities, sizings, and backlog management. While these are all important aspects to the methodology, there is a gap between the sprint to sprint view of SCRUM and the quarterly and annual view of projects required by business and finance to plan application development and deployment. The Roadmapper application is intended to bridge this gap. The tool will allow users to create SCRUM teams with specified capacities, manage backlog epics and/or user stories, establish complexities, relationships, and development needs from specific SCRUM teams, and most importantly provide a dynamic user interface that allows a team to quickly show what is required to deliver on a loosely defined set of epics. The project will deliver a working application with the intent that Schwab will use the application for future program estimation and planning.
Functionality
Entering Base Information and Settings
Allow users to create the base information and settings required to drive Roadmapper. This will include: Sprint List Settings, Releases, Scrum Team Skills, Teams with staff and team's specific skill set, Products, Project List, and Epic Information.
Views to Assign Epics to Teams and Map to the Roadmap
The views are highly interactive and allow users to quickly build a high level roadmap.

Stretch Goals
The ability to automatically assign epics to teams, associate teams for epic distribution for improved velocity, and export to TFS are stretch goals.
Project Approach and Technology
The project will be based on some of the technologies SPT has been using for product development. This list may be altered depending on the teams' existing technology strengths. SPT technologies may include:
- C# used for backend development
- REST for web services
- MongoDB for database storage
- JavaScript and HTML5 for UI Development
SPT strives to develop using best practices while remaining agile. We use the SCRUM methodology and will run the senior project within a similar methodology used by our teams. One mentor will be selected from our development team to be the primary interface with the project team, but other members of our staff will be brought in from time to time to assist with the project.
Project Success
Success will be based on the following accomplishments:
- Participating using a SCRUM methodology to understand the benefits of agile development.
- Requirements (epics and user stories) will be provided to the team by the SPT staff. The team will successfully groom the user stories to provide initial estimates.
- Breaking down the user stories into logical tasks and providing task estimation. This will be used to prioritize features within the semester's time box.
- Architectural and design documentation produced for data and user interface components. A variety of UML and white boarding documentation will be used.
- Producing quality code (well organized, performant, documented)
- Developing a test strategy for unit, component, and end to end quality assurance. Testing will likely be done manually but students can be exposed to the automated quality assurance system that SPT has in place for existing products
- Working application completed and demonstrated to internal SPT staff. The goal will be for the team to participate in customer feedback session and generate a feature request backlog.
Students will be required to sign over IP to Schwab Performance Technologies when team is formed.
Bronto Engineering Network of Sociality
Bronto Software offers a sophisticated marketing platform for its corporate clients, tracking billions of events per month. Customer events such as opens, clicks, and purchases (conversion) are recorded and analyzed in real-time and displayed to our customers to give them a clear view of how their campaigns are performing.
Years back, our CEO wrote a little employee directory for the company. We'd like to have a better one for the Engineering Dept. We will store user profiles, including team membership and current projects. We need login authentication, so no non-engineers can view it.
After these most basic requirements, the feature set is up for discussion. We expect the project would much more interesting and useful if it included some of the following features.
- twitter: pull each user's twitter feed and display it on their page
- fun facts: allow submission of personal facts about each user, store them in the db, restrict access to these data based upon user type (we'll have a manager/admin user type)
- plugin architecture: allow employees to add scripts to their pages to customize content and integrate with additional content sources
- JIRA integration: we use JIRA for project management; pull a user's activity stream from JIRA and display it on their page
You also have to name this thing for us. And if there's an artsy person on your team, make us a logo.
Technology choices are up to the team, the Bronto advisors will advise. We like Java, Python, Postgresql, React, Backbone, Bootstrap.
Release Tracking Visualization
NCSU Senior Design Project
As a software center, DBGT is releasing something almost every weekend. Keeping track of the hundreds of releases across different programs and stages of readiness is a very time consuming, manual process. There is little visibility by the teams and senior management for those domains and in other areas of the company. Much time and effort are expended trying to collect, administrate, explain and update people on the status of a release and any problems that the teams are having.
The Assignment
We are looking for a group of dynamic students who can create and implement a working solution to solve how to manage and show the different releases for the center. Reducing the email/spreadsheet spam and creating an engaging visual application to view the dates and programs is needed. Deutsche Bank can provide a representative data set(s), a description of the current process and other information, but we need your ideas and technical expertise to create an innovative solution.
This Semester (Fall 2015)
This semester the goal is to deploy a working version of the product in Deutsche Bank. We have a list of desired actions (collect and review data, make the data visible, and socialize with the company) and some design ideas already, but we need the students' input to help make this a success. We are open to new ideas or technologies that fit within a few technical limitations (e.g., IE 11) that the bank has.
NCSU Student Experience
Senior Design students in the College of Engineering Department of Computer Science will have a unique opportunity to partner together over the course of the semester to create an information tool, as they would experience in real world product development. Additionally, students will have access to industry professionals to assist in the design, Agile/Scrum practices, and the overall developing/coding and testing.
Shakespeare-In-Motion
Background
Infusion is a global consulting company based in New York. We have offices in Toronto, Houston, Raleigh, Malta, London, Wroclaw, and Krakow. We create digital experiences and emerging technology solutions for retail, financial services, oil and gas, health and life sciences, entertainment, hospitality, education, and the public sector.
Experience
Not too long ago, the Chinese Stock market lost over 30% of its value in a matter of a few days. Why did this happen? Sure, you could find out by spending all your time watching the stock market and reading every scrap of news that you can get your hands on, but you didn't sign up for a computer science degree to do things manually. Wouldn't it be better if you had a web page that used Natural Language Processing and web crawling to aggregate all that information for you? Of course it would.
The ideal is to have automated investment portfolio performance commentary (descriptive text) informed by analytics on attribution, risk and returns data in the context of market news and events to better understand the underlying factors that drive stock performance: what changed, when did it change, why did it change, and how did it impact the stock performance.
We challenge your team to develop a proof of part of this concept to simply answer the question: what just happened with an automated deduction of why? Do this by correlating the news with activity in a portfolio: create a trigger from the Bloomberg Commodity Index (BCOM) activity that will scrape the web for concurrent news in the correlating commodity markets.
Implementation
- Thin Client: This will be a "thin client" app meaning it will implement REST patterns from a web front end to a server backend. We will discuss with you what tech stack to use based on the team's strengths and prior experience.
- Data Analysis: We would like to analyze the news about a particular Index in 1-week chunks. This information should be aggregated and summarized.
- NLP: Natural Language Processing will be used to analyze what is being said in the news about the Index and to figure out what is important and note-worthy.
Stretch Goals
- Email Notifications: The findings should be consolidated into a summary email notification to let users know what's going on in a succinct way.
- Greater analysis: Take a scrape of the big-picture news stories that are not directly tagged to the individual commodities markets. Can you create a decision tree that would lead from global hype to market performance?
- Sentiment Analysis: Big global stories are greatly carried in social media to determine how people feel about a particular market.
- Index and News source configuration: customize and select where the analysis originates.
ASD Simplified Technical English Grammar Proofing
Background
Simplified Technical English (STE), or Simplified English, is a controlled language originally developed for aerospace industry maintenance manuals. STE was created for use in the aerospace and defense industries, but other industries have used it as a basis for their own controlled English standards. STE is a carefully limited and standardized subset of English that addresses difficulties in comprehension such as complex sentence structures, confusing word forms, and ambiguous vocabulary. STE is defined by the specification ASD-STE100, which is maintained by the Simplified Technical English Maintenance Group (STEMG). The specification contains a set of restrictions on the grammar and style of procedural and descriptive text. It also contains a dictionary of approximately 875 approved general words. The specification also provides writers guidelines for adding technical names and technical verbs to their documentation.
While there are several existing products to assist in document proofing for ASD-STE, no clear leader has emerged. Additionally, none of them integrates seamlessly into Microsoft Office.
The official website is http://www.asd-ste100.org/
Description
The team will work with KPIT to scope which aspects of the specification will be required and implement a Grammar Proofing system based on the identified rules.
- Utilize the most recent ASD-STE100 issue to create a Simplified Technical English document proofing system.
- Special consideration should be given to items mentioned on http://www.asd-ste100.org/software.html
Requirements
- The system should have the ability to read the contents from a flat file and create a report on the violations.
- The system should provide correction hints similar to most current Spellcheck and Grammar check software.
Desired Features
- The system should have the ability to integrate with Microsoft Office.
- Without any extra installation or setup by the user if possible.
- The system should work in real-time as the writer is writing similar to most current Spellcheck and Grammar check software.
Delivery
This project should be created with an emphasis on code reuse and supported APIs. Significant attention should be focused on ensuring future compatibility through minimal code modifications.
Space Pong
The Laboratory for Analytic Sciences is charged with developing the science of analysis and analytic methodologies. This simultaneous study of tradecraft and technology serves as the foundation upon which all LAS efforts are positioned. Tradecraft is concerned with measuring, understanding and advancing the fundamentals of intelligence analysis across a variety of mission-related analyses. Technology focuses on the study of the scientific fundamentals and abstract analytics that will enable the LAS to develop a framework for data-intensive computing and intelligence analytics. Unification of tradecraft and technology shall be accomplished by creating a novel user experience to allow analysts and developers to visualize, interact with, and measure performance improvements that derive from advances in the science of analysis.
The Project
The LAS is interested in the methodologies employed by the SDC team to develop a single, dual and multi-player game. We believe the game format is compelling and are interested in the collaborative nature of the development, from the user interface to the AI used in single-player mode. Observing and measuring how collaboration among the students occurs to implement a sequence-based project contributes to understanding different kinds of goal-oriented collaboration environments. The concept of "Space Pong" derives from the Final Report of a previous SDC Project and as such was motivated by not only the mentor, but also the students participating in that SDC Project. Therefore Space Pong may be fun for the students while also serving the goals of understanding how teams collaborate to achieve a goal as well as build a reactive platform for studying subsequent autonomous and semi-autonomous agents.
The Fall 2015 LAS senior design team will design and implement a Pong game for iOS devices (iPhone/iPad). This game will have the following properties:
- Paddle control via "tilting"
- "English" imparting "spin" if paddle returns ball and is moving
- Black holes, asteroids and other moving and stationary gravitational objects in the middle of the screen
- Cylindrical coordinates so that the ball moves off the "left side" of the screen and appears on the "right side"
- Multiple "balls" having different amounts of damage: this is in the "breakout" mode where there is a wall of rectangular tiles that the paddle is supposed to protect. Balls with bigger damage destroy more of the tiles in the wall. Balls can be color coded or sized differently.
- Single-player play against an AI player
- STRETCH GOAL 1: Two-player play: investigate and implement a two-player version where the player's devices connect either directly or via a LAN, or if there is a need for a centralized "server" to host/coordinate game play between remote players.
- STRETCH GOAL 2: Investigate the possibility of a multi-player game; is there a multi-player version of Space Pong?
Docker Deployment Tool for StorageGRID Webscale
Project Background
NetApp's StorageGRID Webscale is a software solution to store massive amounts of data for large archives, media repositories and web data stores. It is designed for the hybrid cloud and supports standard protocols, including Amazon S3 and SNIA's CDMI. The 10.1 and prior versions of StorageGRID run on an SLES/VMware environment.
- See here for more info on StorageGRID: http://www.netapp.com/us/products/storage-software/storagegrid/index.aspx
NetApp's RTP Engineering team is making changes to the StorageGRID architecture to enable StorageGRID to run in a KVM environment and by doing so; enabling StorageGRID to run in a Docker container.
- See here for more information on Docker: https://www.docker.com
Project
The Fall 2015 NetApp senior design team will create a CLI tool written in a high-level language, which will aid in StorageGRID deployment. The tool will extract the appropriate components from a StorageGRID TGZ file and deploy them within a KVM and a Docker environment. A goal of the project is to be able to fully deploy a StorageGRID environment on multiple KVM nodes. Deploying StorageGrid in Docker containers on a bare metal Linux operating system is a stretch goal.
Once complete, this tool will be used by NetApp personnel and NetApp customers to deploy StorageGRID. Our preference is for the tool to be written in Ruby.
Hardware/Software Dependencies
NetApp will provide the team with needed hardware and software resources, along with support and training. The team will be given access to NetApp's StorageGRID – TGZ file for version 10.2 (beta) including the SGI tool. The team will also have access to a Linux server with 64 GB of RAM and 1 TB of storage and with support for Docker and KVM.
Please Only Select This Project if You Are a Member of the Oracle Preformed Team
Virtualization of Test Resources in OpenStack
Background
The Oracle Communications Business Unit (CGBU) delivers a powerful combination of technology and comprehensive, integrated business applications for enterprises and service providers. Oracle Communications builds several products on a platform stack consisting of a customized Oracle Linux OS (TPD), a proprietary database system and several GUI interfaces. As the core of many products, this software stack is held to the highest standards of quality and is subject to rigorous testing procedures.
Oracle's CGBU Platform Design Verification group is responsible for this testing, and has developed the Design Verification Automation Tool (DVAT) to assist with the verification process. The DVAT executes automated test plans, collects pass/fail results, and reports these results back to the user. Previous senior design efforts with NCSU students have positively impacted the DVAT. These efforts resulted in two prototype features and one feature that was integrated into the production DVAT. This semester, Oracle Communications would like to further build on this success and focus on enhancing the DVAT's test automation capabilities.
Problem
Automated test plans act on server resources specified as input parameters. Today these resources must either exist physically or virtually before the test is able to use them. Resources must often be re-built to a known good starting state for a given test. Our users must track, manage, and maintain these resources or build automation on top of DVAT to fully automate testing. It would be beneficial to be able to specify a VM template to a test rather than a specific server to reduce complexity and decrease test time.
Project
Oracle's Fall 2015 senior design team will:
- Internal to DVAT:
- Update the test language to specify a server resource by identifying an existing OpenStack VM template.
- Automatically instantiate the VM and import it to the test as a server resource
- Update test result objects and user interfaces
- Update regression tests
- Update APIs and client libraries
- Implement a life-cycle for the VM after the test is complete
- Update continuous integration
- External to DVAT:
- Automatically create TPD templates in OpenStack when new builds appear
Stretch goals
Stretch goals are above and beyond Oracle's requirements for completing the Fall 2015 senior design project. Each goal requires that the design team do research, analysis, and requirements before implementation.
Improve Automated TPD Testing
- Propose how use of virtual resources can improve TPD design verification's upgrade test scheduler and TPD development's nightly test scheduler.
- Modify the schedulers with the proposed changes.
- Measure the results of the change and document any trade-offs applicable to future efforts.
Group Ownership for Resources
- Add user group functionality to DVAT.
- Support assignment of resources to groups.
- Modify resource views and actions to honor groups.
Heat Template Support
- Research HOT and AWS CloudFormation templates and propose the best match for CGBU platform design verification.
- Update DVAT to leverage OpenStack Heat templates for deploying and testing multiple server resources.
- Create a two node TPD topology "stack" in OpenStack in a DVAT test plan as a reference implementation for others.
Resource Elasticity and Scheduling
- Analyze resource usage data.
- Minimally, consider what triggers test execution, how many resources are required, and what type of resources are required.
- Propose actions that the platform verification team should implement to take based on the data.
- Implement the proposed action(s).
- Measure the results of the change and document any trade-offs applicable to future efforts.
Resource Analytics
- Analyze resource usage data.
- Minimally, consider hardware type, availability, test frequency, failure types, and failure frequency.
- Propose actions that the platform verification team should implement to take based on the data.
- Implement the proposed action(s).
- Measure the results of the change and document any trade-offs applicable to future efforts.
VIP Resources
COMCOL is a CGBU platform component that provides highly available telecom-speed database services.
- Research DVAT's use of SSH control paths and persistent connections along COMCOL VIP implementations and propose a method for treatment of VIP resources in DVAT. Consider SSH, SQL, SOAP, HTTP, RIP, and Browser connections.
- Implement the proposal as a new DVAT VIP resource.
- Bonus: Improve existing COMCOL VIP test plans to use the VIP resource where appropriate.
Implementation
The team must:
- Gather requirements for resolving the above problem
- Select candidate technologies and review with the DVAT development team
- Update interface documentation and review with the DVAT development team
- Implement the design and review with the DVAT development team
- Participate in Oracle's code review process for all deliverables
Oracle will provide:
- Development, test, and CI environments for DVAT and related automation
- Access to an OpenStack deployment
Implementation technologies include PHP, Python, CoffeeScript, node, and restful APIs on a Fedora platform as well as OpenStack and related APIs.
Hardware-agnostic mini-game for measuring performance
Problem summary
The goal of this project will be to develop a mini-game to use as a workload for measuring the speed of various personal devices, including phones, tablets, Chromebooks, and laptops. Ideally, the student team would be diverse and the mini-game would reflect diverse viewpoints. The mini-game must use the device's resources in realistic ways. It does not need to be a full-featured game, but it must include a demo mode and the ability to record logging and timing information.
Project details
The project requires the following:
- The resulting mini-game must implement the main components of a game engine, including realistic physics and 3D rendering. (3D rendering is a requirement for this project.) Code should not be written to target specific types of operations, as the goal is to have a representative mix of operations. Rather, participants should concentrate on implementing the mini-game as well as possible.
- The mini-game will need to include art. Principled Technologies (PT) can provide design help and graphical elements as needed.
- The students must implement the mini-game using Web-based technologies, such as HTML5, ASM.js, etc. Because the goal is to run on the widest range of devices possible, students must avoid processor-specific code. Students will have the opportunity to provide input on the technologies, and they and PT will make the final selection.
- To produce repeatable results, the mini-game must run a fixed scenario, i.e., a demo. By scenario, we mean a fixed set of inputs that will produce a repeatable series of actions by the game. We recognize that this requirement will impose some constraints on the game design.
- The mini-game must include a mechanism that lets developers edit the demo. A simple mechanism, such as a config file, would meet this requirement.
- The demo should complete in approximately three minutes. It should have the ability to repeat for both a fixed length of time and a fixed number of iterations.
- The mini-game must be able to record logging data, frame rates, and other timing information. PT will provide the specific definition of the logging and timing data the game should record. The types of information that the project will report include the timing information for the test, an overall score, and information about the device under test.
- PT will provide a mechanism for uploading logging and performance information to a database on PT's servers.
Implementing the components of the game engine and being able to run a scripted demo will fulfill the basic requirements of this project. As noted below, making the mini-game fully playable is a stretch goal. If the project is successful, PT will make it available to the public on the BenchmarkXPRT Web site.
Stretch Goals
- Create a second implementation of the mini-game as an Android app.
- Add the functionality to make the game fully playable.
Who we are
The BenchmarkXPRT Development Community has been developing tools to measure performance for over 4 years. Current offerings run on Android devices, Chromebooks, Windows-based PCs, and Web-connected devices. The XPRT benchmarks are used by major technology vendors, as well as by members of the technology press, such as Anandtech, CNET, and Tom's Hardware.
The BenchmarkXPRT Development Community is administered by Principled Technologies, a world leader in technology assessment and fact-based marketing.
Students will be required to sign over IP (and NDA) to Principled Technologies when team is formed.
Project Archives
| 2026 | Spring | Fall | |
| 2025 | Spring | Fall | |
| 2024 | Spring | Fall | |
| 2023 | Spring | Fall | |
| 2022 | Spring | Fall | |
| 2021 | Spring | Fall | |
| 2020 | Spring | Fall | |
| 2019 | Spring | Fall | |
| 2018 | Spring | Fall | |
| 2017 | Spring | Fall | |
| 2016 | Spring | Fall | |
| 2015 | Spring | Fall | |
| 2014 | Spring | Fall | |
| 2013 | Spring | Fall | |
| 2012 | Spring | Fall | |
| 2011 | Spring | Fall | |
| 2010 | Spring | Fall | |
| 2009 | Spring | Fall | |
| 2008 | Spring | Fall | |
| 2007 | Spring | Fall | Summer |
| 2006 | Spring | Fall | |
| 2005 | Spring | Fall | |
| 2004 | Spring | Fall | Summer |
| 2003 | Spring | Fall | |
| 2002 | Spring | Fall | |
| 2001 | Spring | Fall |