Projects – Fall 2017
Click on a project to read its description.
Cisco – Validated Lightweight Crypto for IoT Environments
Background
Cryptography is very important in today’s world. Improper or maliciously altered crypto implementations have been a big concern for the industry in recent years. To alleviate the risk, Cisco has been working with the National Institute of Standards and Technology (NIST) on finding ways to validate crypto implementations. The output of these efforts is the Automated Cryptographic Validation Protocol (ACVP). ACVP enables crypto implementations to interact with a server that provides crypto test vectors which the crypto implementation encrypts and sends back. The server can then check for correctness which would mean that the algorithms are implemented correctly. ACVP can be used for FIPS validations of the cryptographic modules. Cisco has open-sourced an ACVP client that implementers can use to validate and certify their algorithm implementations against NIST’s or 3rd party servers.
On the other hand, IoT environments cannot always use all the commonly accepted crypto algorithms available because of their constrained nature. A battery-operated sensor, for example, cannot use 3072-bit RSA because it would deplete its battery faster and because of processing load. NIST’s Lightweight Crypto Program is working on defining lightweight crypto algorithms suitable for these constrained endpoints. Some of the lightweight algorithms are documented in their Report on Lightweight Cryptography. Additionally, a recent paper from NIST’s 2016 LWC Workshop describes a methodology of using Joules/byte as a metric for evaluating the algorithms’ energy efficiency.
Description
In this project we want to introduce ACVP in Lightweight Crypto for constrained environments. ACVP can be used to validate lightweight crypto implementations and provide energy efficiency metrics for these modules that are important for constrained environments.
-
We want to extend the open-source ACVP client library to integrate and validate lightweight crypto libraries like WolfSSL or mbed TLS. The updated ACVP client should be able to run the crypto algorithm implementations from these libraries against the ACVP server test vectors to validate the crypto modules. Running the new ACVP client code in a Raspberry PI is encouraged, but not mandatory.
-
After integrating the new lightweight crypto library in ACVP, we want to look into the necessary information that the ACVP client and server can exchange in order to evaluate a lightweight crypto algorithm in terms of energy efficiency (En=P×T/n) in Joules per byte as explained in a recent paper. We also need to understand how this information will be exchanged in ACVP messages.
-
Finally, if time permits, we want to look into the algorithms described in the Report on Lightweight Cryptography and investigate the necessary changes to be made in the ACVP library to add these algorithms.
If time permits, we would aggregate the output of this in a paper that will be submitted to a future NIST LWC Workshop.
Required Student Skills
-
Students must have taken or be taking taken at least one course in security or cryptography.
-
Experience in C programming and familiarity with JSON.
-
Familiarity with Git and GitHub.
-
Motivation to work on an interesting topic and try to make an impact.
Motivation
Students will be able to work on a new and interesting practical industry problem. Cryptography and security are hot topics today. NIST, Cisco and other companies have been trying to address the validated crypto issue for some time. IoT Security is also one of the hottest topics in the industry today. Marrying the two subjects and planting the seed for standardized, validated lightweight crypto will allow the students to get familiarity with interesting topics and see where the industry is moving towards. They will also get to use common tools like Git and see how cryptography is implemented in the real-world.
Since Cisco has been actively working on ACVP and IoT security, this project will allow us to make the case for the industry to consider validating lightweight crypto in an automated fashion. With this project we will be able to prove that it is possible by integrating the ACVP library with at least one lightweight crypto library. We could also gain knowledge about potential changes to the ACVP protocol that enable its use for crypto validation in constrained environments.
Deliverables
-
A new fork of the open-source ACVP library should be used to do a git pull request that includes the necessary code changes to integrate the open-source ACVP client library with a light crypto library like WolfSSL or mdebTLS. A new, working
app_main.capplication should be included in this code. Running the new ACVP client code in a Raspberry PI is encouraged, but not mandatory. -
A well-documented set of changes to the ACVP protocol (client and server) to be able to support energy consumption evaluations of the algorithms tested based on a recent paper (En=P×T/n).
-
If time permits, a new pull request should be submitted to include the ACVP library changes required to add the lightweight crypto algorithms in the Report on Lightweight Cryptography in ACVP. Implementation for these algorithms in not necessary, just adding them to the ACVP supported algorithms.
-
If time permits, we would like to summarize the output of all this work and submit it in a future NIST LWC Workshop. The document should be in LaTeX.
Fidelity Investments I – “Focused Frog”
Enterprise Cybersecurity (ECS) is a business unit within Fidelity Investments that sets Fidelity’s strategy, policy, and standards for the security of and operations in cyberspace. We focus on threat reduction, vulnerability reduction, deterrence, international engagement, incident response, resiliency, and recovery policies and activities. This project will be exploring a version of chaos engineering technologies (nicknamed the “focused frog”) that will help improve the resiliency of our distributed applications. Our millions of users depend on our applications, ranging from trading platforms to retirement planning, to be resilient and available during IT disruptions in order to deliver best in class service to our customers.
Solution Description
Enterprise Cybersecurity IT Business Resiliency would like to develop a “focused” method of chaos engineering utilizing a derivative of the open source Chaos Monkey code [L1] that can run on premise and against Fidelity’s traditional infrastructure (onsite VM’s, traditional servers, appliances, network gear etc.), Fidelity’s internal cloud, and eventually scalable to Amazon Web Services and other Cloud Service Providers. This derivative of the Chaos Monkey code would be “focused” at first, so the code would target a specific application, server, slice etc. in a controlled environment[L2] before expanding this to multiple applications, servers, etc. A phased approach is outlined below:
-
Phase 1: Start at the command line level, utilizing chaos monkey code to target individual pieces of infrastructure, virtual machines, applications, servers.
-
Phase 2: Creation of a user interface, integrated with Service Now (to pull server and incident groups) and our monitoring systems (to capture alert streams) that can be used to run the chaos monkey code against individual applications, virtual machines, slices, etc.
-
Phase 3: Ability to run chaos monkey code, using the previously mentioned UI against groups of applications, servers, slices, etc.
The phased approach has been chosen for two reasons:
-
To allow for Continuous Integration and Devlopment of the application, as well as letting the students to see their application work without a user interface.
-
Fidelity is a large, risk-averse enterprise. By being able to focus on targeted applications we already know are resilient, there is less of a risk that we disrupt the overall operating environment.
Suggested Technologies
Javascript, NodeJS, SQL, Open source tools, Github, Apache, Linux, Windows, VMware, MariahDB
Additional Notes
Our team will assist with the data the students require. We will not provide directive access to SNOW and interal data. We will provide data that has been “masked”(ie: no real fidelity data) by taking an export file and changing around the data to conform to fidelity internal policies before allowing it’s use.
References
-
Principles of Chaos Engineering, overview of chaos engineering
-
Open source chaos monkey code from Netflix
-
Blog post describing Netflix Chaos Monkey methodology and results
https://medium.com/netflix-techblog/chaos-engineering-upgraded-878d341f15fa
Fidelity Investments II – Guardian Tool
Access management is critical to the protection of customers and corporate security at Fidelity. Fidelity has a set of controls to ensure that users have access appropriate to their individually assigned job roles. Many times this results in managers reviewing large amounts of access for their direct reports because much of the access may be categorized as non-compliant. We would like to find a way to engage and incentivize managers for helping to reduce non-compliant access and completing reviews in a timely manner.
Solution Description
We would like to create an application or extend our existing application to present achievements and to track the achievements a manager has unlocked. These achievements will revolve around rewarding managers who have minimal non-compliant access and/or complete their reviews in a timely manner. A possible structure for this is outlined below:
Achievement: Access Guardian – Tier 1
- This achievement would be unlocked for those managers who have direct reports with 0 items of non-compliant access
Achievement: Access Guardian – Tier 2
- This achievement would be unlocked for those managers who have direct reports with 1 - 10 items of non-compliant access
Achievement: Access Guardian – Tier 3
- This achievement would be unlocked for those managers who have direct reports with 11 – 20 items of non-compliant access
Achievement: Access First Responder
- This achievement would be unlocked if a manager completed their review within 5 days of the first notification.
Additional achievements could be given for engaging individual associates to provide input for the reviews. These managers could unlock the “Access Guardian – Collaboration” award.
Scoring is based on specified direct reports (i.e. a manager has 5 direct reports) and the number of items in their annual access review that are marked as “non-compliant”. Data structures will be provided for the initial integration and scoring. All relevant data to perform calculations (scoring) will be available in the data structure (which will also include compliance value).
This implementation needs to be a separate module that can be linked inside of our current application (integration points could be defined later). This link could be as simple as a hyperlink, or as complicated as extending the “review/manager” data structures.
Time Permitting
Reports to view current achievements and those that could be unlocked in the future
An alerting system and/or leaderboard
Technologies
AngularJS, C#.Net, ASP.Net WebAPI
IBM – Open Projects – Cognitive Telescope Network
Background
Telescopic follow-up of transient astronomical events is one of the most desirable and scientifically useful activities in modern observational astronomy. From a scientific perspective, pinpointing a transient event can be essential for discovering more about the source, either by directing more powerful telescopes to observe, or to maintain a near continuous record of observations as the transient evolves. Very often transients are poorly localized on the sky and telescopes have a limited field of view – thus pin-pointing the transient source is often a daunting task. Perhaps most importantly, the number of large telescopes on the planet is small, and they cannot be commandeered to randomly search for every transient of interest.
Modern sub-meter class telescopes, of the sort often owned by universities and increasingly by amateurs, if properly directed, could play an important role in enabling transient follow-up. Modern technology gives them the ability to be automated and controlled remotely and to make useful imaging observations that will enable follow-up work by other, larger telescopes. The Cognitive Telescope Network (CTN) will be a framework that takes notifications of transient events and intelligently instructs a network of sub-meter telescopes mapped into a grid and observe a large region of the sky that likely contains the transient event, based on the geolocation, weather and properties of the individual telescopes. The goal of CTN is to collect the data from this network of small telescopes, evaluate and classify that data to identify the most likely candidates for the transient being hunted and deliver the results to the astronomer community for further analysis by larger telescopes for directed and focused observations.
Astronomical events sent to the CTN may trigger the telescopes in the network to be directed towards the event to capture images that may be analyzed later. The framework to communicate with telescopes world-wide and the ability to parse and capture events is provided. The overall goal is to build an ecosystem of subscribed members (astronomers and interested individuals) and disseminate knowledge in the community.
Project Scope
The CTN will be communicating with all the components (see Community link, below) through a centralized REST API written in Java and deployed to Bluemix as a Cloud Foundry or Microservices application. The scope of this project is limited to the development of the REST API. The student team will be interacting with the SQL Database from the API as well as looking into caching mechanisms.
There is no interaction with telescopes in this effort. The API will be front-ended with IBM API Connect service. OAuth authentication will be set up through this service. Session Caching will be handled through the Cloudant database service and backend RDBMS will be either DB2 or MySQL. This development effort will be part of the Foundation component of CTN.
Please refer to the diagram posted to the Community site. All communication between the CTN components takes place through REST API. It also forms an abstraction layer on top of the database. API Connect is an IBM product available to manage the APIs. It is available in both on-prem and cloud versions. We will be using the cloud version on Bluemix.
Community Links:
https://www.ibm.com/developerworks/community/groups/community/asset/ctn
Get Started: http://ibm.biz/asset-ccode-start
This is a completely new development that we are starting this Fall. There has been some groundwork being laid down by a summer student from University of Illinois UC. He will also be involved with the project in the Fall. ECE will be taking on 3 critical components for the project - Observing Director, Image Analyzer and Telescope Commander under the Cognitive Epic. Some components will be developed under IoT as well. The Telescope Commander is the component that interacts with the telescope being developed under ECE. This will be led by Dr. Rachana Gupta. CSC Students will be more than welcome to participate in the discussions and contribute any ideas since they will be part of the CTN asset team. But the responsibility of the development on the component remains with the team that chooses to develop the Telescope Commander Open Project.
All the components developed will be working components primarily on Bluemix. We will be using both the Cloud Foundry layer as well as Microservices (using Docker containers) for most of the work we do on the project. All the code will be hosted by the Bluemix GIT repository and the plan is to build a DevOps pipeline using the toolchain on Bluemix.
CTN is a project that was started by Dr. Shane Larson from Northwestern University and Arunava (Ron) Majumbar. We of course had help from a number of IBMers. So in essence this is a research collaboration between IBM, Northwestern and now NC State.
Long Term Goals
It is a long term goal to get astronomers together under a common forum so the we can collaborate on this and other projects together. The community at the moment only has 6 members including Drs. Majumbar and Larson. CTN will be one specific asset with its own community mainly focussed on the project components and development. The Astronomy community on the other had will have generic information including posting pictures etc. Event Publisher component will automate this.
The plan is also to build an interactive app for the end user communicating with the Watson Conversation, etc. services through the Personal Astronomer components. No plans to start this in Fall unless some University project wants to pick it up. Potential for building this as part of the Design program from Austin labs.
Image Analyzer component planned on being developed by ECE will be dealing with Watson Visual Recognition and training Watson on the astronomical images. We will also look into improving algorithms etc.
Please join: https://www.ibm.com/developerworks/community/groups/community/astronomy
Avanade – Crowd-Sourced Infrastructure Review
Business Problem
With over four million miles of road in the United States, keeping all of it running smoothly is a difficult job. Finding all of the infrastructure deficiencies and then prioritizing them is a herculean task that government officials wrangle with every day. While experts need to make the final call, we would like to give them another stream of data to help with the job. We also want to improve citizen participation and interaction in local and state government by giving them a voice into an important part of their lives that the local and state government control.
Solution Description
We would like to create a mobile-friendly web application that allows users to report infrastructure deficiencies, and to verify issues reported by others, with the goal of providing a source of information to offices responsible for infrastructure, as well as to citizens who may be traveling or moving to a new area. The application will use mapping services to gather and display user-reported issues, as well as issues that are already known by government officials. Users can report issues in specific locations by placing a pin on a map in the application and choosing from a list of common issues and / or filling in a brief description (dangerous intersection design, bridge damage, road needs re-surfacing, need a sidewalk). Users can also respond to existing issues, raising or lowering their overall significance and adding their own details. Users should also be able to navigate a map of reported issues (either by scrolling and zooming, or by entering in a location) and tap on issues to see full description as well as the responses of other users. On this map, the significance of each issue is visually represented in some way (for example, perhaps pins on the map are more transparent the less user responses they have).
Technology Constraints
Web application that works smoothly on mobile and desktops
Google Maps API integration
Hosted database solution to store issue information (flexible on which specific DB)
Use an API to handle communication between web app and database
Pull in data from local governments about current, known issues & planned solutions such as from the ArcGIS Comprehensive Transportation Project Map.
Potential Stretch Goals
Allow users to upload pictures along with the report
Implement various sorting and filtering methods
Create a web dashboard to allow infrastructure services to make official comments on issues
Gamify the submission and ranking process
Register the project & data with a local Code for America chapter
Merck – NC Collaborative for Children, Youth & Families
(Service Project)
Merck, a Super ePartner of the CSC Department, is sponsoring a service project for the NC Collaborative for Children, Youth & Families, a non-profit group of cross-system agencies, families, and youth who educate communities about children’s issues; support the recruitment of family and youth leaders to provide input into policy and training; and organize support to local systems of care groups.
Project Description
We have been working to improve our website and use of social media to promote understanding of children’s issues. We need assistance with developing on-line training and ways to deliver our message to communities about children’s needs.
https://www.nccollaborative.org/child-and-family-teams/
Social workers throughout the State come to this website to become trained and certified to be able to serve as a mental health consultant with children and families (they can also go to in-person workshops to be trained if they prefer). Employers pay for the training and when training is completed, a box is checked off and the trainer is certified. There is no assessment or monitoring involved. The Collaborative would like to build more into their website that allows for assessment of person who is trained (via something like a quiz) and then some sort of monitoring/assessment of how participants use their training (this could be in the form of sharing of best practices, some sort of chat room, etc.). If the website includes this, the Collaborative would like to offer a pilot study to see if these additions improve the quality of service in the field.
The Collaborative would also like to offer additional training (other than the major one described above) via their website, with assessment, and perhaps a dashboard of some sort for participants to keep track of training hours and assessments (including the major one, above). Perhaps potential employers could also come to this site to view dashboards of potential employees or employees could point to dashboards from their resumes (requirements to be determined!).
The current website is built using WordPress.
NetApp – Deployment Usage Collection (DUC) Service
Problem Statement
Most data collection services are focused on analyzing and reporting on diagnostics, performance, application stability, network analysis, etc. Existing systems (DataDog, Prometheus, Nagios) can be complex, expensive, or both. Even at NetApp, we can attest to the complexities around collecting time-series data (which we call ASUP for AutoSupport) and trying to extract value out of NetApp’s ASUP data lake is a massive challenge. Even with our advancements around using better visualization tools (like Tableau), answering questions about NetApp’s install base is not self-service, using the tools are non-intuitive, and querying the massive amounts of data is unwieldy (unless you are an expert).
So what happens when you want to collect something basic, like “Are my customers using my feature?” (where a “customer” is one who bought my product). These robust data collection services are generally too complex for collecting simple usage data.
We (as in, technology communities) need a new way to collect “usage” statistics; things like “What features are our customers using? What features are they not using? How often are they using it?” Answers to these questions greatly benefit Product teams (Product Managers, Product Owners, Project Team Leads, Engineering Managers, etc)… answers to these questions can justify a roadmap, can influence where to invest resources, can boost confidence in using features for other customers, and can lead to a much more knowledgeable understanding of your product.
Project Goals
We would like a student team to build a new platform for collecting “usage” data of complex deployments; one that is simple, open, and intuitive; a system that is readily available to collect data from any internet-connected deployment, system, and/or device; a system that is scalable, reliable, and secure.
The major components of the Deployment Usage Collection platform is as follows (see architecture diagram below):
The DUC Web Service: receives and stores usage data. This is a cloud-hosted service with front-end API and content repository for storing time-series data.
The DUC Dashboard: displays collected usage data.
The DUC Clients: one or more clients that collect data within the deployment / system / device and reports that data to the DUC Web Service.

System Architecture Diagram
Use Cases
The Architecture Diagram shown above conveys one instance of what a DUC platform would look like. But there are a variety of “use cases” that DUC could be applied to. Two use cases immediately come to mind:
OpenStack – in open-source ecosystems, tracking usage of features is limited to vendor-specific collection. DUC will enable usage collection at a broader level. It will be useful for open-source projects where community leaders need to build roadmaps, focus resources (or not) on important features, and/or inform on feature deprecation.
Containers – another open-source ecosystem where no specific vendor is leading the community, and deployment metrics are few and far between that can justify investing in one solution versus another. An open usage collection system that allows any component of a containers or container orchestrator deployment will be useful for the community to make decisions.
Taking the OpenStack use case as an example, here is a similar architecture diagram of the various components and their relationship to one another:
OpenStack Architecture Diagram
This “OpenStack Architecture” example shows specifically how each component will function for the OpenStack use case. (Note: For the prototype built by NetApp, we used MongoDB for the object storage, and Metabase for the Dashboard, but these are just examples of the technology we used). You can also see how the DUC Client collects metrics from a variety of OpenStack services and bundles them for delivery to the Web Service.
With these use cases in mind, it would be easy to build in API calls that would notify the collection service which features are being used, how they are being used, and how often they are being used.
Other Considerations
“Usage collection” and “reporting metrics” are just two aspects of this project. Another very important topic to consider is the user’s ability to trust what data is being sent into the DUC platform (where a “user” is someone who deploys/administers the deployment/system). Most users are sensitive to sending data over the internet, and corporations are even more paranoid. Each use case addressed during this project should consider the best, most open, method for conveying what data is being collected. For example, in OpenStack, a Horizon plugin could be developed that displays the data bundle very clearly to the user.
There are other aspects that can be discussed/decided throughout the project, such as Authentication, Encryption, how to prevent vendors from artificially boosting their metrics (with simulated or spoofed deployments), and probably more.
Deliverables
The DUC Web Service – A deployed, cloud-provided service that ingests data bundles via REST API and stores data in a time-series data model
The DUC Dashboard – A visualization tool/dashboard for analyzing and reporting metrics from the content repository (prototype uses Metabase)
Two DUC Clients – Working prototypes for the following use cases:
an OpenStack Service
the NetApp Docker Volume Plugin (which is a NetApp plugin used in a Containers deployment)
A visualization tool for the admin/deployer of an individual system/deployment for each use case that inspects and displays the data bundle (for example, in the OpenStack use case, the visualization tool would be Horizon, but could also be a CLI tool to dump text).
Deploy StorageGRID WebScale as the back-end cloud-enabled object storage
Note: A proof-of-concept exists, and works end-to-end. It was hacked together in 2 days by a team of 4 developers during a NetApp hack-a-thon. More details and sample code can be provided.
BCBS of NC – Aardvark Data Visualizations
Opportunity
The healthcare industry is increasingly pushing the envelope on the IT front, exploring new technologies every day. Managing this IT portfolio is challenging and intensive. This is where Aardvark comes in as an enterprise impact assessment tool that consolidates project, application, process, people, and costs data from multiple sources providing a data-rich platform for determining enterprise impacts among people, process, and technology. Aardvark is a robust tool for managing many aspects of Blue Cross NC’s IT portfolio such as: Applications, Projects, Stakeholders, Capabilities, etc. By managing all of these entities in one place, Aardvark provides a single source of record for the company to maintain this data (see screenshot, below). Aggregating and relating this data in one place provides extensive opportunities for analyzing relationships. For example, for a given application(s), a network graph would be generated displaying related applications, projects, and enterprise capabilities. This network graph conveys a stronger and more concise message to the audience than a written report. For this project, we are looking for a dynamic in-browser graph/network visualization of important relationships in Aardvark’s dataset. This project will be integrated as a new feature to the existing Aardvark application.
Solution
We would like to be able to see individual applications, projects, vendors, etc. as nodes in a graph, with edges between them signifying relationships. Modeling value streams, another model/entity used by the business to classify/track work in the enterprise, would be a stretch goal, as this would require a working knowledge of some business processes, which students will develop as they interact with the simpler data objects. The ‘dynamic’ behavior involves clicking on nodes to ‘center’ them in the visualization, and see all related entities around the selected node/entity. There are many different tables/entities, with anywhere from dozens to thousands of rows in each, so the complexity in this project largely lies in figuring out how to make all of this reasonable/clear to visualize. The team will be encouraged to explore the effectiveness of different methods of data visualization:
Dividing datasets into many visualizations/pages based on categories,
Experimenting with ‘zoom’/depth controls,
Structuring specific dashboard views – for example roadmaps or timeline views that sequences - initiatives or apps that pertain to the immediate present vs those that are farther off in the future.
Depicting causal or dependency relationships
Highlighting specific opportunities or time windows
Creative ways to track and visualize costs, and opportunities to reduce costs.
Or other ways of helping stakeholders understand the significance of the data.
An important choice for the project is what library/technology to build the visualization on – the main constraint is the ability to integrate it with the existing web application. There are many JavaScript libraries and frameworks to choose from and that will likely have a large influence on how difficult it is to implement the visualizations. We suggest using D3.js directly as many other tools you may find are derivatives of this technology.
Since students will be building this system on top of an existing database, they will have access to a copy/dump that they can use to develop locally. In addition, they will have access to the entire existing codebase for Aardvark, though they will not be modifying it. They can use it to get a better understanding of the data model and how it is used within the application.
Existing Tech Stack
- Node.js
- JavaScript
- Express
- MySQL
- Docker
- HTML/CSS
Anticipated Work / Key Deliverables and Takeaways
For this project, students will:
Gather and analyze requirements for creating data visualizations
Utilize an agile approach to prioritizing and sequencing work
Deliver several iterations (sprints) of visualizations to the Aardvark application.
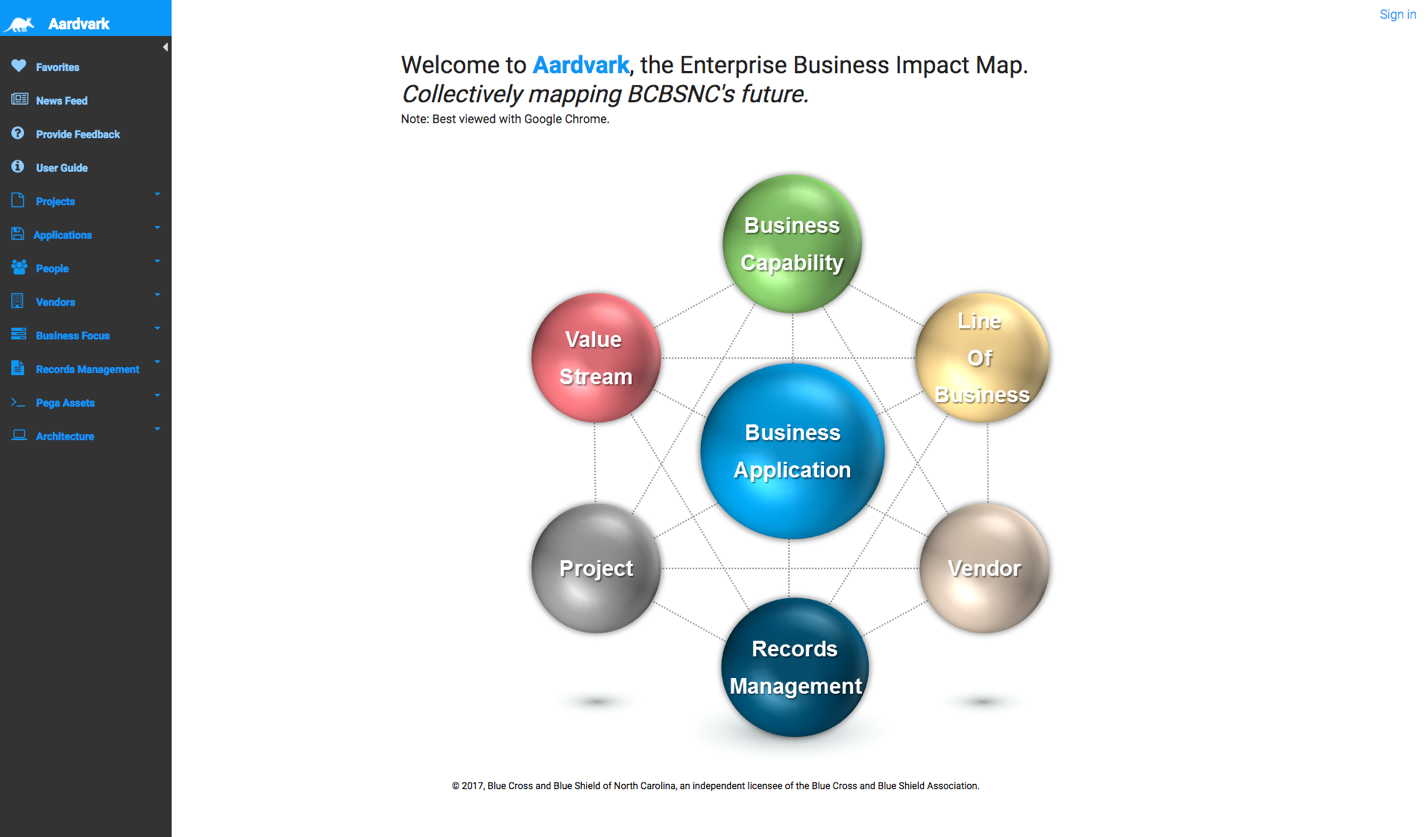
Screenshot of Aardvark
Students will be required to sign over IP to Sponsor when team is formed.
Capital One – Conversational Assistant for Portfolio Management
At Capital One, the Commercial Bank is a Top 10 U.S. bank providing banking services to business clients with annual revenue above $10MM. Comprised of more than 2,500 associates and more than 6,100 clients, Commercial Banking manages more than $70 billion in loan commitments and more than $50 billion in deposit balances, generating over $2.1 billion in annual revenue. The product and service groups within Commercial Bank include Capital Markets, Strategic Commercial Services, Commercial Business Risk Office, Commercial Operations, and Underwriting and Portfolio Management.
A crucial aspect of Portfolio Management is to better understand the metrics and risks associated with managing a diverse portfolio of loans, collaterals, and assets. The overall commercial portfolio is managed by a set of portfolio managers, which build relationships with their clients, and monitor the overall health and risk inherent in the portfolio. Considering this is lending to commercial clients, the risk to Capital One includes the client’s ability to generate revenue and the general health of the collateral underlying each loan. In addition, the portfolio managers are responsible for monitoring the commitments of performance made by our clients.
About this project
This project would be to use Amazon’s Echo Show to create a conversational portfolio assistant for executives in the Commercial Bank. This project would use portfolio and rating data to create an assistant to executives that includes portfolio managers up to the CEO of the Commercial Bank. The assistant would have a major feature:
Conversational Assistant - Using elastic search technology along with the portfolio and ratings database, allow the executives to ask questions about the portfolio. The student will be provided with a set of sample questions about the portfolio but the assistant should be developed to answer questions on a variety of topics. For example:
- How many accounts does <person> manage?
- What is the risk rating for <borrower>?
- Who is our largest relationship?
Suggested Technologies
It is suggested that the project is built using the AWS cloud and a true CI/CD pipeline. It is also suggested that the solution design include a true micro-service architecture. The technologies behind the application, service, and database stacks are at the discretion of the student, however NodeJS, AWS ElasticSearch, AWS CodeDeploy / CodeCommit / CodePipeline, and AWS RDS PostgreSQL are encouraged. The basic application / data flow should resemble the following:

Example application data flow
Capital One Support
The students will be provided with several flat files (15mb) which contain sample data used in Capital One’s proprietary and very cool Portfolio Management application, along with a data dictionary of those files. The files will be easily bulk copied into any standard database. In addition, Capital One associates will provide support at the beginning of the project for a project overview, and in creating the CI/CD pipeline, the initial AWS / Docker setup, and assistance in the software tool selection. Capital One will also provide each student with an Amazon Echo Show for the duration of the project. In addition, Capital One Associates will provide support and guidance throughout the project in person at the NC State campus at least one day every other week.
Company Background
Capital One Financial Corporation, a Delaware corporation, established in 1994 and headquartered in McLean, Virginia, is a diversified financial services holding company with banking and non-banking subsidiaries. Capital One Financial Corporation and its subsidiaries offer a broad array of financial products and services to consumers, small businesses and commercial clients through branches, the internet and other distribution channels.
Students will be required to sign over IP to Sponsor when team is formed.
Entrepreneurs - Open Door
The Problem
The social media of today has a stigma. At the core, the most popular networks are meant for remote interaction. Since this is their foundational purpose, these networks fall flat when attempting to bring groups of people together spontaneously. Do your friends ever have an outing without you because they assumed you were busy? How often do you sit at your home or local coffee shop shooting out messages to your friends trying to have a spontaneous get-together? Oftentimes, this attempt at socializing falls through. Why can’t there be a way to encourage spontaneous friend outings where you don’t have to waste time messaging people or planning ahead? Why can’t we just live life with the people we love?
Our Solution
Well, we believe we can do just that. Open Door is a mobile application that helps people have spontaneous get-togethers with their friends. The concept comes from a rather simple idea. In a college dormitory, when someone leaves their door open, it is an unsaid invitation to come in and hang out. Open Door serves the purpose of a “remote door.” It allows people to create a remote unsaid invitation for their friends to join in a spontaneous hangout without the hassle of planning or direct messages. Open Door will also have a way to manage friends. You can add and remove people from your friend list. Only those on your friend list will be able to see when your door is open and closed to ensure user privacy.
Technologies
We have decided on the following technologies for application development. In order to develop a dynamic and responsive mobile front-end, we will be using Mobile Angular UI and Bootstrap. We will use Java Spring MVC for developing the backend services. Spring MVC is great for creating a modular backend that is both easy to maintain and expand, it also includes a lot of features for integrating security into applications to ensure our users are protected. These qualities will be important for extending the base functionality of our application as we have many ideas for future features once we have created our MVP.
We want to test the full stack of our application, this way we know that both the service and UI layers are both working together seamlessly. We plan to use Appium and Cucumber for testing the mobile front end and Junit and Mockito for testing the backend. Since these are both automated testing strategies, it will be easy to run regression tests before introducing a new feature to our code base.
We will be using Git in order to collaborate on the project remotely and will either use IntelliJ IDEA or Eclipse Oxygen as our IDEs. These are both great options for developing applications with the above technologies.
Development Methodology
We will be following the Agile development methodology. Our team needs to work closely together in order to be on the same page as we work toward our MVP goals. We will meet at least once a week to have standup meetings during which status updates will be given and future short-term goals will be set. Our progress will also be kept up-to-date in GitHub issue tracking and Trello boards. This will help us stay organized and keep in mind our task list and corresponding priorities.
On GitHub, we will have a master branch which will contain the application code base. We will keep all regression tests as passing in master and ensure that all code is clean and well documented. This will be done by using Code Reviews in the Pull Request functionality of GitHub. The individual merging their feature branch to master will also be required to have proof that all regression testing is passing and that they have added testing relevant to the feature they added before a merge to master will be approved.
Senior Design Scope
We hope to implement the MVP of Open Door during the course of our Senior Design class. The MVP will consist of a way to manage friends as well as the features shown in our mockups. Once we have finished the MVP, we will migrate it over to the hosting server in the AWS cloud and test out the functionality through the use of our own mobile devices. By the end of the class, we hope to be able to have a small group of users that consistently use the app for spontaneous meetups in order to give a report of user experience and feedback.
A pre-formed team will be working on this project. Please only bid for this project if you are a member of that team.
IBM – Machine Learning for Syntactic Data Mining
Background
IBM estimates that the world is producing more than 2.5 billion Gb of data daily, and around 99.5% of that data is never analyzed. This unanalyzed data likely holds a trove of insights about the people, processes, and systems that generated it.
When presented with unstructured text data, the first task is to identify the significant tokens, which are then sent on for further processing. In natural language processing, the tokens are usually words and punctuation symbols. For analytics, the desired tokens may be words, dates, network addresses, timestamps, email addresses, postal codes, telephone numbers, and the like.
It is straightforward to extract useful tokens from unstructured data: try each of the patterns for the desired tokens until there is a match; if there is no match, advance one character position and try them again. Alas, this can be a very slow process…
But there is hope! Vast quantities of text data are semi-structured, and if we know how much and what kind of structure to expect, we can greatly speed up the pattern matching when compared to processing unstructured text.
Examples of semi-structured data that is produced in large quantities includes:
- HTML content, i.e. all the web pages in the world
- Application and system logs
- CSV (comma separated value) data files
Consider a data source that produces one of the formats above, such as scientific instruments that output large CSV files. We can write patterns (e.g. regular expressions) to match each field, and use those expressions to quickly read in a CSV file and convert it to fully structured data (e.g. in a database or in JSON or XML).
First, we need some basic patterns to recognize tokens of interest, such as the dates, times, email addresses, postal codes, and such that we mentioned earlier. Then, every time we get a new data file, we can write a pattern for each line of the file. For example, consider the many thousands of files available from https://www.data.gov/, where some are available only in CSV or HTML format.
Here are just two:
| Data source | Example entry (simplified for presentation) |
|---|---|
| U.S. Chronic Disease Indicators | 2015,NC,North Carolina,BRFSS,Chronic Kidney Disease,Prevalence of chronic kidney disease among adults aged >= 18 years,,%,"Black, non-Hispanic","(35.466220975000454, -79.15925046299964)" |
| U.S. Local Climate Data | WBAN:94846,CHICAGO OHARE INTERNATIONAL AIRPORT IL US,201.8,41.995,-87.9336,2014-03-01 00:51,FM-15,SCT:04 70 OVC:08 90,10.00 |
Notice how a single field can hold a year (2015), a state code (NC), a multi-word description with an interesting relationship clause in it (Prevalence of chronic kidney disease among adults age >= 18 years), a quoted string containing a list of attributes ("Black, non-Hispanic"), and other fields that contain multiple pieces of information (e.g. SCT:04 70 OVC:08 90 or "(35.466220975000454, -79.15925046299964)").
While it’s easy to extract the fields from a CSV file, we are interested in the information contained in the fields. When a field contains a date, we ultimately want to know the month, day, and year. When a field contains text like "age >= 18 years", we want to recognize it as a relation and label the individual parts: independent variable = "age", comparator = greater_or_equal, threshold = 18, unit = “years”.
Typical commercial approaches use regular expressions (regex)
Today, regular expressions are used to identify desired tokens like these. Unfortunately, regex are a shaky foundation on which to build a scalable, high performance solution for parsing files like these: regex are difficult to write and maintain; they don’t compose; and modern regex engines are susceptible to exponential slow-down on certain inputs.
It’s challenging to write a regex that reliably extracts all the key information from all of the data fields in the Chronic Disease CSV file. And every time you are given a new kind of file to process (e.g. Local Climate data), you have to repeat the work because the information encoded in the fields is different from the previous file.
A better approach is to automatically generate the patterns we need using sample data as input. After all, in given a CSV file, every line presents its fields in the same order (when they are present). It should be possible to learn which fields contain dates, coordinates, state codes, descriptions, etc., if we examine, for instance, 1000 randomly-chosen lines.
We can treat the sample data as if it were unstructured, looking at each field of each line and trying patterns for dates, coordinates, state codes, etc.
Generating regex is problematic, however, because (1) regex do not compose well, and (2) whether generated or hand-made, regex are hard to understand and maintain.
To address these shortcomings, we have created Rosie Pattern Language (RPL) (http://tiny.cc/rosie). RPL is a pattern matching language like regex but based on parsing expression grammars (https://en.wikipedia.org/wiki/Parsing\_expression\_grammar).
RPL is designed like a programming language:
- Composable patterns are bound to identifiers (they have names);
- Comments and whitespace are allowed within patterns; and
- Patterns may be grouped into lexically scoped modules.
- And, RPL has a library of built-in patterns for many common tokens, like dates, times, email addresses, and more.
Like regex, RPL patterns are written to match specific kinds of data
Because RPL patterns are easily composed (and regex are not), RPL is a good target language when automatically generating patterns. For example, the definition of date.any is a set of 7 alternatives, each of which (like rfc3339 and us) is a pattern that matches a specific date format:
any = us / dashed / slashed / eur / unix / alt / rfc3339
Given the input "Thu Jul 27", and the command to match the pattern date.any against this input, the outut might be:
{"type": "date.any",
 "data": "Thu Jul 27",
 "subs":
   [{"type": "date.unix",
     "data": "Thu Jul 27",
     "subs":
       [{"data": "Thu",
         "type": "date.day_shortname"},
        {"data": "Jul",
         "type": "date.month_shortname"},
        {"data": "27",
         "type": "date.day"}]}]}
The output shows the nested structure of the match: this is a date.any, it is in the unix format, and its 3 sub-components are day_shortname (value: Thu), month_shortname (value: Jul), and day (value: 27):
The example JSON output above was produced by rosie, but rosie was given a pattern to use, i.e. the pattern that fits the data was not learned. This is the command that produced the output above (where rjsonpp is a JSON pretty printer):
$ date | rosie -o json match date.any | rjsonppProject Scope
The goal of this project is to construct a system that reads sample data, learns its format, and produces a pattern expression that can then be used to process a much larger set of the same data . We are interested in recognizing (tagging) dates, times, network addresses, postal codes, and other data to be defined during the project. Information that is composed of non-trivial pieces must be broken down into those components, e.g. a date will contain matches for its month, day, and year.
The data sources on https://www.data.gov/ are a good domain for this project, because some data is available only in CSV or HTML or even plain text format, and not in a fully structured format like XML or JSON.
In this project, you will construct two methods of generating RPL patterns, given perhaps 100 or 1000 lines sampled from the real data. Your solution will read in the sample data, and output a pattern (in RPL). The real data will then be processed by Rosie using your RPL pattern. A good solution will allow Rosie to correctly match each datum in each field in each line.
The suggested approach involves constructing n-grams or tries of the types of data found in the sample data, where
"type"corresponds to the RPL pattern that matches a field (e.g."date.rfc3339","net.ipv4"). There will be challenging issues to tackle in making this approach work, and there is room for creative solutions.A second approach of your own design will complete the project. There are many machine learning libraries that make it easy to experiment. Alternatively, you can address a different data format, like HTML tables, using the first (suggested) approach.
If your system can learn the sequence of patterns that match each field in each file, then it can generate an RPL expression that parses the entire data file quickly. The goal is to run the same learning system on many different data files and generate a successful pattern for each one.
A successful project will be usable in practice by anyone who needs to analyze data that is provided only in a semi-structured format like CSV. In addition, your project will be a guide to data scientists who need to process data in other semi-structured formats.
Note: During the learning phase, you may use the “brute force” method of trying every pattern in the Rosie library against every data field. This would be too slow to be a good solution for large data, but will be fast on sample data
Suggested technology
Github for source code and issues, Travis for build, and a choice of programming language. Rosie (http://tiny.cc/rosie) will be used to execute the pattern matching.
License requirement
It is a project requirement that the deliverables produced can be contributed as open source under the MIT License, so that others may benefit from the work.
Ipreo – Collaboration Tool
Growing companies and organizations are constantly changing. People are used to sharing on sites like LinkedIn, Twitter, and Facebook about what’s going on personally and there’s nothing similar to that for their working life. Email, sharepoint and even slack aren’t good for more social interactions at work. A better and more interactive way is needed to handle this issue. Ipreo & Collaboration Ipreo is continuing to change and seek out new ways of connecting our global workforce on our initiative basis and even casual communication. Our teams are distributed, diverse, and need better ways to work together. We continue to look for ideas to help employees live our values which include enjoyment, collaboration, compassion, entrepreneurship, and candor.
This Semester’s Assignment
We are looking for a group of dynamic students who can help design and develop a user-centric collaboration tool to help Ipreo’s employee’s share and communicate in a rich and engaging way. The ideal solution would work on desktop and mobile with strong security for our enterprise. Some of the needs would include profiles, searching, discovery, and easy interactions between users and content.
We are looking for your ideas and technical expertise to create a dynamic solution that will help bring our talented people together. Students may choose technologies used for project.
NCSU Student Experience
Senior Design students in the College of Engineering, Department of Computer Science and design professionals at Ipreo will have a unique opportunity to partner together over the course of the semester to develop a private social network for Ipreo, as they would experience in real world product development. Additionally, students will have access to top industry professionals to assist in Agile/Scrum practices, overall developing/coding and testing.
Students will be required to sign over IP to Sponsor when team is formed.
LabCorp – Clinical Decision Support Using Natural Language Processing (NLP) II
Natural Language Processing (NLP) has many applications in the medical field. They include the ability to transcribe physician diagnosis, extract patient conditions and demographic information from text, derive medical treatment suggestions from medical texts, and many others. The use of such technology is in its infancy, however, many companies are starting to explore such capabilities. LabCorp hopes to be at the forefront of such innovative technologies in the medical field. NLP will enable the automation of many manual human oriented tasks to allow more efficient processing models.
With NLP and this project, we hope to be able to extract medical test result interpretation logic out of medical texts and journals. With this extracted logic, we can then build an interpretive engine to complement our existing Clinical Decision Support (CDS) tool. With the Clinical Decision Support tool, in combination with LabCorp data, we can make a significant contribution to patient health improvements. The tools that we will be using during this project will include Java, Stanford NLP, SemRep, Python, and others.
This project is designed to be the second part of a larger NLP endeavor. The NLP part 1 project included a lot of fundamental research and feasibility studies. This second NLP session is a continuation on findings of NLP part 1, and is meant to make improvements in terms of accuracy, applicability, and overall commercial feasibility of the product or service. Participants do not have to have prior knowledge of NLP part 1 and maintain the creative freedom to introduce new approaches.
Expectations and Goals
The outcome of the project should explore the translation of text based on domain-specific standards and create meaningful instructions for a computer system, specifically in the medical field. The application should be able to map medical terms to standard medical definitions such as ICD-10, SnoMed, and others. It should also be able to interpret the context of a specific instruction presented in the text, and derive intended action suggested by the text on the target defined. Once the instructions are extracted, they can then be turned into logic represented by data using a knowledge system. With this extracted logic, we can then build an interpretive engine to complement our existing Clinical Decision Support tool. The CDS tool that we will build, in combination with LabCorp data, can make a significant contribution to patient health improvements.
About LabCorp®
Did you know that the largest healthcare diagnostics company is right in your backyard? Based out of Burlington, North Carolina, LabCorp® has a lot of different research and development centers around the country including in the Research Triangle Park (RTP) in North Carolina.
Laboratory Corporation of America® Holdings (NYSE: LH), an S&P 500 company, is the world’s leading healthcare diagnostics company, providing comprehensive clinical laboratory and end-to-end drug development services. With a mission to improve health and improve lives, LabCorp delivers world-class diagnostic solutions, brings innovative medicines to patients faster and develops technology-enabled solutions to change the way care is provided. With net revenue in excess of $8.5 billion in 2015, LabCorp’s 50,000 employees serve clients in 60 countries. To learn more about LabCorp, visit http://www.labcorp.com, and to learn more about Covance Drug Development, visit http://www.covance.com.
Students will be required to sign over IP to Sponsor when team is formed.
Premier – Smart Integrator
Business Need
Companies that grow through mergers and acquisitions need a way to integrate various applications and their data sources into a cohesive product line by eliminating data redundancies and identifying source of truth.
Solution
The Smart Integrator will analyze the data structure of two systems and walk the user through a workflow of finding similar items that might be redundant, require mapping or data exchange between the applications. The initial prototype can just suggest similarities and let the user decide on how to merge or change tables. Automated merge can be identified as a stretch goal.
Example
Company AllAboutFood purchased two mobile applications, one called CheapRecipes, the other EatHealthy. Both maintain a list of ingredients that can be used in recipes and shopping lists.
CheapRecipes has a data source with a table called Ingredients in which each item is listed with the following attributes:
- Name (key)
- Unit of measure (key)
- Where to buy
- Recommended price
EatHealthy also has a data source with a table named Nutrients that has the following fields:
- Name (key)
- Unit
- Energy per unit
- Carbs per unit
- Fats per unit
- Protein per unit
- Contains gluten
- Contains dairy
AllAboutFood has to maintain both lists, and it would be inefficient to populate both tables separately with the same ingredients. Also, at this point the two lists are not the same and might have conflicting information about prices and units of measure which might confuse customers.
The Smart Integrator should ask the user what they want to do (find overlaps in data, find gaps in data in each application, identify source of truth, etc.), walk the user through the workflow by suggesting options and finally, offer a recommendation on the best way to combine, exchange or merge the data. The sponsor will provide data sets to be used for development and testing.
In this particular example, the Smart Integrator should identify the overlapping tables (Ingredients vs Nutrients), figure out that fields Name and Unit of Measure/Unit mean the same thing in both apps, and that the rest of the fields do not overlap. Then depending on what the user wants to do, it may suggest which fields to add to each table, or how to change the keys, perhaps create an additional mapping table or view, create interfaces between the apps to exchange data or a third data source to serve as a source of truth.
The tool should be visual and interactive, perhaps similar to source control compare and merge tools. The data source can be any relational database, preferably similar to SQL server.
American Red Cross – "LinkMe" – Patron Profile Linking
Opportunity
The American Red Cross plays a unique role in encouraging, preparing and assisting the communities of the US in responding to disasters, large and small. Chartered by the federal government, the Red Cross is charged to:
carry out a system of national and international relief in time of peace, and apply that system in mitigating the suffering caused by pestilence, famine, fire, floods, and other great national calamities, and to devise and carry out measures for preventing those calamities.
Americans show a very high degree of awareness of and support for the ARC, and our data shows that 1 in 2 adult Americans has a relationshipwith the ARC in some form, whether having donated for disaster relief, given blood, taken a safety course, or been supported in a time of disaster. But, most of these constituents would be surprised to learn that inside the ARC, all of these activities are taking place on different systems, and their overall relationshipwith the Red Cross can't be shown to them in one place.
The objective of this project is to change that! We want to allow our 100 million constituents to link their "accounts" across all of our lines of service so they experience their relationshipwith the red cross as one comprehensive relationship.
Solution
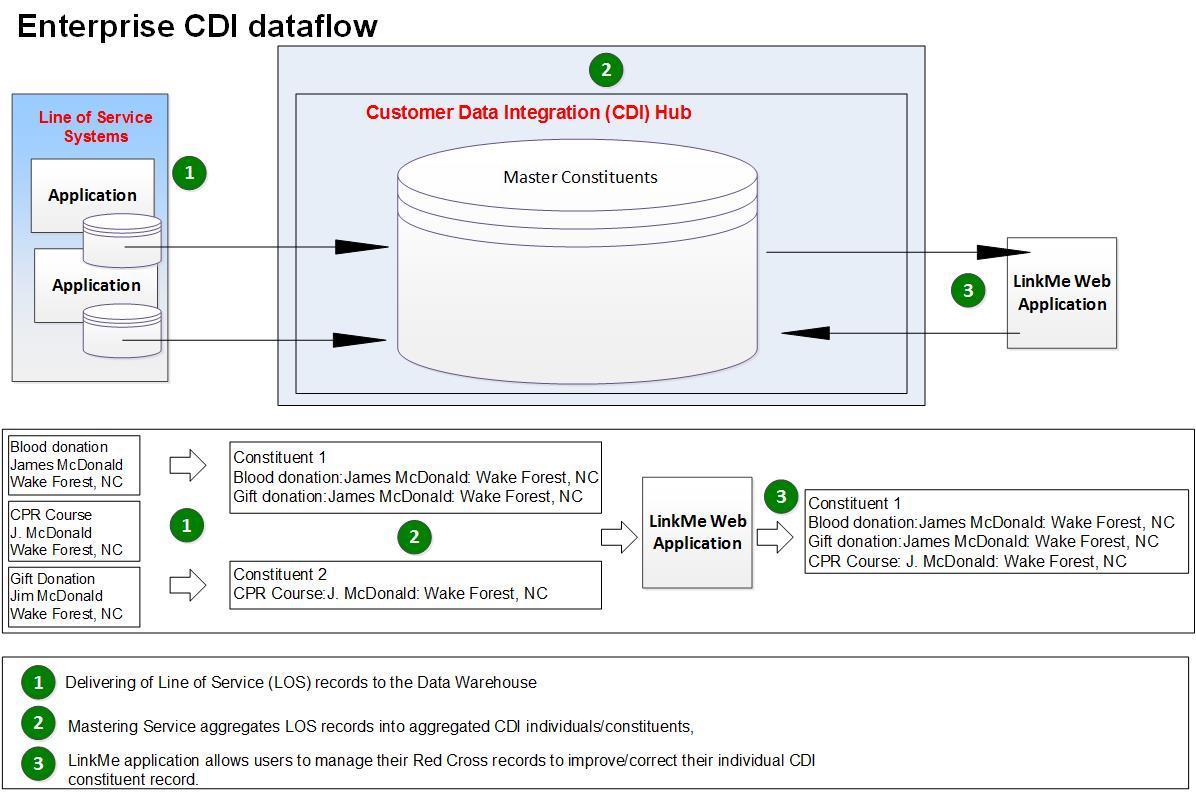
Our goal is to create a prototype of a constituent self-service "Link My Records" web experience, to allow our constituents, who have a www.redcross.org ("RCO") profile, to link their blood donor, learner, and gift donor accounts to their RCO profile.
Simple, right? Not quite. It is important that we allow a user to search among our huge data sets of donor, and learner records, but limit them to only being able to link accounts that we can be totally certain belong to them.
There are two important aspects to designing a solution for LinkMe:
- Data: Our blood donor data is an extensive data set. The donor record has birth date, blood type, gender, current and past addresses, phone numbers and emails. The donor visit record includes the date, time, place, who was the sponsor, whether a donation happened, etc. There are hundreds of data columns about the donor and their visits. The same is true for learner records, and gift donor records. So, aspect one of the project is to decide which of these columns are the best to provide in the UI for searching. What will be critical will be to pick columns that the user can make use of to locate their past activity and interactions.
- The User Interface: We envision this as an orchestrated dialogue, which addresses the need to protect ARC data from inappropriate access by the wrong constituent, and also the reality that the constituent may not readily remember or have access to certain details about long ago transactions. This might be a dialogue similar to a "missing stay request" in a hotel loyalty program, where the constituent is able to provide certain data points and the application searches our database to locate matching transaction activity. We also envision this to likely leverage the practice often used to grant access to highly sensitive data, where a series of options are presented to the constituent, requiring them to know the "right answers", these questions should not lend themselves to "guessing" but the constituent will know how to answer.
Lastly a pleasant and easy-to-use experience will be a must, in order to have constituents want to build out their profile.
The net effect of the process will be to provide to our Customer Data Integration (CDI) environment a set of transactional and line of service identifiers that the constituent has authoritatively stewarded and approved and to allow us to confidently display to the constituent their entire ARC patronage without concern about inappropriate data sharing.
Value Proposition
If we can design a compelling and usable experience, the goal will be to promote profile creation on our web portal, which would for the first time, create a true ARC patron, rather than just a blood donor, or learner, or volunteer, or financial donor. Ideally, simply by fostering an all-red-cross experience engagement view, patrons will be more inclined to work with ARC on more than one dimension and will enjoy seeing their overall profile and patronage with the Red Cross expand.
Technical Environment
The American Red Cross (ARC) engages with over 100 million constituents who serve as blood drive sponsors and blood donors, take training, give money, volunteer, etc. Each of these varied activities requires different IT systems, and consequently, our constituent records wind upbeing created and housed in many different platforms. Over the last five years, ARC has created a very powerful Enterprise Data Warehouse (EDW) platform that brings all of this data together into a single repository. This repository contains all blood donors, learners, and financial donors, and all of their transaction histories. It is from which this EDW that the LinkMe solution will read, write, and manage its data.
The EDW uses Teradata version 14.10 for storage. All TD requests will be handled through web service APIs. The web appitself will reside on an IIS server and will be built upon a .NET framework. The choice of UI for the application is left upto the students (ie. AngularJS).
|
Database Tier |
Service Tier |
UI Tier |
|
Teradata version 14.10 |
.NET(C#) WebAPI [RESTful service] |
UI of students' choice |
|
Host: Teradata Cloud |
Host: IIS server |
Host: IIS server |
Students will be required to sign over IP to Sponsor when team is formed.
BB&T – Cyber Security Enhancements
BB&T Corporation, headquartered in Winston-Salem, North Carolina, and its subsidiaries offer full-service commercial and retail banking and additional financial services such as insurance, investments, retail brokerage, corporate finance, payment services, international banking, leasing and trust. BB&T Corporation is an S&P 500 Company listed on the New York Stock Exchange under the trade symbol BBT. You can also learn more about us at www.bbt.com.
BB&T has been enhancing its cyber security program and would like NC State students to help us understand and anticipate attacks penetrating perimeter controls. We would like students working on this project to build a system using open source or newly developed technologies, such as honeypots on unattributed and contained networks (honeynets), that will attract cyber-threats and collect data about these attacks. Our long-term goal is to be able to proactively prevent attacks to our systems and networks, and we are hoping this project will give us insight into that process.
We have divided this project into three phases:
- Instrumentation: in this first part of the project, students will explore the use of existing technologies (or develop their own) to create a website that mimics logins and exposed application programming interfaces (such as eftx/ofx) that simulate online banking platforms. This platform will serve as a target for attacks and should collect relevant data from those attacks that would allow for exhaustive analysis. With the help of BB&Tand NC State's CSC IT, students will be able to deploy this system online to collect attacker data.
- Classification: after having a system tested and ready, and if time permits, students will begin working on identifying attacker behavior patterns to differentiate what is normal activity from what is malicious.
- Prediction: we would like to go beyond knowing that an attack is happening to actually anticipating attacks. In this phase, if time permits, and with what was learned in the previous phase, students will use collected data to identify early scanning patterns or probes that could proactively identify early warning signs of threats.
While we are flexible with the solutions used, there are many open-source honeypots that can serve as the foundation of the platform for development and research. BB&T will, of course, provide guidance as needed. This independent research will provide BB&T with the ability to apply proactive protections on perimeter controls while establishing behavioral baselines to track threat actors' activity.
Students will be required to sign over IP to Sponsor when team is formed.
Bronto – Data Exploration Space™
Bronto Software offers a sophisticated marketing platform that sends billions of messages and tracks billions of events each month. We primarily send emails (plus some SMS), and then record events such as opens, clicks, page views, and purchases. It is these data that we analyze and report to our clients to give them a clear view of how their campaigns are performing.
Making large-scale data usable while maintaining high performance is difficult and a lot of effort goes into providing Bronto's clients with the specific views of their data that are most valuable to them. Those data end up living in varied storage technologies (MySQL, hBase, HDFS, Redis) with dissimilar performance characteristics. In addition to clients' data, Bronto also has vast amounts of metadata (e.g., audit logs of user actions), performance metrics (e.g., how many emails we sent during the past hour), and logs (unstructured data about everything that has ever happened anywhere in the platform). When a contact clicks a link in one of our emails, it kicks off a series of events within the platform that may result in dozens of events being recorded in various internal systems, and the number/location/characteristics of this event vary for each client, due to the configurability of Bronto's automation features.
Exploring all this data requires very manual processes which engineers must make up as they go. We may need to debug a system, prove to a client that there is no bug, or look for the next performance improvement that will help us scale up to meet next year's needs. In all cases, the engineers must write SQL queries, Map/Reduce jobs, or construct new graphs to provide themselves and their colleagues with views into the system which are informative and not simply noise. And they must do this without locking up an entire database. The best engineers are those who can parse and present these data such that they illuminate the performance bottlenecks in their systems. This is what you'll learn about this semester.
In the past we've used tools like Splunk, Kibana, and Elasticsearch to make these investigations less onerous. Those tools aggregate data from multiple sources, but they have limitations:
- They're not programmable. Often we come to end of what we can do with simple search indexes and graphs and feel stuck because we can't just write a script to fit that last piece of the puzzle.
- They're logs only. We would have much more power if we could programmatically cross reference logs with the data in our production databases.
This semester, you can help us build a powerful tool which addresses those limitations. Your team will create a data exploration space™ using iPython Notebook or a similar technology. You'll need to get the notebook system running on a VM and make some of our data sources available to any scripts written in these notebooks. Then, time permitting, you'll build a few utility libraries and live data analysis notebooks as a proof of concept.
Example Utility Libraries
Client performance report:
A notebook that calculates a bunch of metrics about one of our clients. At the top of the page, a Bronto employee would enter a particular client's account info and then wait for the notebook to run. The resultant page could include things like their contacts' average time to first purchase, demographic breakdowns of the client's contacts and how they've changed over time, etc. These are things that would be helpful as internal tools with limited use, but would require much more work and hardware to be handled in real-time for all clients. With an internal tool such as this notebook, our Professional Services people could run one of these reports in advance of a client meeting (allowing time for it to process the data), and use the result to provide the client with useful knowledge about their business and how to improve it.
It's not me, it's you:
A client implements a custom integration with Bronto using our public APIs. Then, something unexpected starts happening to their contact data. They report a bug. We have to search in our logs to find records of their API integration activity so we can tell them "your code did this, and it came from that IP address". This is a very manual process and it's not always conclusive because the effort required to precisely pin one action to one API call is too onerous. If it were automated, you wouldn't even need an engineer.
Dell EMC – Server Utilization & Workload Characterization via Unobtrusive Monitoring
Background
Durham Center of Excellence is the premier lab in Dell EMC. Over 40% of all equipment allocated to labs in Dell EMC is at the Durham Center of Excellence. Hundreds of thousands of servers, arrays, and networking switches are tested with millions of manual and automated tests by thousands of Engineers every day.
The Infrastructure Engineering & Operations (IEO) Team is charged with Automation and Monitoring of this environment. We write automation software to monitor hardware configurations, software configurations and provision the same. Tracking this many devices, understanding the workloads, and projecting future requirements is a monumental task. Lab workloads do not conform to production norms, having much higher variability and lower predictability. In some cases, measurement can interfere with the intent of a test or the performance of a workload. Ideally, we'd like techniques for monitoring utilization unobtrusively, so the monitoring doesn't impact product test/development.
The focus of this project is create a Docker-based micro-service that creates a multidimensional description of server workloads and usage, interfering as little as possible with the actual workload.
Existing Solutions
An important part of this project that should be done early on will be to research existing open source monitoring solutions that are available today and look to leverage and possibly extend existing capabilities to help deliver on the customer requirement of proven unobtrusive monitoring.
Project Scope
The project being proposed consists of two phases: (1) Create the micro-service monitoring application which will pull data intrusively as well as unobtrusively from the server under a variety of workloads. (2) Examine the data collected unobtrusively and the data collected intrusively to find a correlation for a set of workloads. Provide recommendations of nonintrusive measurements for basic types of workloads.
Phase One
Create the design and implementation of the micro-service application that monitors the servers. The application should:
- Be able to monitor, allocate, and manage the micro-service itself to provide the optimum number of polling agents.
- Collect server data in a NoSQL database.
- Poll the server's BMC card via IPMI and/or RedFish/bmc and/or CLI. to obtain unobtrusive data from the server.
- Poll the server via OS to obtain intrusive data.
- Application can be written in Python, Java, JavaScript, or Ruby.
- Application should run in a CentOS Docker Container
- Data can include but not be limited to Disk IO, NIC IO, HBA IO, CPU Utilization, Memory Utilization, login access, NIC/HBA Power, Fan Power, CPU Power, Memory Power, Motherboard Power,PCI Slot Power, PSU Efficiency Loss, Disk Power, OS Power settings, BIOS Power Settings, Others as suggested by the team, HW and SW configurations
- Workloads can include but not be limited to: NAS Functional Test, Block Functional Test, Unit Test, NAS Performance, Benchmarks for NAS, CPU, Memory, Block IO, Network IO
Phase Two
Phase 2 is an open-ended evaluation and analysis phase using the micro-service application to do one or more of the following. How many and which of these items are done will depend on the capabilities of the software developed in Phase 1 and the time and resources available after Phase 1 is completed.
- Determine if there is a correlation between workload, intrusive data(example: IO), and unobtrusive data(example: power for instance)
- Determine if workload type can be established by nonintrusive data analysis "signature"
- Extend the examination to different OS's
- Extend the examination to different models of servers.
- Extend the application to retry requests denied due to lack of connectivity etc...
- Extend the examination to different workloads
- Others as suggested by the team or by their analysis.
Benefits to NCSU Students
This project provides an opportunity to attack a real-life problem covering the full engineering spectrum from requirements gathering through research, design and implementation and finally usage and analysis. This project will provide opportunities for creativity and innovation. EMC will work with the team closely to provide guidance and give customer feedback as necessary to maintain project scope and size. The project will give team members an exposure to commercial software development on state-of-the-art industry backup systems.
Benefits to Dell EMC
The application will act as a prototype for the nonintrusive measurement of server workload. The ability to poll thousands of servers unobtrusively and determine what types of workloads will be invaluable to Dell EMC in understanding their current efficiency and utilization and project future requirements.
Company Background
Dell EMC Corporation is the world's leading developer and provider of information infrastructure technology and solutions. We help organizations of every size around the world keep their most essential digital information protected, secure, and continuously available.
We help enterprises of all sizes manage their growing volumes of information—from creation to disposal—according to its changing value to the business through big data analysis tools, information lifecycle management (ILM) strategies, and data protection solutions. We combine our best-of-breed platforms, software, and services into high-value, low-risk information infrastructure solutions that help organizations maximize the value of their information assets, improve service levels, lower costs, react quickly to change, achieve compliance with regulations, protect information from loss and unauthorized access, and manage, analyze, and automate more of their overall infrastructure. These solutions integrate networked storage technologies, storage systems, analytics engines, software, and services.
Dell EMC's mission is to help organizations of all sizes get the most value from their information and their relationships with our company.
KPIT – WorkWear – AR Smart Glass Platform Enhancement
KPIT has developed an Augmented Reality Smart Glass wearable platform called WorkWear (https://workwear.kpit.com), and created many enterprise solutions on top of this platform, to solve industry problems in the areas of logistics, guided remote diagnostics, service maintenance, manufacturing assembly, and inspections.
Currently, WorkWear solutions are certified on Vuzix M100 / M300 smart glasses. These smart glasses run on Android 6 (Marshmallow), and feature an HD camera, dual band Wi-Fi, speakers and noise cancelling microphones, and GPS. WorkWear uses a custom AR technology stack and works on offline voice engines such as "Sensory".
For this Senior Design project, we would like to extend WorkWear's features. Students will set up the current WorkWear library structure and components and get hands-on with the underlying technology stack. KPIT will provide access to the WorkWear Platform. While testing can be done on an Android emulator, students will be able to come to our Centennial Campus office where KPIT will provide students with access to M300 Smart Glasses for testing.
Students will be able to choose between these two extension areas:
Option A – Voice Commands, Barcode Scanning, and Image Recognition
- Voice Commands: Use the CMU Sphinx voice engine (or any similar open-source voice libraries) to support custom voice commands.
- Barcode Scanning: Add support for online barcode/QR scanning (scanning from the camera feed without first initiating a command) from the M300 Smart Glass' camera. Students are welcome to use Wikitude or a similar open-source AR engine for this. We would also like to add support for Bluetooth-based ring scanners (or any other Bluetooth scanning devices) to the M300 Smart Glass hardware. While KPIT at present doesn't have a Bluetooth-based ring scanner to test, we will provide the model name/number of this ring scanner so that students can simulate this hardware for testing.
- Object Recognition: We would like to have the Smart Glass pop up details about an object when recognized by the Smart Glass' camera. The details of the recognizable objects will be preconfigured on the device. Object details can be text or part of the object itself.
Option B - Video Streaming and Communication
Construct a streaming engine with facilities to stream live video from the Smart Glass. We would like to support two-way audio between a Web portal and the Smart Glass, Smart Glass to Smart Glass communication, view sharing (this can internally happen via the streaming engine), screen annotations on the Web portal, and sharing to Smart Glass users. We would also like for Smart Glass users to be able to pull documents on-demand (e.g., from a repository).
The streaming engine MUST work on a slow network with acceptable latency. The quality of the video stream may be adjusted based on available bandwidth. Should have scaling ability and work on fail safe mode.
Students are welcome to use libraries similar to BigBlueButton (but NOT BigBlueButton; we've encountered issues with it) to implement this functionality.
Students will be required to sign over IP to Sponsor when team is formed.
LexisNexis – Law Firm Suggestion API
An API for rating and suggesting law firms based on their performance
LexisNexis provides a product called CounselLink, which is a legal matter management and billing software solution. Corporate legal teams use CounselLink to manage the interactions between their legal teams and the various law firms that they contract their legal work out to. We would like to provide the ability for the corporate legal teams to rate their experience with their law firm on completion of a legal matter. We would then like to be able to display various information about the law firm ratings to other corporate legal teams, as well as suggest law firms for specific cases, so that they can make more informed decisions on which law firms are best suited to handle their legal matters.
Description
The Law Firm Ratings API will be a RESTful API, implemented as a micro-service, that will provide the ability to rate a law firm's performance on a legal matter, and provide various analytics and suggestions based on those ratings. A front-end UI will be built on top of the REST API to display the various information.
Ratings
- The API will allow corporate legal users to rate their experience with a specific law firm on conclusion of a legal matter. The user will rate the law firm's performance in the following industry-standard categories on a simple 1-5 scale (1 being the worst, 5 being the best):
- Communication Ability
- Responsiveness
- Quality of Service
- Value for Money
- In addition to the above ratings, the user will also submit a free text review describing their experience with the law firm.
- The API calls will be authenticated via a JSON Web Token (JWT), which will contain identifying information about the user submitting the review (user ID, customer ID). The JWT will be verified via a shared secret.
Analytics
- The API will provide some basic metrics around the rating information such as:
- The ratings in each category for a specific law firm
- The top X law firms in each category sorted by rating
- The top X law firms in each category sorted by rating for each type of legal matter
- In addition to the basic metrics, the API will use Natural Language Processing (NLP) to perform sentiment analysis on the free text portion of the review, and determine a score based on how positive or negative the review is.
Suggestions
- Using the information that we have gathered, the API should provide top suggested law firms to a corporate legal customer for a given legal matter type. A full list of standard legal matter types will be provided, but will consist of things such as "General Litigation", "Civil", "Domestic", etc.
- The suggested law firms will be determined by an algorithm the project team will create which will take into account:
- The type of legal matter
- The customer requesting the suggestions (prefer reviews from the same customer)
- The ratings for the law firms in the various categories
- The sentiment scores that we calculated from the law firm reviews
- The user should be able to adjust the weights of the various components of the algorithm based on their preferences. For example, if they care a lot about Value for Money, but not as much about Communication Ability, the algorithm should adjust accordingly.
User Interface
- A simple user interface will be built on top of the API to expose the various analytics and suggestions in a user-friendly format
- The basic metrics and sentiment scores should be displayed in the UI and filterable by legal matter type and by a date range
- The law firm suggestions should be able to be retrieved and displayed in the UI given a legal matter type and suggestion preferences
Technology
The API will be implemented as a standalone micro-service, and will provide a RESTful API. The following technologies will be used for this project:
- Java 8
- Spring/Spring Boot
- A Java Restful web services framework (your choice). Some options are Spring MVC, RESTEasy, Jersey
- A SQL Server relational database (you can use SQL Server Express)
- Angular JS/Bootstrap for the UI
A very useful framework you may want to check out is called JHipster. JHipster provides all of the boilerplate code to glue all of the above technologies together. https://jhipster.github.io/
Students will be required to sign over IP to Sponsor when team is formed.
SAS – Google Drive and Dropbox integration with SAS Drive
The goal of this project is to provide a bridge between a new SAS product and commonly available cloud storage platforms. SAS Drive uses an interface called a Drive Provider which allows access to files, folders and actions that can be performed on those objects. The primary goal is to implement a Drive Provider which accesses Google Drive content so that it can be incorporated into SAS Drive. If time allows, a Drive Provider for Dropbox should also be created.
A key part of this project is the development of a Drive Provider test harness which will exercise the access to files and folders, exercise the actions which can be performed on certain types of files and folders, and provide repeatable performance data. This test harness should work with any Drive Provider, including the ones written internally by SAS.
In addition to the test harness, unit tests for the Drive Provider should cover more than 80% of the code and 66% of code paths.
The development of the Drive Provider(s) and test harness will require the understanding significant use of asynchronous programming using Javascript Promises. This will be an invaluable lesson for students who plan to develop real world applications for enterprise usage.
All code will be written in Javascript and should run in a node.js environment. There is no user interface code necessary for this project, but the team may want implement a simple user interface to demonstrate the Drive Provider(s) in a more visible way.
The NCSU team will be provided with all of the interfaces and documentation necessary to properly implement a Drive Provider.
Project Archives
| 2026 | Spring | Fall | |
| 2025 | Spring | Fall | |
| 2024 | Spring | Fall | |
| 2023 | Spring | Fall | |
| 2022 | Spring | Fall | |
| 2021 | Spring | Fall | |
| 2020 | Spring | Fall | |
| 2019 | Spring | Fall | |
| 2018 | Spring | Fall | |
| 2017 | Spring | Fall | |
| 2016 | Spring | Fall | |
| 2015 | Spring | Fall | |
| 2014 | Spring | Fall | |
| 2013 | Spring | Fall | |
| 2012 | Spring | Fall | |
| 2011 | Spring | Fall | |
| 2010 | Spring | Fall | |
| 2009 | Spring | Fall | |
| 2008 | Spring | Fall | |
| 2007 | Spring | Fall | Summer |
| 2006 | Spring | Fall | |
| 2005 | Spring | Fall | |
| 2004 | Spring | Fall | Summer |
| 2003 | Spring | Fall | |
| 2002 | Spring | Fall | |
| 2001 | Spring | Fall |