Projects – Fall 2012
Click on a project to read its description.
Call Probing
Background
Inetwork is a division of Bandwidth which manages a nationwide Hybrid voip/traditional voice network. On the VoIP side of our network we use SIP (rfc 3261) to signal and setup calls, and RTP (rfc 1889) for audio. Inevitably we have quality issues periodically throughout the network and we are looking for an application to help us monitor and track these issues across the thousands of circuits and endpoints we manage.
Prerequisites
Basic understanding of computer networks.
Benefits to Students
- Opportunity to learn details of a VOIP and traditional telephony network.
- Multi-tier architecture presents opportunity to design and develop UI experiences, back-end systems components, and a highly scalable data-tier persistence layer.
- Exposure to a broad set of open source tools and technologies for application development.
- On-campus collaboration with Bandwidth employees at our new office in the former Red Hat building on Centennial campus.
Benefits to Bandwidth
Building intelligence into these probes can produce meaningful information in terms of QoS on a daily basis.
Details
This application would need to create and answer calls from a series of freeswitch instances (freeswitch.org). It will need to monitor and track the status of those calls, as well as pass audio over successful calls to verify the voice path is good. We call these “Call Probes.” Each probe will specify a destination phone number that will route differently across our network and thereby test different network paths.
The application needs to allow us to add new numbers as destinations for probes, and then manage those probes ensuring they are tested often and successfully. When a probe is not successful, the application should use SNMP to notify our network monitoring platforms of a problem. For smarter probing, we would like to assemble sets of probes in logical groupings that we can tie to the common paths on the network those probes share. Leveraging this we would like to be able to identify when a set of probes goes off, what their common paths are, and identify those paths as the potential problem points.
Time permitting, we would like to tier probes, so that if a certain path is deemed questionable the application can react automatically, launching probes specifically to test those paths to ensure we produce accurate results.
To tie all this together we need the application to be web driven, and surface a set of common analytics over the data collected.
Potentially we can also monitor our SMS platforms to ensure we have no interruptions in the messaging flow. We would also like to be able to trigger simpler more direct probes, maybe a PING or in the SIP world, an OPTIONS message to test directly an endpoints validity.
Artificially Intelligent Customer Clustering
Description
Students will build a web app that helps Bronto clients better know their customers. Our clients use Bronto’s SaaS app to collect data about their customers’ demographics and activity relating to their email. Most clients use the tracking data (e.g., how many people opened my email, and how many of them came to my website) to measure the success of their marketing campaigns after the fact. Rarely, however, does a client use all this valuable data to help drive the decisions they make during a campaign.
What if a specialty tool shop, targeting burly biker types, was actually selling a lot of tools to fashion-conscious hipsters who use their products to knit the scarves they like to wear to mid-summer concerts? That would warrant a drastic change in how they present their products to that portion of their customers, and it would represent a significant optimization that they’re completely missing.
We’d like to see what you can build using Apache Mahout, an open source machine learning library. Apache Mahout provides a collection of pre-built ML algorithms that run on a Hadoop cluster, Bronto will provide data and computing power, you will provide the brains. We will work iteratively with you to spec out a decent feature set: start small and dream big.
We can’t wait to see what you can accomplish in a few months’ time.
Requirements
- Use jQuery for AJAX and/or user interface manipulation: http://jquery.com. Use JSON as the data format for transport
- Support at least IE8+, Firefox 3.x+, and Chrome. No Adobe Flash.
- The application will be independent of the Bronto Application/Platform. We will be providing you with sample data that has been scrubbed from our production systems.
- Code should be written in the Zend / Java style for class / variable naming; brace and spacing placement, etc. Classes / methods / functions should have PHP/Java docblocks.
- Initially, you should set up your own local Hadoop cluster for development purposes. Once you have things up and running with a small sample data set we provide, we will move to a larger cluster that we will provide in Amazon EC2. To set up Hadoop locally:
- Start with Apache Mahout here: http://mahout.apache.org/ Getting started
Design
- While the application you develop will be stand-alone, assume that a typical Bronto user would be the target user. Our users vary in terms of technical ability, but a core design principle of our software is to make complicated problems easier to solve, and complex data easy to visualize.
- We will provide stylesheets for the basic outline of your app if you prefer not to focus as much on UI work.
- Example feature: given a set of customers’ demographics, cluster them using Mahout’s implementation of K-means. Then report the average revenue from each cluster in your web app.
Valuable Skills You May Use/Learn
- Java/JVM programming
- Machine Learning
- Hadoop/Hbase/Map Reduce
- Web development
- Project specification
- Iterative development
Company Background
Bronto Software provides the leading marketing platform for online and multi-channel retailers to drive revenue through email, mobile and social campaigns. Over 1000 organizations including Party City, Etsy, Gander Mountain, Dean & Deluca, and Trek Bikes rely on Bronto to increase revenue through interactive marketing.
Bronto has recently won several awards:
- NCTA 21 Award for Software Company of the Year 2011
- Stevie Award for Best Customer Service Department in 2009 and 2010
- CODIE Finalist for Best Marketing Software in 2011
- Best Place to Work by Triangle Business Journal in 2010 and 2011
- CED Companies to Watch in 2010
In 2002, Bronto was co-founded by Joe Colopy and Chaz Felix out of Joe's house in Durham, North Carolina. Since its humble beginnings, Bronto has emerged as a leader with a robust yet intuitive marketing platform for commerce-driven marketers.
Bronto's long-term focus on its customers, products and employees is now resulting in accelerated growth - its 60% growth in 2010 contributed to being listed as one of Inc Magazine's Top 100 fastest growing software companies.Using a NoSQL/DHT-based platform for an OpenFlow/SDN Controller
Software Defined Networking changes the current per-device intelligence of geographically diverse networks to a model of a central, or at least apparently central, controller. Whilst data forwarding is still carried out autonomously by the individual devices once the flows have been set up, defining those paths and implementing that policy on each device in the data path now becomes the responsibility of that central control function.
As such, the role of the controller is to maintain a database of endpoints, services and capabilities, and select the correct flow-path.
It is therefore essential that these flows are inserted both accurately and in a timely fashion such that the operation of the controller has no appreciable impact on the setup time of the flow. This becomes especially difficult where the flow is being setup over a large geographical distance or across networks of varying quality or between different spheres of control, such as across two-or-more service providers.
Traditional database methods such as SQL with replication and publisher/subscriber contexts all suffer with their ability to maintain concurrency over the WAN. They also make federations of information repositories difficult to achieve, as they require a tight relationship between each of the datastores.
During the last academic year, a Senior project investigated alternative approaches to the distribution and management of data in the OpenFlow/SDN controller by utilizing an “NoSQL” approach. The project commenced in phase one by building a standard, Floodlight-based OpenFlow controller using in-memory database.
Phase two of the project abstracted the connection between the Floodlight controller and a more generic database connection using ODBC. At this stage, a standard SQL-based database was still being used. This section of the project is complete. Equipment, software and documentation exists for this phase.
Phase three was designed to replace the SQL database with a No-SQL model. This phase was not started. Phase three is the area which the 2012/2013 Senior project should focus on. Replacing the MySQL database with a Cassandra database, writing/debugging the abstraction layer between Floodlight and Cassandra and proving functionality in a typical OpenFlow network would be the expected outcomes of this project.
Phase four should examine the effects of multiple No-SQL databases on a single data network, and propose a method by which the source of information can be most accurately used by the network topology. Most of this phase is probably beyond the scope of a Senior Year project and it is intended to take this section to more detailed research.
Visualization of Financial Data
Overview
This document represents a collaboration effort between Deutsche Bank and the students of NC State University's Design School and Department of Computer Science for the Fall 2012 Semester. The goal of this collaborative effort is to provide a cross-discipline team of students exposure to a real life exercise with a focus on technology and design in the investment banking space. This effort benefits the students through exposure to real-life challenges while providing Deutsche Bank with product design and development thinking from outside our day-to-day banking environment.
Within Deustsche Bank, there exists a "Senior Management Risk Dashboard" product that was created to allow key information for "Group Risk", to be available in a single online application. This application is, in simple terms, a "Business Intelligence Application". There are many across the bank and the one described above is to be used as an example to assist in this collaborative exercise.
The business intelligence application that we will share with the students during the course of this collaborative effort has been designed to be an attractive and intuitive way for users to access data and identify risk within the bank. This data (prior to this application) was historically available via PowerPoint slide presentations and spreadsheets that were reviewed in structured meetings every other week or each month. The amount of effort involved in gathering the necessary data from different resources as well as the manpower necessary to create and present the information was substantial. This application has begun to solve most of these problems by employing a uniform way to view data and have it available, on demand, from the user’s desktop. This product is pushing technology, deployment, and organizational boundaries by using the latest web development technologies to deliver a rich internet application, scrum development and deployment methodologies, and cross divisional involvement for greater adoption of the proposed designs.
Problem Statement
The current application has already proven its value in meetings and other settings where it has allowed teams to "go paperless". More importantly, the meetings now have relevant, live, dynamic data available during the actual meetings. In order to gain greater adoption of a product such as this, we see the need to provide for the 'creation of and sharing of data and information within the application with other members or managers across the organization'. The challenge here is to find a way to design a feature (for any business intelligence application) that allows for the 'creation of' and 'sharing of' information and experiences with the goal to inform others of key data points and/or potential problems.
Disclaimer
For the purposes of this project, an example business intelligence application will be shared in face-to-face meetings only. Deutsche Bank will not provide source code and/or any data specific to an application other than a printable deck of screen-grabs to be used in workshops and explanations of the overarching concept. The idea here is that the desired functional features Deutsche Bank is asking for should be able to be designed and developed regardless of the actual application and/or content they are being developed for. In other words, Deutsche Bank is interested in detailed design concepts and working coded prototypes that provide solutions to the below functional and design features, regardless of data and content types. That said, financial-related data and content would be ideal given the dynamic nature of market data, etc.
Desired Functional Features
- The user should be able to indicate a specific node or area or section on an application screen. (think google maps where a user can create a journey on a map)
- The user should be able to attribute a 'note' to the node or area or section of a page. (think word or powerpoint where a user can add a sticky note)
- The user should be able to save or capture or bookmark or compile the above mentioned criteria into a 'journey' or 'catalog'
- The user should be able to sequence, play, re-play, edit, share, etc. these 'captured' artifacts.
- The user should be able to share these journeys or catalogs with specific individuals or with groups.
- There should be user-level and group-level permissions for creating, viewing and accessing journeys.
- The user should be able to modify and/or delete previously create journeys and/or catalogs
Desired User Experience Design Features
- The user should be able to indicate a specific area or section of a screen, or the whole screen and capture it.
- It should be clear to the user how he/she can create a journey or catalog item.
- It should be clear to the user what he/she can do with the journey content (nodes, sections, screen, notes, etc.)
- It should be clear when the users is in capture mode, viewing mode or in playback mode of a journey, as well as when they are not.
- The user should be able to step away from or stop the journey while 'in' the application.
- The 'tool' or 'feature' should not interfere and/or impede with the users ability to investigate further any information that is displayed to them in the creation or viewing of a journey.
- The user should be able to create, view, edit, etc. the journey while in a specific application (i.e. iMovie, flickr, google docs, bloomberg, etc.).
- It should not be a difficult process to learn how to create a journey. (standard practices for artifact creation should apply, think iPhoto)
- The user should be able to see some statistics on a journey or catalog. (How social is it? What impact is it having? Who has it been shared with? Who else has shared it? Who has looked at it?
- The user should be notified if a journey or catalog has been shared with him/her or his/her group.
Desired Outcomes
- Students should expect to carry out a Design Review of ongoing solutions / ideas / progress every two weeks.
- Students should expect to keep the broader team updated using online tools such as asana.com and notableapp.com.
- A working coded application that meets and/or exceeds and/or expands upon the above criteria.
- A number of design solutions that meet and/or exceeds and/or expands upon the above criteria.
- Sketches and process artifacts that showcase design thinking (the journey over the destination)
- An innovative implementation, concept, or idea that we are currently not using and or asking for... Feel free to collaborate, explore and share.
Data
- An existing business intelligence application will be available for viewing and hands-on use during the course of the project during face-to-face meetings only.
- Printable Screens will be provided of an example application.
- Access to a shared online project management tool will be provided by Deutsche Bank (via www.asana.com)
- Access to a shared online design review and presentation tool will be provided by Deutsche Bank (via www.notableapp.com)
Custom Daily Usage Application
Historically, Duke Energy customers have been billed based on monthly energy usage. Readings are taken each month, and the difference is used to create the customer’s bill. With the installation of smart meters, Duke Energy can collect energy usage measurements at 15-minute intervals. This allows for new types of billing programs and gives customers greater insight into their energy usage. Customers with smart meters can currently view their daily energy usage online, but this tool has several limitations. The NCSU team will create a more intelligent daily usage application with the ability to alert users to specific events in their energy usage, which will be defined in the application. Basic requirements are as follows:
- This application would consume and display graphs of daily usage using HTML 5 so that it is compatible on full desktop and mobile handheld devices.
- This application would also be available as a native iphone or android application so that we can leverage the native alerting functionality.
- Alerting will be predictive based on the usage data, weather data, and time of the day. Alerts will notify customer of high usage based on thresholds and offer tips to help the customer cut back.
- Alerts will be multi-channel allowing the customer to choose sms, email, or native app.
Creativity is encouraged, particularly with the charts and graphs the team chooses to use. For example, Google has a good charting API for working with data objects.
Cytogenetic Testing via Computer Vision and Analysis
The overall goal of this project is to reduce the time and improve the accuracy of cytogenetic testing by incorporating computer vision and related analysis into the testing process. Cytogenetics is used to diagnose birth defects. Chromosome abnormalities have been associated with birth defects, mental retardation, infertility, pregnancy loss, hematologic disease and cancer. Prenatal cytogenetic analysis has become the standard of care for those patients at increased risk because of advanced maternal age, abnormal maternal serum screen, abnormal ultrasound findings, or a family history of birth defects. (http://www.wardelab.com/10-3.html Article: “Clinical Genetic Testing”) An example of the current state of the art in cytogenic testing is as follows. A geneticist will do lab work to move human chromosomes into the metaphase. Once in the metaphase chromosomes can be viewed and photographed under a microscope. While a specimen is under the microscope in the metaphase the geneticist will then count the chromosomes. An extra autosomal chromosome is known as trisomy. If this extra chromosome is chromosome 21, it is down syndrome. This process continues. In order to make sure that there was no human error a second person will count the chromosomes. As part of this, the microscopic slides are photographed for records, and other human reviews. The manual task of counting chromosomes under a microscope is a time consuming and delicate process that could be flawed by human error.
The CSC Entrepreneur Team will write an application that identifies and counts chromosomes from the slide photos, and give the proper diagnosis of the defect, if one exists. This application will be marketed to hospitals and clinics that do their own lab work as well as companies like LabCorp who are the outsources for hospitals and clinics.
Is this market big enough to be worth it?
Up to 75 percent of first trimester miscarriages are caused by chromosomal abnormalities in the embryo. (http://www.easternbiotech.com/Resource-Cytogenetic%20Tests.php )
How many is that 75 percent?
In the US, 900 thousand of 4 million pregnancies end in miscarriages.(http://www.hopexchange.com/Statistics.htm )
75% of 900 thousand is 675 thousand. 675 thousand per year.
According to Warde Clinical Laboratory, cytogenetic testing has become the standard of care for many pregnancies. Prenatal cytogenetic analysis has become the standard of care for those patients at increased risk because of advanced maternal age, abnormal maternal serum screen, abnormal ultrasound findings, or a family history of birth defects. (http://www.wardelab.com/10-3.html)
This is how the application will execute:
The program will be very similar to a standard desktop application. It will have a standard file open option where you can browse files and folders to find the images. Once the image is open you will be able to view the original image/slide just as the original photo was taken (see Illustration 1, below). Then you click a button to analyze the slide. Once analysis is complete (computer vision algorithms to determine chromosomes, count, and diagnose), the chromosomes will then be displayed in karyotype. Karyotype -To classify and array the chromosome complement of an organism or a species according to the arrangement, number, size, shape, or other characteristics of the chromosomes (http://medical-dictionary.thefreedictionary.com/Karotype).
This is a standard organization used by medical personnel for quick detection of abnormalities (see Illustration 2, below). The application will highlight any abnormalities found in the karyotype image. It will also give the diagnosis for any abnormalities. The application will also save a new file with all the results of the analysis.
An existing set of tools for computer vision provide a starting point for this research. Slides will be provided. Consultation with experts in genetics will be arranged.
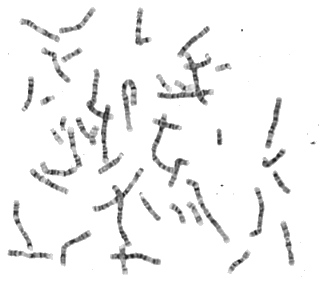
Illustration 1: Photo of Chromosome
Illustration 2: Same chromosomes arranged in karyotype
Log Analyzer
Fidelity Investments has many groups (development and QA) supporting their application environments. Each group at some point needs to analyze the log files to troubleshoot an issue. This is generally done by opening the log file in a text editor and then searching for a given string. There are also times when a group could be supporting multiple application servers where each server will have its own log file. The process then is repeated on each log file to determine which server had an issue and what caused it.
Students undertaking this project will have to develop a desktop application to read these log files and search for patterns in them and display relevant information to the users. The application will go through multiple log files if needed and get the consolidated list to the user.
The application will
- Allow the user to configure string patterns to search for
- Configure location to read the log file from
- Read the log from windows event logger if needed
- Allow user to configure user id and passwords for Linux/windows server and then use that for reading the log file from configured location
- Perform sort and filter on the displayed data
Code Generation Tool
Project
Fujitsu America is one of the top three suppliers of retail systems and services worldwide. Its integration of Microsoft DNA" (Distributed InterNet Architecture) creates a high performance yet open platform that retailers as diverse as Nordstroms and Payless Shoe Source are able to customize.
Customizing these systems requires considerable sophistication in using Microsoft Visual Studio and in integrating client-specific logic with Fujitsu America’s retail system framework. The NCSU team will streamline this process by creating a Visual Studio 2012 extension that will automatically generate code to support this customization. The generated files will then automatically be added to the current project. The Visual 2012 extension will be used by our development team for code generation for our next generation release.
The following link will help the team get started in developing custom tools in Visual Studio 2012:
http://msdn.microsoft.com/en-us/library/bb166508(v=vs.110).
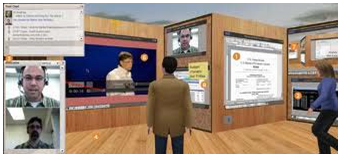
Virtual Obeya Room
Background for Project
Many attempts have been made to present Project Portals, Dashboards, and other ways of communicating large amounts of project-related data in an instructive and intuitive way online. What is difficult is that these flat screens make it difficult to easily collaborate or browse back-and-forth through the information.
Obeya in Japanese means simply “big room.” At Toyota it has become a major project management tool, used especially in product development, to enhance effective and timely communication. Similar in concept to traditional “war rooms,” an Obeya will contain highly visual charts and graphs depicting program timing, milestones and progress to date and countermeasures to existing timing or technical problems. Project leaders will have desks in the Obeya as will others at appropriate points in the program timing. The purpose is to ensure project success and shorten the plan-do-check-act cycle. Definition credited to the Lean Enterprise Institute.
In the physical world, using a large wall or “Obeya Room” to post charts, project plans, and stakeholder feedback is common in those companies practicing Lean Manufacturing and Lean Product Development. What is difficult is that these physical locations are impossible to use for geographically dispersed teams.
What is needed is a way to bridge the virtual and physical concepts into a single 3D environment that makes it easier for project teams to collaborate on Product Design Reviews and Project Development issues yet not co-locate.
Project Description
- Use the OpenQwaq open-source software to provide a foundation for the 3D collaborative environment
- Use PTC’s CreoView Toolkit to integrate a 3D CAD viewer into the OpenQwaq environment
- Incorporate walls that display various webpages. These webpages would be interactive interfaces from various web-based applications.
Project Requirements
- Student team is permitted to work at I-Cubed’s facility at 920 Main Campus Drive Suite 400, Raleigh, NC. 27606.
- Students may acquire OpenQwaq online.
- PTC’s CreoView Toolkit is available for the purposes of preparing this technology demonstration from I-Cubed.
- The Virtual Obeya Room should create a secure but also engaging user experience.
Delivery
This project should be created with a reusable framework that is quickly implementable when a new project undergoes delivery. Significant attention should be focused on user experience to improve the adoption and usability of the technology.
Sponsor Background
Since 1984, I-Cubed has provided the people, products and processes to extend the value of customer’s enterprise systems. The company's subject matter expertise in Enterprise Applications, Product Lifecycle Management Consulting, Business Process Consulting and Rights Management provides a unique insight that translates customer needs into commercial products. I-Cubed's product and services portfolio helps customers accelerate the integration of enterprise systems and collaborate securely throughout the supply chain. I-Cubed has been sponsoring senior design projects for more than 10 years. I-Cubed’s office is conveniently located on NC State’s Centennial Campus in Venture II.
Health PAC Student Portfolio Redesign/Reprogramming
The Health Professions Advising Center (Health PAC) is dedicated to mentoring students and helping them reach their health care career goals. Health PAC is available to all current undergraduate and graduate students, alumni, as well as students returning to obtain admission credits through postgraduate studies. Health PAC includes a complete advising center, an extensive mentoring website and personalized health career planning with Anita P. Flick, MD.
One of the most critical components of this advising program is the web-based Student Portfolio System which has been developed over the past 4 years by CSC and CALS work study students and staff. The current system allows pre-professional health students to track their academic, clinical, service and social accomplishments during their career at NCSU plus compile letters of recommendation and prepare their files for their application to graduate school. They are also able to share their portfolio information with graduate programs, advisers and employers. At the time of their application, the system is equipped to allow our university Health Professions Review Committee to evaluate and compile what is called a University Committee Letter that is submitted to their graduate programs which has been shown to greatly enhance their acceptance rates. Since implementing this system at NCSU, along with the other components of our 5 Points of Success Program, we have seen our acceptance rates more than double!
(see http://harvest.cals.ncsu.edu/site/WebFile/5%20points%20of%20success.pdf)
The current system allows students to create a portfolio which not only captures basic biographical data but also career interests, majors, GPA, etc. In addition students can track and upload key information for their future applications including transcripts, essays, testing data and most importantly, their accomplishments and applicant strengths; all which may eventually be used as part of their graduate school applications. The components above are also used currently by the advising center, academic advisers as well as employers for a very user-friendly snapshot of a student’s current strengths and preparedness. The system also allows students to electronically request letters of recommendation which can be incorporated into the committee letter mentioned previously.
The reason for a re-design is that, although the Student Portfolio System is in a working state and very beneficial for students, a recent review of the system highlighted key concerns which negatively impact prospects for future addition of important features. These concerns also include a need for better documentation and maintenance standards, creating clearly defined test plans for portfolio functions and improving search and validation features. Below are key points of concern.
- The current source code is written in ColdFusion. For the longevity of the portfolio system, we would like to consider utilization of an open source programming language Due to internal interest as well as that from outside the university for customizable portfolio features, decisions relating to programming language and features should include consideration of those most readily available and utilized by consumers.
- The redesign should accommodate a variety of academic programs. Consideration should be given to marketing this product to other universities under a fee for service model or as a software product for sale and distribution. The new Health PAC system should be available for use by NCSU Pre-Healthcare Professional students and able to be tailored for other pre-professional areas such as law, vet medicine, plus masters and PhD applicants. We have had requests from at least 8 major colleges and universities to access our portfolio system and programming for their own students.
The goal of this senior design project team is to review the current student interface of the portfolio system and utilize this platform in the redesign, incorporating current features and desired enhancements. It should be noted that the team is NOT expected to duplicate the entire existing system but to focus on the student components of the system with an emphasis on quality. It is hoped that the redeveloped student components created by a Fall 2012 senior design team will provide Health PAC with a solid foundation on which portfolio system revisions and the subsequent redesign of the administrative side of our portfolio system can be completed.
Performance Prediction Tool for a Flash-Based Cache
Create a performance prediction tool which will predict the performance of an application given the following inputs:
- Workload characterization (read/write mix, size of reads/writes, sequential, random, etc)
- SSD performance (the team will need to measure the latency and IOPs of various devices - we can recommend 5-10 different devices)
- Flash caching performance: we can provide some performance results
Specific benefits that the result of the project may provide (to NetApp, storage technology, or other benefits): This could be the start of tech team tool that could be used to help account teams and partners predict the performance of the cache.
Resources that the team will / may need:
- SSD devices and the ability to measure performance
- Workload simulation tools
- Server/storage environments to measure/validate their predicted performance
Web KPIs (Key Performance Indicators)
Metrics are an important part of running an organization. Prometheus Group offers a solution to view KPIs from within the SAP environment. The issue is that many of the higher level individuals in an organization do not even log into the SAP GUI. They want a quick and easy way to view their metrics from outside the normal SAP GUI. A previous senior design team has created an application to recreate the KPI view from outside of SAP, through a web browser. Our goal is to take that work and bring it back inside SAP so that the experience is smooth across web browsers on desktops, mobile devices and the SAP GUI itself. This will allow our customers to have a quick-access view of any of their company’s metrics regardless of their point of entry.
On this project you will learn:
- Web Technologies
- HTML/CSS
- JS
- JSP
- Service Technologies
- SOAP
- REST
- Proprietary Technologies
- SAP
- ABAP
The most interesting part of this project will be the team’s collective learning of SAP and ABAP. ABAP is a proprietary language used to run the SAP environment, a runtime that millions of business users in all kinds of industries use.
Mobile Work Order Execution
Craft personnel require the ability view and process a list of jobs on a portable device. Today, they are given paper copies of jobs and are dispatched to the field to complete the work. When the work is completed, the system is then manually updated, in a clerk-like style, based on the paper copy. The goal of this project will be to automate this manual, paper-driven process and give the users an easy interface to input hours worked and any issues reported throughout the day.
Specifically, a mobile application will be built that will replace the paper world of today’s industry. This mobile application will be responsible for providing all of the same responsibility that the paper time tickets, parts lists, etc. are that are manually printed. The application should be able to perform the following functions:
- View the user’s assigned work for the day; this includes: equipment number, order description, estimated man-hours to perform the work and any related documents assigned to the order
- Easily create work orders in the field
- Capture the time spent executing work against the assigned work orders
- Answer surveys from the field on topics such as job safety and other regulation-based questions.
On this project you will learn:
- Mobile Technologies
- C#
- Service Technologies
- SOAP
- REST
- Proprietary Technologies
- SAP
- ABAP
HTML5 Component Development
The goal of this project is to design and implement a dual selector component using Dojo technology. A Dual Selector allows users to compile a list of items by copying them from one list to another. The list of items that is created is intended to be used in another part of the application. Items that are put into the created list are not permanently moved from their original location, but copies of them are created for the new list.
The scope of the project will include implementation of the following variations of a dual selector:
- List to list
- Grid to grid
- Tree to tree
Diagram 1: Screen shot of simple list to list dual selector.
The architecture of the composite needs to be such that we could basically substitute any component into either the right or left side of the dual selector. For example, other variations could include:
- List to grid
- Grid to list
- Tree to list
Diagram 2: Screen shot of tree to list dual selector.
So proper design, code separation and reuse where appropriate is key in developing a component that will be easy to maintain and enhance moving forward.
Baseline functionality across all:
- Double-click selection and de-selection
- Removing unavailable selections or greying of unavailable selections, based on consumer-set option
- Greying of unavailable move buttons for the given selection
- Alternating selection arrows
- Option for horizontal or vertical orientation
- Highlight behavior
- Primary highlight remains in current container and moves to the next item
- When the target type is list or grid, the target component is a CedarList or CedarGrid, instead of List or DataGrid, so that the consumer can access the functionality and customizations of CedarGrid
- Component needs to support full keyboard accessibility
- Localization should also be considered during the implementation
Full functional specs will be provided at the start of the project. Those specs will be based on our current Flex implementation of these components.
At the completion of the project, we’d expect to have
- Implementation of the above components
- Full documentation of the APIs
- Complete set of unit tests (tool to be decided)
- Set of automated tests using Selenium
Design Verification Automation Tool (DVAT) Usability Enhancement
Background
Tekelec is a Morrisville-based company focused on delivering quality hardware and software solutions to a variety of global customers. Many of Tekelec's software products are built on a platform stack consisting of a customized Linux OS, a proprietary database system and several GUI interfaces. As the core of so many products, this software stack is held to the highest standards of quality and is subject to rigorous testing procedures.
Tekelec’s Design Verification group is responsible for this testing, and has developed the Design Verification Automation Tool (DVAT) to assist with the verification process. The DVAT executes automated test plans, collects pass/fail results, and reports these results back to the user. Previous senior design efforts with NCSU students have positively impacted the DVAT. These efforts resulted in two prototype features and one feature that was integrated into the production DVAT. This semester, Tekelec would like to further build on this success and focus on enhancing the DVAT’s usability.
Problem
Testers who use the DVAT initiate automatic tests, interact with manual tests, and lock/unlock test servers. It can be cumbersome for a tester to know which of their tests are completed, which are in progress, which have failed, and which are blocked waiting for manual input. It is also not obvious to the tester which test resources they currently have locked. It would be beneficial to provide information specific to the user to them in a convenient way.
Project
Tekelec’s Fall 2012 senior design group will:
- Gather requirements for resolving the above problem
- Propose a mockup solution
- Provide a high level design
- Implement the design
Implementation
The team will participate in the Tekelec's document and code review processes for all deliverables. Implementation technologies include PHP, Zend, Ext JS, and Doctrine on a Fedora platform.
Real-Time Location-Based Offers
Project Overview
The goal of the project is to integrate the Aprimo Real-time Interaction Manager (ARTIM) and Foursquare. ARTIM is a real-time offer extension product that leverages machine learning and rules to provide offers to channels such as websites and inbound call centers via web services. Foursquare provides a location-based information service. This integration will offer capabilities for providing ARTIM offers to customers based on their Foursquare location. For example, a user that checks into a venue on Foursquare, will receive an offer based upon the user’s location and ARTIM rules and machine learning.
Project Organization
The project will be run within the Agile Scrum framework. Agile development provides the benefits of early and consistent customer engagement. The Teradata representative will serve as the Product Owner for the Scrum team in order to provide application requirements and to assist with backlog grooming and acceptance criteria. Development will occur in two week Sprints. Planning for tasks will occur at the beginning of the Sprint, checkpoints and backlog grooming will be scheduled mid-Sprint and demonstrations of progress will happen at the end of each Sprint in a Sprint review.
Company Background
Teradata is the world's largest company focused on integrated data warehousing, big data analytics and business applications. Our powerful solutions portfolio and database are the foundation on which we’ve built our leadership position in business intelligence and are designed to address any business or technology need for companies of all sizes.
Only Teradata gives you the ability to integrate your organization’s data, optimize your business processes, and accelerate new insights like never before. The power unleashed from your data brings confidence to your organization and inspires leaders to think boldly and act decisively for competitive advantage. Learn more at teradata.com.
A Unity3D-Based Gameplay Logging and Replay Facility for the Automatic Generation of Highlight Reels
Summary. Afterthought is a system that automatically logs gameplay inside first-person shooter games. Afterthought identifies interesting narrative patterns of play from game logs and generates highlight reels of the game play (using the same game engine) for review by players and spectators. Afterthought was built as an MS thesis project using the Unreal Development Kit (UDK), which is a system that is difficult to extend and for which limited programming expertise exists. The proposed project would port the Afterthought system from UDK to the Unity 3D game engine. Unity 3D is both more accessible and has a larger community of developers, allowing our research team to more readily integrate research projects built with it. The proposed work would enable a range of extensions to Afterthought, including the development of real-time game log analytics, intelligent camera control methods and the integration of editing techniques to facilitate storytelling in highlight reels.

Figure 1. Screen shots of highlight reel contents automatically selected and generated by Afterthought.
Scope of Work. The project will involve students collaborating with the Afterthought PI (Young) and 2 graduate students also working on intelligent camera control methods. The implementation would use C#, a language that many CSC undergraduates are familiar with, and be built on top of the Unity3D game engine, a tool that is also used in many of the games-specific courses in CSC. The research team of developers will be available to help the Senior Design team while they are learning the tools and environment.
The project might be readily divided into three elements matching well with a 3 or 4-person team. First, the project requires work to design, create and test a generic logging and replay facility within Unity 3D. Second, the project requires the re-implementation of Afterthought’s finite state machine recognizers that track log updates and recognize narrative patters. Finally, the system requires the implementation of camera controllers for a small range of shot types (e.g., close-up, apex, over-the-shoulder) that would display action during the replay of the selected highlight activity.
At project initiation, the Senior Design team would work with the Afterthought team to develop project requirements and be responsible for understanding the existing code base and its design. Completion of the project would include a documented toolkit that could be applied across many games built using Unity and the Afterthought API.
Student Activity Visualization
Business Need
WebAssign is interested in creating one or more web-based, animated visualizations that allow viewers to get a feel for current activity in the WebAssign application. The primary purpose is to create a sense of energy and movement within viewers, linked to the intellectual activity happening because of, and within, WebAssign.
Target Audience
There are three target audiences for the visualizations.
- WebAssign employees, both current and potential.
- Faculty and student users, both current and potential.
- Publishing and technology partners, both current and potential.
Constraints
There are a number of constraints surrounding the visualization application.
- It must be designed to be displayed on 60” LCS TVs with resolution of 1920 x 1080.
- The majority of the content must be visible at a range of 3 to 15 feet away.
- The viewers will not be able to interact with the visualizations using either keyboard or mouse.
- Build a rich web application, using Ruby on Rails (recommended, or Perl alternatively), HTML5, Javascript and CSS3.
- If you make a real-time visualization, consider ways to process or filter the data efficiently.
- We are an Agile development shop and approach solving all our problems using Agile roles, artifacts and ceremonies.
Your Task
We have presented a business need, given you a high-level understanding of the types of users we want this application to target, and expressed a handful of constraints for how you approach your solution.
Your task, now, is to add definition to the problem, design a solution and build it.
Given that WebAssign follows Agile development methodologies, you will want to understand Agile roles (Product Owner, Scrum Master, and “The Team”), common artifacts (like user stories, product and sprint backlogs, and burndown charts), and ceremonies (sprint planning, sprint reviews, and sprint retrospectives).
Skills
The team should ensure their skillsets cover the following technologies and tools.
Languages
- Ruby on Rails (Recommended) or Perl
- HTML5
- SS3
- Javascript (including jQuery)
Data Storage
- MySQL
- NoSQL (recommended)
Other
- Passing Linux/Unix/FreeBSD experience (recommended)
- Visual design and animation
- Requirements definition and documentation
- Presentation
- Agile methodologies (recommended)
Inspiration
Take a look at the following links that give examples of visualization. Use them as inspiration. But don’t forget to add your own creativity.
- AgentC: Geo-visualization of Martime Piracy Date (http://www.youtube.com/watch?v=S0XlErf1nXc)
- Flickr Geo Visualization - Bueno Aires (http://www.youtube.com/watch?v=dIvbgg14WDw)
- Japan Earthquakes 2011 Visualization Map (http://www.youtube.com/watch?v=NSBjEvPH2j4)
- glTrail - real time Diggs (http://www.youtube.com/watch?v=_qLL-UqoHiI)
PAS-X Equipment State Diagram Manager
Problem Definition
Werum provides a software product called PAS-X which tracks and manages the pharmaceutical production process. In PAS-X, equipment (containers, scales, etc.) statuses are modeled as states in a state machine. Each piece of equipment has a current state and a set of possible actions to reach other states. Currently in PAS-X state diagrams are constructed and displayed as lists of transitions between states. For large diagrams that may have many states and transitions, this is very hard to visualize for the end user. Additionally, there is no way to test the flow of a given diagram without actually performing work on a piece of equipment in the system.
A typical state machine would like this:
Proposed Solution
To allow for better planning and comprehension in the management of the various equipment items, it would be beneficial to have an application which will display state diagrams in a graphical form with multiple states and their related interconnections.
Base Requirements:
- Provide a graphical representation of a given state machine with states and connections displayed.
- Provide the ability to create or edit existing state machines by dragging and dropping states and connections.
- Retrieve and save state diagrams to database and file.
- Provide a mechanism to simulate the movement through the states in the diagram.
- When provided with an equipment ID, display the state diagram for the object and the current and past (based on the equipment log) and potential future transitions.
- Simulate the execution of a state machine by reading a list of activities (transition events) from an external test file; supported events must include timer expirations;
- Check the integrity of a state diagram to ensure it meets a set of defined criteria.
Sample Use Scenario
The user will create a new empty state diagram. From a toolbox the user will select and insert a new state into a graphical diagram. The state will be provided with a name “
Technical Details
PAS-X is composed of multiple modules which are developed on different platforms and integrated into a single product. Primary required skills for this project will be familiarity with Java. Experience with SQL relational DBs is preferable. To provide the graphical view of the states, some experience with user interfaces or computer graphics is beneficial.
Implementation
The solution should provide a Java based implementation. The solution should also be presented in a web based manner. This may be as a Java Applet or JSP web application. The application must interface with an Oracle database backend. The implementation must prioritize using standard Java libraries and web standards. Any external libraries or sources included must support licensing for private distribution and sale. The graphical view should not require any special hardware or libraries for hardware acceleration (OpenGL, Direct X). A set of basic function calls for connecting to and retrieving and saving data will be provided but may require extension or updates depending on the implementation.
Project Archives
| 2026 | Spring | Fall | |
| 2025 | Spring | Fall | |
| 2024 | Spring | Fall | |
| 2023 | Spring | Fall | |
| 2022 | Spring | Fall | |
| 2021 | Spring | Fall | |
| 2020 | Spring | Fall | |
| 2019 | Spring | Fall | |
| 2018 | Spring | Fall | |
| 2017 | Spring | Fall | |
| 2016 | Spring | Fall | |
| 2015 | Spring | Fall | |
| 2014 | Spring | Fall | |
| 2013 | Spring | Fall | |
| 2012 | Spring | Fall | |
| 2011 | Spring | Fall | |
| 2010 | Spring | Fall | |
| 2009 | Spring | Fall | |
| 2008 | Spring | Fall | |
| 2007 | Spring | Fall | Summer |
| 2006 | Spring | Fall | |
| 2005 | Spring | Fall | |
| 2004 | Spring | Fall | Summer |
| 2003 | Spring | Fall | |
| 2002 | Spring | Fall | |
| 2001 | Spring | Fall |