Projects – Fall 2022
Click on a project to read its description.
Sponsor Background
The Canine Instruction with Instrumented Gadgets Administering Rewards (CIIGAR) Lab at NCSU is among the world-leaders in Animal-Computer Interaction and Animal-Centered Computing research. Either directly or through a network of collaborations, the lab develops hardware and software that facilitates nonhuman animals interacting with, and via, computing systems. The Lab is among the top contributors to the annual Animal Computer Interaction conference, has 3-5 PhD students, and several undergraduate researchers during any given semester. Dr. David Roberts directs the lab.
Background and Problem Statement
Among the many challenges in facilitating nonhuman animal use of computing systems is the design of Animal Interface Devices (AID). AID, the equivalent of the keyboard, mouse, and screen for human computer users, are currently being investigated in many forms, including accelerometers, buttons, touch devices, strain gauges, and camera-based systems. The latter, camera-based systems, have notable advantages in terms of ergonomics and comfort for animals, but generally require advanced knowledge and implementation of computer vision techniques in order to convert raw pixels into meaningful interaction data. Many behavior and welfare researchers and practitioners deploy cameras in their work, but this advanced knowledge of computer vision is seldom available to those with interest in, or knowledge of, nonhuman animal behavior and welfare, creating a “have data, need help” scenario.
Project Description
The goals for this project are to create a self-service web portal that will enable behavior and welfare researchers and practitioners to upload or link to camera data (videos, archives/directories of images, etc.), re-train existing computer vision models, run inference using those models, and receive results. The system must allow:
- Users to create and modify projects , each defining a computer vision pipeline comprising data, models, and code.
- Storage of raw, processed, and inference data associated with a project.
- Tracking of model provenance (including specific training data, hyperparameters, and performance data).
- Facilitate the execution of data preprocessing, model training, and inference using simple, non-technical controls.
- Storing, viewing, and visualizing results of training and inference.
Stretch goals include:
- A visual, drag-and-drop interface for specifying data, models, and computational tasks.
- Integration with external storage APIs
- Support for multiple users and shared projects.
To demonstrate these features, two existing computer vision pipelines and data sets will be provided: 1) measuring dogs’ tail positions in 3D, and 2) automatically counting parasite species and load for poultry.
Technologies and Other Constraints
The solution must be web-based, support execution of Python code on GPUs, and be containerized.
Sponsor Background
Department Mission:
The North Carolina Department of Natural and Cultural Resources (DNCR) oversees the state’s resources for the arts, history, libraries, and nature. Our mission is to improve quality of life by creating opportunities to experience excellence in these areas throughout North Carolina.
Division Mission:
The North Carolina Division of Parks and Recreation (DPR) administers a diverse system of state parks, natural areas, trails, lakes, natural and scenic rivers, and recreation areas. The division also supports and assists other recreation providers by administering grant programs for park and trail projects, and by offering technical advice for park and trail planning and development.
DPR exists to inspire all our citizens and visitors through conservation, recreation, and education.
- Conservation: To conserve and protect representative examples of North Carolina's natural beauty, ecological features, recreational and cultural resources within the state parks system.
- Recreation: To provide and promote safe, healthy and enjoyable outdoor recreational opportunities throughout the state.
- Education: To provide educational opportunities that promote stewardship of the state's natural and cultural heritage.
Data & Application Management Program
We support the Division, sister agencies, and nonprofits in web-based applications for various needs: personnel activity, Divisional financial transactions, field staff operations, facilities/equipment/land assets, planning/development/construction project management, incidents, natural resources, etc. Using data from these web apps, we assist program managers with reporting and analytic needs.
We have sponsored a previous SDC project, so we understand the process and how best to help you complete this project in an efficient manner while learning about real world software application development. Our team includes two NCSU graduates that worked on our last project; these two will be spearheading the project and working directly to fulfill your needs and make the process smooth.
Background and Problem Statement
The existing LAMP stack system was developed over the course of 25 years, with ad-hoc application development in a production-only environment (mainly using PHP and MariaDB) to meet immediate business operational needs of the field staff.
Legacy system applications and applications upgraded in the previous Senior Design project are containerized using Docker, and they run in parallel in the AWS cloud. Many of the legacy applications, including the three which handle document finding -- FIND, eFile, and Policies-Staff Directives/Guidelines -- were written as single file, procedural applications. This makes it difficult to read, maintain, and upgrade them. They also lack functional search features, so it is difficult to find relevant files without prior knowledge. These applications need to be updated with modern design patterns and documentation.
Project Description
The FIND, eFile, and Policies-Staff Directives/Guidelines applications need to be unified, containerized, and upgraded to a more sustainable, future proof architecture, based on industry standards, methods, and best practices. These applications need redesigning to maintain consistency with apps upgraded in previous semesters (dprCal) so that users can enjoy a functional, user-friendly experience. Such system improvements will allow park staff to be more available to serve the public in their mission of conservation, recreation, and education needs by keeping files of forms, documents, and policies easily accessible and universally updated (currently, multiple versions of a file may be in use as a result of sending through email or printouts).
At a minimum, the 3 applications would need to be unified, containerized, and updated to run on PHP 8 and MariaDB 10. The applications should be redesigned and rewritten as necessary to follow modern design and best practices. The new application should allow for adding and indexing of files and documents. The new application should also have intelligent searching to match files based on multiple parameters like titles, contents, category, park code, or dates and rank them by best fit in a "google-like" search of the files in the database. A stretch goal is to implement document previews to allow for rapid searching and viewing.
These needs have outgrown our current setup and have given us a glimpse into the pace of future needs. We are in the process of implementing a new system that allows for continued use of the legacy system and establishment of a next generation system. The legacy system will be modified to be migrated to the next generation system for continued use, until all applications can be reworked and migrated appropriately to be integrated into the next generation system. The new application will be able to be integrated into our next-gen system using Docker Compose.
Technologies and Other Constraints
Tools and assets are limited to what has been approved by the NC Division of Information Technology (NC-DIT). Most of the ‘usable’ constraints will be what is limited to NC-DPRs use through NC-DIT.
- Container Orchestration
- Docker – Suggested for personal/team local use
- GIT – required
- PHP 5 & 8 – required; PHP 5 legacy system; PHP 8 updated apps
- Slim - PHP framework, required
- React - Frontend JS library, required
- MaterialUI - React component library, encouraged
- MariaDB 10 – required; uses InnoDB engine.
- SFTP/FTP – required; implementation method flexible; This is used to acquire and read data from other agencies and their vendor systems into the next generation systems databases. System would acquire file transfers from vendors/other agency sources for depositing, and we would read the data into our database
Students will be required to sign an NDA related to personal and private information stored in the database and to sign over IP to sponsors when the team is formed
Sponsor Background
The Senior Design Center of the Computer Science Department at NC State oversees CSC492—the Senior Design capstone course of the CSC undergraduate program at NC State. Senior Design is offered every semester with current enrollment approaching 200 students across several sections. Each section hosts a series of industry-sponsored projects, which are supervised by a faculty Technical Advisor. All sections, and their teams, are also overseen by the Director of the Center.
Background and Problem Statement
Senior Design is very much a calendar-driven course. A large part of preparing for a semester involves the creation of a Word document (class calendar) per section that identifies dates and details of class sessions, lectures, meetings, assignment due dates, talks, and more. Some of these activities are shared across all sections, while others are specific to each section.
Currently, these Word calendars are created by hand. Although this is done meticulously, there are occasional discrepancies that must be manually corrected. This is also a tedious process as some changes required between sections are subtle (class meeting times and dates, holidays), and changes to common events need to be manually edited in each individual section calendar document.
In addition to these Word calendars, Senior Design also uses Google Calendar to keep track of these activities. There is one Google Calendar per section plus another for events shared across sections. As populating these Word calendars is a manual process, so is populating these Google Calendars.
Project Description
For this project, your team will build a Web application that will facilitate the creation of Senior Design section calendars. The Web interface shall allow the user to specify the number of sections and section constraints, such as class meeting days and times, common class meeting times, and rooms. The user can also specify holidays or other dates where no activities are allowed to be scheduled (e.g., fall or spring breaks). With these constraints in place, the system can then allow the user to create events and activities either for individual sections or to be shared across sections.
The system is expected to persist this data so that it can be edited later if needed. The system shall also allow exporting section calendars (all at once or just some sections) in Word, PDF, or CSV formats.
Finally, but importantly, this system should leverage the Google Calendar API to automatically:
- Create Google Calendar events in the appropriate calendar (section or common).
- Update the corresponding Google Calendar event when the event is modified in the system.
- Update the corresponding event in the system when it is modified in the Google Calendar. This can be done by leveraging the Google Calendar Push Notification API.
If time permits, stretch goals include the capacity for a user to "clone" a previous semester, effectively duplicating the structure of the original semester but shifting events in time.
Technologies and Other Constraints
The backend will be written in PHP 8 and use the Slim Framework to expose a REST API. The frontend will be written in React. We will provide an initial MySQL/MariaDB schema that students will have to extend as needed to accommodate the requested features.
Although not strictly required, we suggest the use of Docker containers.
Sponsor Background
The NC State College of Veterinary Medicine is where compassion meets science. Its mission is to advance the veterinary profession and animal health through ongoing discovery and medical innovation; provide animals and their owners with extraordinary, compassionate medical care; and prepare the next generation of veterinarians and veterinary research scientists. With world-leading faculty and clinicians at the forefront of interdisciplinary biomedical innovation, conducting solution-driven research that defines the interconnections between animal and human health, the CVM is a national leader in veterinary research and education.
Background and Problem Statement
Medical best practices for diagnostics in many species (both human and nonhuman animals alike) involves the use of diagnostic blood work to help pinpoint which body systems are functioning properly or not. Laboratory testing of blood samples yields precise values of physiological systems and their functions across a range of measurements, which—for many species—are well documented and understood. At the push of a button lab technicians can generate a report that contains the values for the sample tested as well as a comparison to reference ranges for healthy individuals of the same species. As commonplace as this is for animals like dogs, cats, or horses, no such system is available for poultry (chicken, duck, turkey, etc.). The system currently used involves researchers entering results in a local database and calculating their own ranges, with no compilation of data from multiple farms or projects. At NCSU-CVM, all the test results from poultry blood are entered into an Access database hosted on a faculty members computer, queries are run to export results into MS Excel, and then an Excel add-on comprising macros to compute reference ranges is run to generate a report. The process is labor intensive, ripe for human error, and limits usability of the data due to lack of web-access.
In a prior semester, a Senior Design team developed a React application and Flask backend to facilitate scalable, organization-wide handling of bloodwork reporting and reference calculations. The application is containerized (Docker), with an nginx reverse proxy. The application supported multiple user roles, and workflows for individuals to enter bloodwork data; however, the application is not feature complete, and workflows for managers and organizational leaders are not yet implemented.
Project Description
The main goal for this semester will be to complete implementation of the application, design new ease-of-use functionalities, and make the system ready for deployment. The existing web-based application allows researchers, practitioners, and owners to submit bloodwork results manually or document upload, such as txt or CSV (with appropriate access controls/anonymization). New functionality to review data and calculate normal ranges for the species and age group, and the ability to compare the data entered for an individual with expected value ranges will be the focus of this semester. In addition, the ability to automate data entry using OCR from pdfs, text files, and smartphone pictures is a critical missing feature. Students working on this project will be given an existing Access database, the existing Excel macros, and the existing React/Flask framework started by the previous Senior Design team. They will work closely with Drs. Crespo and Roberts to design, implement, and test the remaining functions of the system to facilitate collecting bloodwork results, calculating reference values, limiting views of data based on access controls, and generating professional pdf reports (using a sample provided) that can be shared back with owners and practitioners. The figure below illustrates the incomplete features (highlighted in red).
Technologies and Other Constraints
Students will leverage the existing React/SQL implementation. The application runs in three Docker containers, with a fourth handling reverse proxy duties (NGINX). The backend REST API is handled via Flask and SQLAlchemy + Pydantic, with MySQL/MariaDB (sqlite currently) for the database.
Students will be required to sign over IP to sponsors when the team is formed
Sponsor Background
Katabasis is a non-profit organization that specializes in developing educational software for children ages 8-15. Our mission is to facilitate learning, inspire curiosity, and catalyze growth in every member of our community by building a digital learning ecosystem that adapts to the individual, fosters collaboration, and cultivates a mindset of growth and reflection.
Background and Problem Statement
Katabasis works to serve children in underprivileged communities across eastern NC. One of the central ways we do this is by designing games which can expose children to educational concepts such as computer science, sustainable agriculture, and epidemiology & virus transmission. As we continue to develop more of these games, however, we are finding it increasingly difficult to extract meaningful insights from players' experiences, including their degree of retention with subject matter, difficulty engaging with the UI/UX elements, proficiency with the mechanics, etc. We are looking for a way to be able to track these metrics, and for such a system to be standardizable and applicable to all our games, present and future.
Project Description
Katabasis is seeking to develop a web-based platform that can interface with our existing Unity games and can provide a library for development of future Unity games, to track user data and present it in a functional way on the web interface. The project consists of two major components; a logging client that will be embedded into the Unity game(s), and the logging web service that will receive data from the client, operate on it, and display it.
Logging Client (Unity/C#) Components:
- Logging Library: The team will have to design a library that logs user activity and various elements of a game state. The specific metrics to be recorded are talked about more below. Additionally this library must also be able to communicate with the web-based logging service and transmit the data it collects.
- New Game Proof of Concept: In order to verify the functionality of the logging system, the team will create a very basic Unity project to demonstrate all relevant metrics, and the process for starting a new game with the library.
- Existing Game Integration: The team will be provided with the codebases for two of our existing games and be tasked with integrating the library into them, as well as demonstrating the process for this integration.
- Data Point Selection: Katabasis has a base set of metrics we are seeking to track with this software (that will be provided), but we are eager for the team to not only offer their opinions and insight, but to discover and refine the ideal metrics for the project 's goals as user testing develops (see below)
Logging Service (Web) Components:
- Web Platform: An interface that will allow us to view the data collected from the games, and filter with a variety of different criteria such as date of collection, data-specific filters (highest or lowest of a given metric), and more. This will require a basic frontend component to display and interact with the data(more details below), and a backend component, likely an API, which the library component (that is part of the Unity game) will interface with to transmit data logged from gameplay sessions.
- Visualization: While having access to raw data is useful, providing some visual aids in interpreting the data can greatly improve its readability and utility. Katabasis will provide some basic graphics libraries and tools to use, with the team free to expand as they identify the project 's more specific needs.
Universal Components:
- User Testing: In order to ensure the logging is working correctly, the team will be conducting periodic user testing sessions. These will not only test the technical functionality of the system, but the relevance of the data as well. We want the team to design surveys to present to testers to measure certain data points explicitly and see how this data compares to the implicit data gathered from the logging system, to improve and refine the data and feedback process.
- Data Privacy Compliance: Data privacy laws must be respected at all times and can be a tricky thing to manage at times. Thankfully, the GDPR (https://gdpr-info.eu/) provides clear guidelines to be followed that mostly consist of ensuring all users are able to opt-out of data collection. There are some other considerations relating to data anonymization and types of data that may also be relevant. The team will be encouraged to do their own research to familiarize themselves with these restrictions and incorporate them into their development (Katabasis will be happy to provide any clarifications or support if needed).
- Data Tagging: The data gathered from the logging client should be properly tagged, to make it easier to handle once passed over the the web component. This will likely include name of game, user data (compliant with data privacy, as mentioned above), timestamp, etc.
- Data Security: In order to ensure the web API is not overloaded or receives faulty data, there should be some authentication protocol, and perhaps some basic data validation (such as verifying a minimum subset of metadata) in place for API calls. This will need to be implemented both on the logging client side (credential storage) and web component side (credential validation).
Technologies and Other Constraints
The logging client will need to interface with the Unity games, and thus must be written in C# to be compatible. The logging web service is separate however, and as such can have its own unique stack. We are flexible in adapting to the team 's expertise and suggestions regarding the web stack, but this will almost certainly involve JavaScript, some form of data persistence, and basic networking capabilities.
Students will be required to sign over IP to sponsors when the team is formed
Sponsor Background
Department Mission:
The North Carolina Department of Natural and Cultural Resources (DNCR) oversees the state’s resources for the arts, history, libraries, and nature. Our mission is to improve quality of life by creating opportunities to experience excellence in these areas throughout North Carolina.
Division Mission:
The North Carolina Division of Parks and Recreation (DPR) administers a diverse system of state parks, natural areas, trails, lakes, natural and scenic rivers, and recreation areas. The division also supports and assists other recreation providers by administering grant programs for park and trail projects, and by offering technical advice for park and trail planning and development.
DPR exists to inspire all our citizens and visitors through conservation, recreation, and education.
- Conservation: To conserve and protect representative examples of North Carolina's natural beauty, ecological features, recreational and cultural resources within the state parks system.
- Recreation: To provide and promote safe, healthy and enjoyable outdoor recreational opportunities throughout the state.
- Education: To provide educational opportunities that promote stewardship of the state's natural and cultural heritage.
Data & Application Management Program
We support the Division, sister agencies and non-profits in web-based applications for various needs: personnel activity, Divisional financial transactions, field staff operations, facilities/equipment/land assets, planning/development/construction project management, incidents, natural resources, etc. Using data from these web apps, we assist program managers with reporting and analytic needs.
We have sponsored a previous SDC project, so we understand the process and how best to help you complete this project in an efficient manner while learning about real world software application development. Our team includes two NCSU graduates that worked on our last project; these two will be overseeing the project and working directly with you to fulfill your needs and make the process smooth.
Background and Problem Statement
The existing LAMP stack system was developed over the course of 25+ years, with ad-hoc application development in a production only environment (mainly using PHP and MariaDB) to meet immediate business operational needs of the field staff. Legacy system applications and applications upgraded in the previous Senior Design project have been containerized using Docker to run in parallel in the AWS cloud. Many of the legacy applications, including the Visitation application, were written as single file, procedural applications. This makes it difficult to read, maintain, and upgrade them. These applications need to be updated with modern design patterns and documentation.
DPR manages 41 state parks and recreation areas which have differing levels of technological access and implementation. Currently, the count for visitation (park attendance data) is manually entered into the application by staff at each park. Many of the parks have implemented IoT visitation counters to track people and cars. These counters are provided by SeeInsights and capture vehicle and pedestrian traffic. The counters have API connections, but staff are still having to manually input the data received from these devices into the DPR system. This is tedious, opens the data to human error, and creates delays in data input. The option for manual input and editing needs to be in place for parks without automated counters and for correcting errors in park visitation data. The visitation information is used for displaying metrics and for reports to make better business decisions.
Project Description
The new Visitation application should automatically pull data from parks’ IoT devices and add it to the database, allow parks staff to manually input and edit data in the database, and allow for viewing of all the data (all parks or by park) in a neatly organized dashboard that shows stats from this year and prior years with comparison metrics.
SeeInsights uses Particle Devices that upload data to a Ubidots cloud database. The new application should connect to the APIs exposed by Ubidots, or connect to the MongoDB that data is stored in, to allow for automated input of their data into the DPR database. Additionally, there should be an interface for park staff to add new devices to the automated Visitation system or edit existing ones.
We expect that, initially, data would just be pulled nightly, but a stretch goal is to have data pushed virtually instantaneously. This goal may depend on the API rate limits of the devices and network and their capabilities. A defined process for archiving historical data may also be a stretch goal.
We are in the process of implementing a new system that allows for continued use of the legacy system and establishment of a next generation system. The legacy system will be modified to be migrated to the next generation system for continued use, until all applications can be reworked and migrated appropriately to be integrated into the next generation system. The new Visitation application will be able to be seamlessly integrated into our next-gen system using Docker Compose.
Technologies and Other Constraints
Tools and assets are limited to what has been approved by the NC Division of Information Technology (NC-DIT). Most of the ‘usable’ constraints will be what is limited to NC-DPRs use through NC-DIT.
- Container Orchestration
- Docker – suggested for personal/team local use
- GIT – required
- PHP 5 & 8 – required; PHP 5 legacy system; PHP 8 updated apps
- Slim - PHP framework, required
- React - Frontend JS library, required
- MaterialUI - React component library, encouraged
- MariaDB 10 – required; uses InnoDB engine
- SeeInsights – this is the IoT vendor. They use the Ubidots platform and Particle devices: https://seeinsights.com/
- Ubidots – required; this is the IoT development platform used by the vendor: https://docs.ubidots.com/v1.6/reference/welcome
- Particle – the device manufacturer: https://docs.particle.io/reference/reference/
Students will be required to sign an NDA related to personal and private information stored in the database and to sign over IP to sponsors when the team is formed.
Sponsor Background
Katabasis is a non-profit organization that specializes in developing educational software for children ages 8-15. Our mission is to facilitate learning, inspire curiosity, and catalyze growth in every member of our community by building a digital learning ecosystem that adapts to the individual, fosters collaboration, and cultivates a mindset of growth and reflection.
Background and Problem Statement
In today's education systems, young people are very rarely taught sensible financial lessons, and can often be put into situations to make important financial decisions before fully understanding their repercussions. These problems are felt even more in areas where there is less to go around, and can lead to compounding cycles of generational poverty, among other things. We want to find a way to teach children in late middle school and early high school (right around the time they may be starting to develop financially) the principles that go into sensible financial decision making and increase financial literacy in these groups as a whole.
Project Description
Katabasis is seeking to develop a strategy game (real-time or turn-based) centered around teaching children basic principles of financial literacy, including debt, income, education, assets, credit, credit score, etc. To accomplish this, we are envisioning a game centered around towers; player-controlled towers representing various forms of income and assets, and enemy-controlled towers, representing debt and expenses. Touchstones include games like Tower Clash, Fieldrunners, and Stratosphere. We want to allow enough freedom in the design for the team to get creative with the implementation. That being said, here is a summary of the core features we are looking for:
- Strategy Game: This game will consist of more of an abstract or "zoomed-out" view of gameplay, where players control a whole army, not individual characters. We have no inherent preference on whether it is turn-based or real-time, and are eager to hear the team's thoughts on what would fit the design best.
- Towers: The core theme of the game is to make it centered around capturing towers throughout a growing world map. These towers produce troops for the player that are used in assaulting more towers to continue conquest and improve the player's core engine.
- Financial Literacy: The most important aspect of the game is how it is able to reinforce financial literacy concepts. We don't want to merely draw comparisons between elements; we want the fundamental gameplay loop to reinforce these concepts and instill understanding of how the financial system works (debt enabling further financial advancement, tactical debt acquisition to improve credit score, student loan and value of education, etc.). In order to help with this process, the analogy for the game we have drawn up consists of roughly the following:
- Friendly Troops: Income (Salary, passive income, short bursts, etc.)
- Enemy Troops: Expenses (living expenses, luxury items, debt payments, etc.)
- Towers: Core Financial Assets (University degree, car, job, etc.)
- Bosses: Life events incurring major expense (Children, medical emergency, job loss, etc.)
- Passive Bonuses and Troop Improvements: Qualitative financial metrics (industry working in, credit score, location, etc.)
- Troop Reserves/Shields: Insurance (only kicks in against bosses)
Technologies and Other Constraints
We are flexible in choice of game engine and encourage the team to discuss internally on what may be the best fit. If multiple members of the team have limited experience working with game engines, we recommend Unity as a very robust option. In any case, we look forward to hearing the team's reasoning for going with whatever engine they decide upon
Students will be required to sign over IP to sponsors when the team is formed
Sponsor Background
Wake Technical Community College (WTCC) is the largest community college in North Carolina, with annual enrollments exceeding 70,000 students. The pre-nursing program in the Life Sciences Department runs a two-course series on Anatomy and Physiology, where this project will be used, with enrollments exceeding 800 annually. Additionally, this project is expected to assist over 1,000 biology students when fully implemented.
Background and Problem Statement
Biology students as well as pre-nursing students need to understand how the body carries out and controls processes. Proteins have a diverse set of jobs inside cells of the body including enzymatic, signaling, transport, and structural roles. Each specific protein in the body has a particular function and that function depends on its 3D conformation. It makes sense then, that to alter the activities within a cell or body, proteins change shape to change function. One important example of this is hemoglobin. Hemoglobin is a huge protein found inside red blood cells and its primary function is to carry oxygen and carbon dioxide to and from cells of the body, respectively. Structures inside hemoglobin bind to oxygen dynamically at the lungs and then release the oxygen at metabolically active tissues.
As a beginning biology or pre-nursing student this is a difficult process to imagine from a 2D image in the textbook, and we have worked to create a tool that helps visualize protein dynamics using augmented reality. In various iterations the tool has supported the use of AR tags to change the environmental factors that influence protein structure and function, basic animation of structural changes of 3D protein structures, and the creation of structured activities to support educational use—although never all at the same time. Integrating and enabling all of these features, alongside several new ones to make the tool more suitable for online education, is the emphasis of this project. In particular, supporting decentralized collaborative AR experiences for teams of students or students and instructors through the use of real-time video collaboration and recording, integrating animation features with the use of multiple AR tags, and connecting to the instructor’s assignment specification and grading views will be the main goals. As a stretch goal, integrating with Blackboard (WTCC’s LMS) to facilitate rosters and grading is also desirable.
Project Description
 The prior version of the existing AR app used three.js, existing crystallographic information files (.cif) and parsers (LiteMol), and a DB backend for identity and content management. Last semester a team began the process of updating the app to React. The aim for this semester will be to complete that transition to React for all existing functions, and to enhance functionality by enabling distributed shared experiences. There are three main existing use cases:
- Instructors can specify protein molecules (e.g., hemoglobin, see Figure) using .cif files, define the environmental factors (e.g., temperature, oxygen, etc.) that impact protein structure, and set rules from triggering structural transitions.
- Students can visualize the 3D structure of proteins by placing an AR tag on the surface, loading the web-app on their mobile device, and moving around the environment. They can further manipulate the simulated environment by applying environmental factors (either through UI controls or AR tags).
- Instructors can define “lessons” for students that prompt them to answer certain questions by investigating the 3D structure and submitting responses through the web-app (multiple choice, short answers, or submit a screenshot).
These three use cases are supported to a varying degree in different implementations of the app, and bringing all of those functionality under one app version is a primary goal. In addition, in-person collaboration is currently feasible through the use of AR tags and multiple devices. An additional use case to design for is to support remote collaboration among students or students and instructors.
- Multiple students or multiple students and instructors can collaboratively view a 3D structure, even if not co-located, and share the role of applying environmental manipulations to influence protein structure.
Technologies and Other Constraints
- This must be a web-based app with AR views supported on mobile devices and instructor/backend systems on desktop browsers.
- React (in transition)
- Three.js (existing, can be replaced)
- AR.js (existing, can be replaced)
- LiteMol (existing, can be replaced)
- Spring (existing)
- Gradle (existing)
Students will be required to sign over IP to sponsors when the team is formed
Sponsor Background
The Geohazards and Earthquake Engineering (GeoQuake) lab is a research lab in the Civil, Construction, and Environmental Engineering Department at NC State. The GeoQuake team investigates how soils and rocks increase the damaging potential of earthquake ground shaking to civil infrastructure. The GeoQuake team also strives to advance education and outreach programs for Latin American students, which is why
we designed the Earthquake Engineering and Seismology Community Alliance in Latin America (E²SCALA) program. E2SCALA means to “climb” and also to “scale” in Spanish and those are key drivers of this project; to help Latin American students reach their highest potential (to climb), while building a network that grows with the community’s goals (to scale up).
Background and Problem Statement
Underrepresentation of Latin students in undergraduate and graduate programs in STEM remains a challenge. Addressing the fundamental causes for having less than 2% Hispanics joining the STEM workforce is of special interest to NC, which has one of the highest Latin American population growth rates in the country. Additionally, the disproportionate effects of earthquakes in Latin American countries (e.g., the 2010, 2021 Haiti, 2016 Ecuador, and 2020 Puerto Rico earthquakes) relative to similar magnitude events in Japan and New Zealand reveal the critical need for community alliances to connect and engage professionals and students in Latin America who have an interest in earthquake engineering and seismology.
The COVID-19 pandemic has taught us that it is possible to be globally connected using virtual platforms. While not ideal, new frontiers can now be explored in remote learning, but not without challenges in the design and development of global, open access, educational and community-driven virtual platforms.
Project Description
The E²SCALA initiative will provide global, open access to educational resources, virtual mentorship, and collaboration opportunities to Latin American students in the US and at partner academic institutions in Latin America. To launch this online community and collaboration platform, phase I of the project was completed by a CS Design team in Spring 2022. The following tasks were completed in phase I:
- Definition of users, roles and privileges: There are four main types of users in the platform, namely the Administrative team, Partners, Student ambassadors, and General membership.
- Creation of membership database
- Platform’s technical content: working groups, about page, events page, and resources page.
- Assessment of community building via formative surveys, platform stats, and feedback from members.
- Management of the platform
While phase I of the E²SCALA virtual community platform enabled the completion of key components, the following tasks (i.e., phase II) remain necessary to guarantee a successful launch in January 2023:
- Add a filter or search feature to the Members page so users can filter/search for specific members, topics of interest, or areas of expertise.
- Create a new Events plugin because the current Events plugin display has been deprecated and is no longer supported by the creators of the plugin. The new plugin should be compatible with multilingual support.
- Improve multilingual support for the platform:
- Create a custom plugin for translations, where posts will be translated automatically, but can be updated manually if the translations are not accurate. Google Translate API might be an option, but it has a cost associated with it.
- Adding Portuguese to the list of translated languages would be desired.
- Improve visualization of platform metrics:
- Creation of a Listserv
- Emails of the general membership should be collected through a registration form.
- A listserv should be populated (and updated) automatically as new members register and current members update their contact information.
- Improve aesthetics of the platform with input from the GeoQuake team.
- Ensure that the platform is accessible.
- Display a Twitter feed on the about page that shows latest tweets from @E2SCALA. The GeoQuake team will create the Twitter account and most likely start engaging in social media by the end of October 2022.
- Integrate existing social media tools that track interactions with E²SCALA’s Twitter account as a way to quantify engagement with the community.
Technologies and Other Constraints
This project needs to be web-based. Technologies to use are based on what phase I of the project deemed appropriate and what phase II may require for improvements. For example, technologies used during phase I of the project included WordPress with various external plugins as well as some custom-made plugins. Using WordPress as a framework with a MySQL database allowed for a fast, server-side rendered site for users. Using Docker also allows all of these features (plugins, WP, MySQL) to be brought together in a seamless/hassle free manner. A more complete list of resources used in phase I is provided at the end of this document.
Recommendations stemming from the completion of phase I of the project include: (1) becoming familiar with the available User Guide, Developer’s Guide, and Installation Guide to see the details of phase I, (2) hosting the site can help with one of the largest obstacles encountered in phase I, which was slowed speed from running the docker container in order to see the site live, and (3) thoroughly researching available plugins within WordPress before trying to write custom ones.
Finally, ensuring that maintenance is sustainable by a non CS student is important. Educational resources such as hyperlinks to Jupyter workflows, open source software, videos such as recorded webinars and zoom interviews will be hosted in the platform. Moreover, E²SCALA should be an accessible and inclusive platform (e.g., https://wave.webaim.org/).
Resources used during Phase I:
- Wordpress
- BuddyX (WP Theme)
- Elementor (WP Plug-in)
- Hide Admin Bar Based on User Roles (WP Plug-in)
- Kirki (WP Plug-in)
- Members (WP Plug-in)
- Metrics Query (WP Plug-in)
- The Events Calendar (WP Plug-in)
- Yoast SEO (WP Plug-in)
- User Registration (WP Plug-in)
- WP Menu Icons (WP Plug-in)
- Pods (WP Plug-in)
- Leaflet Map
- Extensions For Leaflet Map
- PolyLang
- PHP
- Docker
- MySQL
- NCSU Ubuntu VM
Sponsor Background
IBM is a leading cloud platform and cognitive solutions company. Restlessly reinventing since 1911, we are the largest technology and consulting employer in the world, with more than 350,000 employees serving clients in 170 countries. With Watson, the AI platform for business, powered by data, we are building industry-based solutions to real-world problems. For more than seven decades, IBM Research has defined the future of information technology with more than 3,000 researchers in 12 labs located across six continents.
The Department of Forest Biomaterials at NC State’s College of Natural Resources is home to one of the oldest and most respected paper science and engineering programs in the world as well as a cutting-edge sustainable materials and technology program.
Background and Problem Statement
Background: As of 2018, 300 millions of tons of municipal solid waste (MSW) was available in the US. Of that material, about 50% was landfilled. This represents a huge opportunity for the conversion of the energy value of MSW not captured into cost effective and sustainable biofuels, which can help support DOE’s selling price < $2.50/GGE and national energy security independence.
We are working on AI driven MSW characterization with the use of visual, multi-spectral, and hyperspectral sensors. The idea is to build and train models to identify types of materials (grade 4 plastic, high lignin paper content, glass etc.) in real time.
Project Description
We propose to work on two key parts of the project; each addressing two ends of the Data and AI pipeline. In the beginning of the AI pipeline, we focus on data cleaning and annotation. Currently, we are capturing a huge amount of image data which needs to be sorted to identify clean, unique images. We need a way for domain experts to annotate these images with bounding boxes to label them for machine learning use. At the end is where Augmented reality (AR) technology can help us identify the predicted class of object in 3D space. Our trained machine learning model should ideally identify the MSW object types moving on a conveyor and convey this information via AR technology to the sorters. The current project focuses on the following features:
- Image Data Set Creation and Annotation
Team needs to integrate an annotation page to the existing project web. The annotation would leverage crowdsourcing by domain experts. Team needs to provide the interface to researchers to do annotations, and back-end software to manage and save those annotations. - Augmented reality assisted sorting: Identify 2D objects in a 3D space
This part of the project is open ended. The goal is to transfer the intelligence of the trained model to the actual user (MSW sorter) who would be benefiting from it.
Scenario: Suppose person A manually picks the items from the conveyer belt carrying MSW.
Next, our research team builds an AI to identify items in real-time frames. Can we pass the intelligence of identifying the items to person A in real time with Visual AR aid?
Skills: Computer Vision, Cloud AI tools, AR toolsets, Cloud DevOps. Front end interface design
Technologies and Other Constraints
GitHub (preferred)
Computer Vision, AR
Web front end (initial pipeline includes React, but flexible)
Cloud Services for AI and DevOps (IBM mentors will provide the training)
Sponsor Background
PositiveHire is a cloud based recruiting software company. It is tailored for experienced Black, Indigenous and Latinx women professionals who have STEM degrees to find their next career opportunity.
To reach this mission, PositiveHire platform has a 3-part model which includes:
- a community of Black, Latinx and Indigenous women in STEM
- a job board option for recruiting underrepresented women in STEM
- a People Analytics solution, PH Balanced™.
Background and Problem Statement
Too often employers are looking to diversify their employee base; they look for early career talent to fill entry level roles. But employers overlook the current diverse talent they have in their organizations.
We’re focused on retaining mid-career Black, Indigenous and Latinx women who are scientists, engineers and technology professionals.
How?
We found that current employee performance evaluation processes and Human Resources software do not capture or delineate the inequity in promotion of marginalized women in STEM.
PH Balanced, SaaS platform, helps organizations identify their internal diverse talent prime for promotion.
About PH Balanced
PH Balanced helps organizations retain diverse talent before they start recruiting them.
PH Balanced is a people analytics tool that employers can leverage to obtain diversity metrics about their employees, in order to create Diversity, Equity & Inclusion (DEI) goals and track the progress of their DEI plan.
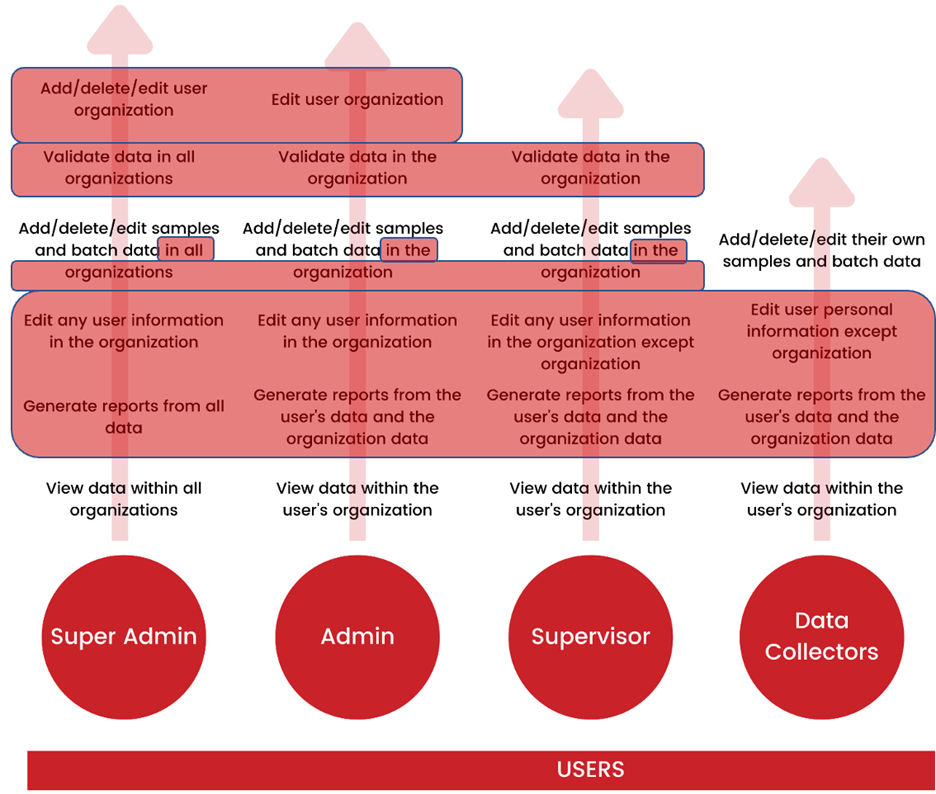
PH Balanced can be used by organization personnel to perform the following:
- Use existing HR systems to generate ad hoc, and standard recurring reports to support business needs and HR processes. For this project, sample data will be provided via CSV file format to import into the created database. In the future, API integration between PH Balanced and HR systems to pull data into the software will be available.
- Interpreting reports and metrics for business partners helping them to understand the story the data is telling to ensure (employers) have a clear, (concise) communication and a reliable reporting experience.
- Generate insights and analysis to share with People Partners and Senior Leadership on key focus areas such as engagement, retention, and diversity and inclusion
- Manage people metrics and creation of materials for the Chief People Officer CPO, Executive Team and People Leadership team, identifying key trends behind people data
Project Description
The goal of this project is to develop a visualization dashboard using data generated from learning & developing system and human resources information systems (HRIS). Access to HRIS and payroll systems (data) such as UKG and Rippling may be made available for testing. Test HRIS data will be made available. Test HRIS data to be provided include but is not limited to employees’
- demographic information
- performance rating
- performance review
- start date with employer
- end date with employer
- Pay/Salary
The dashboard display will be used to streamline and enhance organizational efforts in identifying personnel issues and trends as early as possible with a focus on diverse talent retention. Developing a web dashboard would be beneficial as a cross-platform solution where employee promotion and training trends can be easily digested and customized for diverse employee retention.
Users will be able to make a choice of the chart types(date ranges, & employee data options) they want displayed on their dashboard. (Examples listed below)
- Chart Types:
- Area Chart
- Map
- Box & Whisker
- Line graph
- Bar chart
- Column chart
- Table
- Pie Chart
- Area Chart
- Date Ranges/Time Period
- Data Options (Employee Data Options)
- i.e. Job Title, Employee # or i.d., salary/pay, start/end date etc.
The Figma prototype provides users the ability to select company information such as
- location
- function
- department
- employee status
- job level
- race
- gender
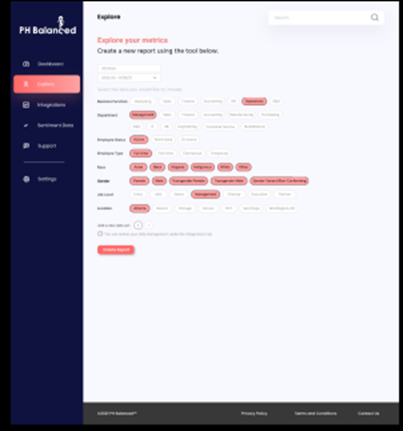
Figure 1.
The student team will be expected to develop an interactive web based dashboard to display business intelligence data and human resource analysis.
- Interacting with UI
Including choices and options for personalization of the data charts to be created in the reports i.e. selection of chart type, chart title, axis titles, etc. - Generation of a reports dashboard for the following report categories, for which data will be provided. Customers create their own chart/dashboard. Based on user inputs (data options) and choice of chart type
- Attrition data could be analyzed by gender, tenure with company, job title, race, location, promotion, etc.
- Retention data could be analyzed by training, mentoring, gender, tenure with company, job title, race, location, promotion, etc.
- iii. Hiring data could be analyzed by gender, job title, race, location, education, previous employment with organization, number of interviews, interviewers, interview scores, etc.
- Representation is defined by ISO 30415:30415 Human Resources Diversity & Inclusion standard which has diversity 27 characteristics
- Training records data could be analyzed by gender, tenure with company, job title, race, location, promotion, etc.
- Base salary data could be analyzed by gender, tenure with company, job title, race, location, promotion, etc.
- Development of a relational database containing sample HRIS and personnel data to be used to generate dashboard information(sample data provided by PositiveHire)
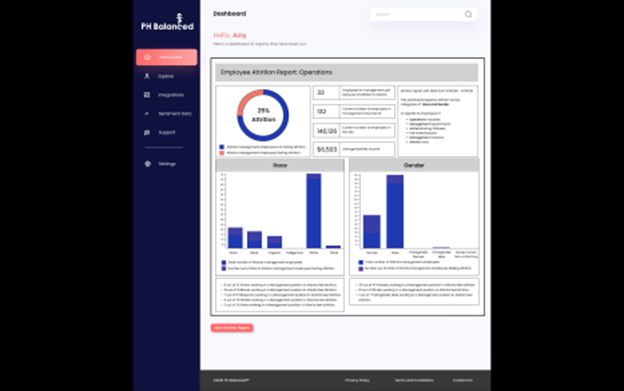
Figure 2.
Stretch Goals
If the team has capacity and time, additional features for development include:
- Authentication into PositiveHire user account and dashboard; This is a brand new feature.
- Import CSV data to the database for use in analysis and dashboard report generation. The data required to initialize the database will be provided at the beginning of the project. It is not real HR data because of the sensitive nature of Human Resources Data. CSV upload is a system feature but it is not required for this project.

Figure 3.
Technologies and Other Constraints
Previous experience developing web server applications is strongly recommended for this project.
Exposure or experience with the following technologies and programming languages are suggested for this project:
- HTML/JavaScript/PhP/Python or similar language for web application front/back end development
- AWS data services/backend infrastructure
- Database (SQL/MySQL) backend
- Collaboration platform (Miro/GitHub/Codesandbox/etc.)
Support
PositiveHire project managers will be available to lead the students throughout the project as they review requirements, develop sprints and track project burndown during the course of the semester.
PositiveHire will provide the following:
- Sample data for database population and analysis tasks
- Wireframe/prototype demonstration of current UI
- Requirements and user stories/use cases
- AWS, team collaboration platform and web hosting access
- Guidance on specific development tools and framework use and configuration
Meetings with the project manager will be expected weekly via virtual conferencing platform.
Students will be required to sign over IP to sponsors when the team is formed
Appendix
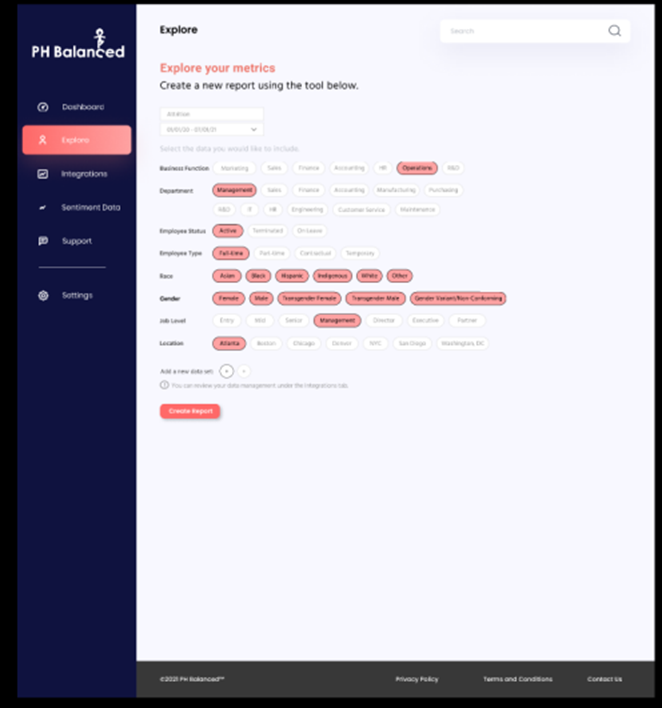
Figure 4. Data Options
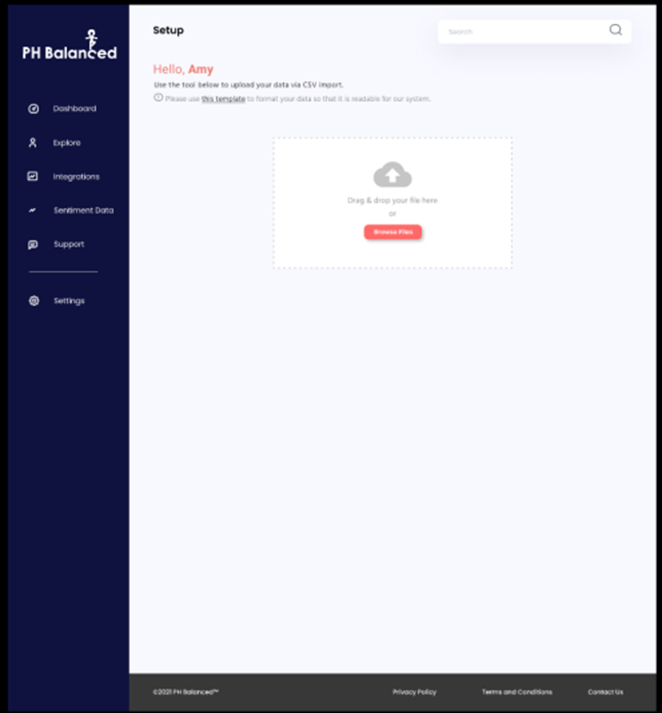
Figure 5. CSV Feature
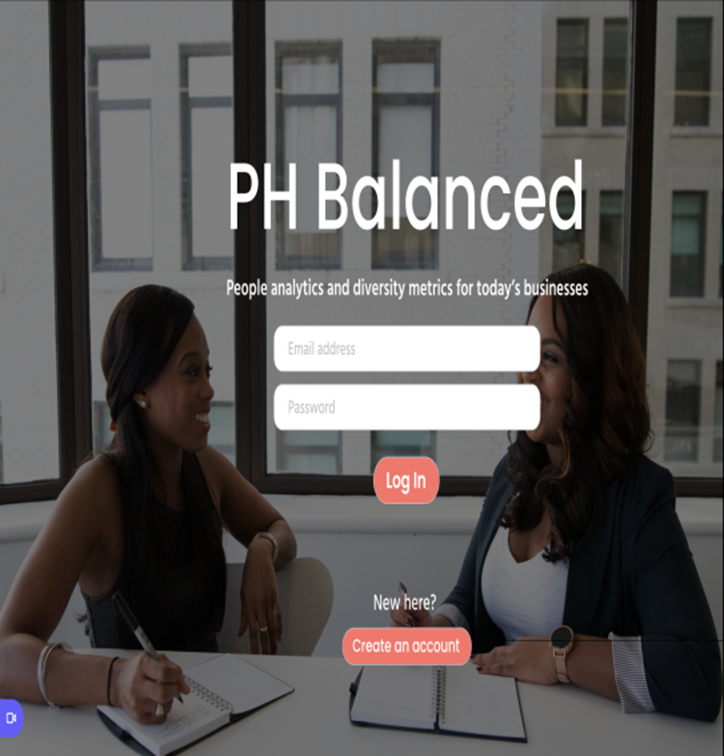
Figure 6. Login Page
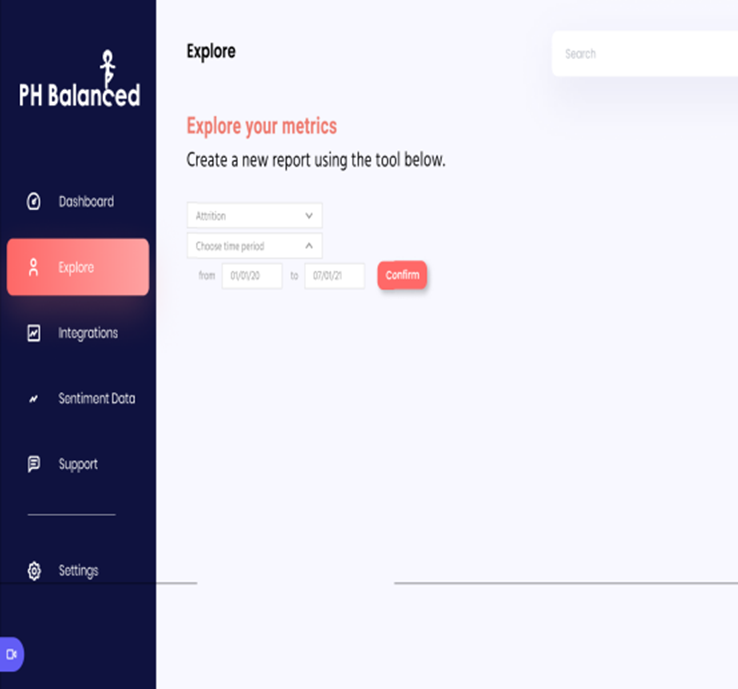
Figure 7. Metric Selection
Sponsor Background
Salesforce is the world’s #1 customer relationship management (CRM) platform. We help your marketing, sales, commerce, service and IT teams work as one from anywhere — so you can keep your customers happy everywhere.
Salesforce unites your marketing, sales, commerce, service, and IT teams from anywhere with Customer 360 — one integrated CRM platform that powers our entire suite of connected apps. With Customer 360, you can focus your employees on what’s important right now: stabilizing your business, reopening, and getting back to delivering exceptional customer experiences.
Background and Problem Statement
GraphQL is an increasingly popular open source technology. It provides a query language and runtime engine that can be fit onto a wide array of backend services. Several leading companies use GraphQL for its ability to optimize and simplify access to complex backend services from lightweight client devices such as web browsers and mobile apps. Salesforce is typically used to represent an organization's Customer Relationship Management (CRM) data such as Accounts, Contacts, Sales Opportunities, Cases, etc. A developer who uses the Salesforce platform might extract data to present in an alternative custom user interface or to combine with other data in their private repository. An organization could use Salesforce as a warehouse for their customer account information and use the GraphQL endpoint to show that information in a special report or cross reference it with the organization’s separate internal financial database.
GraphQL uses the concept of a schema to explicitly define how data can be queried. A GraphQL schema describes a type system with objects and their fields, custom scalars, interfaces, enumerations, unions, and list constructs. Each instance of a GraphQL service defines a schema which is typically geared towards streamlining data access from the client’s perspective.
These schemas change over time, but they tend to be static within the application’s execution lifecycle. The process of rebuilding and redistributing that schema to all clients across the network can be complex and costly at an enterprise scale.
At Salesforce, a major feature of the platform lies in the configurability and adaptability of its data model. Salesforce platform developers start with a standardized data model and customize it for the needs of their organization. In addition, the visibility of objects and fields in the data model can be customized through Object and Field Level Security (https://developer.salesforce.com/docs/atlas.en-us.securityImplGuide.meta/securityImplGuide/admin_fls.htm). Changing the Salesforce data model is easily done using an intuitive user interface, and is also frictionless because the platform automatically detects and prevents certain types of breaking changes. The dynamic and user-centric nature of the Salesforce data model makes it challenging to implement a GraphQL service on top of it because of the static nature of GraphQL schemas. Salesforce developers need an enhanced type of GraphQL schema that can better support the dynamic nature of the Salesforce data model.
We have experimented with using the existing capabilities of GraphQL to build schemas on demand. Our first prototype built GraphQL schemas dynamically on the server based on the customer's current database schema and the user's visibility into the fields of that schema. We discovered the following issues with this approach:
- It caused major performance issues because it does not scale well in a multi-tenant environment where compute resources can be strained. Deriving the graphql schema from the underlying database's schema and then further refining it based on the user's effective permissions proved to be too costly at scale.
- The dynamically built GraphQL schemas could not be cached effectively without a sophisticated cache invalidation strategy that would introduce major complexity costs.
- The nature of our software development model can require that the designer of client tier software knows the graphql schema well in advance for writing queries, and that they have certain guarantees the schema will not change without a formal change process and a versioning system. They expect to be able to import a static graphql schema into their development tools and to include them in their software bundles (what we call "managed packages"). These software bundles can be difficult and sometimes even impossible to change after being deployed into production.
These discoveries have led to the idea of creating a more expressive static schema as proposed in the Project Description below.
Project Description
The team should first familiarize itself with the basic concepts of GraphQL by studying the official documentation at https://graphql.org/learn/. Pay special attention to the discussion about types, data modeling, introspection, and client-server request model.
As the team learns about GraphQL, take note of how the type system is static, meaning that all schema elements used in client/server interactions are known in advance and “hard coded” in the schema (see example in Additional Information Section Below).
For this project, the team will implement a new GraphQL feature which addresses the limitations of the static schema structure. A proof of concept GraphQL service should be implemented on top of a simple relational database (RDBMS). However, the schema and query syntax for your GraphQL service will support a dynamic type system that can adapt to changes in the RDBMS data model and also takes user-centric visibility of that data model into account. The main goal of dynamic typing in the schema is oriented towards building capabilities into the client.
Since GraphQL does not natively support dynamic schemas, the team will design and implement this idea as a new GraphQL feature directly in its source code. The value of this feature should be demonstrated in a generic way, outside of the specific Salesforce use case. New GraphQL query and schema syntax to support such a feature are allowed and encouraged. The schema itself should be stable (e.g. cacheable) when the RDBMS model changes, It should also be the same for all users regardless of their permissions, as described in the discussion about Metaschema (see the Additional Information Section Below). Ideally the feature could be demonstrated in GraphQL’s in-browser testing tool (Graph-i-QL) running on a fork of the graphql-js github repository at https://github.com/graphql/graphql-js.
Technologies and Other Constraints
Further details about the Salesforce GraphQL API is at https://developer.salesforce.com/blogs/2022/03/introducing-the salesforce-graphql-api
- GraphQL
- RDBMS (Postgres, MySQL, etc)
- Javascript / NodeJS
- Git / GitHub
ADDITIONAL INFORMATION
Example of schema elements known in advance and “hard coded”:
Consider the following subset of the sample schema example used in the GraphQL documentation at https://graphql.org/learn/schema/. The schema includes two types of Characters: Droids and Humans. Notice how both Droids and Humans have ids, names, and other string fields, so there is a bit of redundancy. Our goal might involve allowing multiple types of generic Characters, each with an id, name, and one or more other fields. However, instead of hardcoding a schema for each type of unique Character, one may wish to define a generic Character schema that can be reused without having to explicitly define each possible unique type of Character separately. If any new types or Characters are introduced, or if any fields associated with Droids or Humans need to change (for example, adding a new String field or renaming an existing String field), then the schema would need to be updated and redistributed to all clients.
interface Character {
  id: ID!
  name: String!
  friends: [Character]
  appearsIn: [Episode]!
}

type Droid implements Character {
  id: ID!
  name: String!
  appearsIn: [Episode]!
  primaryFunction: String
}

type Human implements Character {
  id: ID!
  name: String!
  friends: [Character]
  homePlanet: String
}

type Query {
  character(id: ID!): Character
  droid(id: ID!): Droid
  human(id: ID!): Human
}
An example query for this schema might look like:
query {
  human(id: "1000") {
    name
    ... on Human {
        homePlanet
    }
  }
}
Development tools can use the schema to preemptively generate client code for enhancing ad hoc queries and for ingesting data from their responses into a shared cache. These types of capabilities are important for advanced users of GraphQL. But the limitations of a static type system would present a challenge if certain parts of the type system cannot be known in advance.
Example of an Approach that Supports One Schema per User:
One approach that has proven successful is to effectively (but not actually) support one schema per user. This approach introduces the concept of a “Metaschema”, which is a schema that represents all schemas that are possible to construct. If you imagine the cardinality of the above types to be 1 in a static schema, then the Metaschema has types with cardinality n. We call these “type categories”. If you have experience with programming languages that feature generic types, then you might think of generic types as similar to type categories. For example in the Java programming language, although there are infinite possible instantiations of the Map<K, V> type, the generic type Map<K, V> can be said to represent the set of all possible instantiations. This set of all instantiations is analogous to our term “type category”.
The following GraphQL schema demonstrates how dynamic types could be introduced into the example previously discussed above. The syntax for a “type category” encloses its name in angle brackets (<>). Just to be clear, this syntax is not actually supported by GraphQL and is only used as an example. A “field category” is denoted by the use of a '?' following its name, again an example syntax that is not actually supported by GraphQL. Like type categories, field categories represent N possible fields on the object.
interface Character {
  id: ID!
  name: String!
}

type <MyDynamicType> implements Character {
  id: ID!
  name: String!
  friends: [<MyDynamicType>]
  StringValue?: StringValue
}

type StringValue {
  value: String
}
An example query for this schema could look like:
query {
  human(id: "1000") {
    name
    # a directive can inform the client of the field category for the 'homePlanet'
    # field, which means it can know the type is 'StringValue'
    homePlanet @category(name: "StringValue") {
        # now that we know the static type is 'StringValue', we know 'StringValue'
        # has a static field 'value' of type 'String'
        value
    }
    # a directive can inform the client of the field category for the 'droidFriends'
    # field, which means it can know the type is in the 'MyDynamicType' type category.
    # the 'instance' value informs that client that the dynamic type is named 'Droid'
    droidFriends @category(name: "friends", instance: "Droid") {
        Id
    }
  }
}
Note how this approach allows the Droid and Human types and their fields from the static schema to instead be defined using a generic type category "MyDynamicType". The @category directive in the query provides the additional hints needed by the GraphQL service to map the types and fields onto the RDMBS data model. And development tools can use this schema to generate client code capable of parsing queries and ingesting data from their responses.
Students will be required to sign over IP to sponsors when the team is formed
Sponsor Background
SAS provides technology that is used around the world to transform data into intelligence. This project is sponsored by the SAS Energy Practice, and has a focus on leveraging computer intelligence to help users apply renewable energy strategies for a more sustainable future for our world.
Background and Problem Statement
The adoption rate of electric vehicles cannot be separated from charging infrastructures. The adoption of Electric Vehicles in North Carolina is somewhat hampered by lack of efficient access to charging stations. Charging stations therefore face the problems of optimal siting so chargers are accessible so that people don't run out of charge before they can get to a charging station.
There are also different types of charging stations required for different types of vehicles. Automobiles use one type of charger, fleet vehicles such as mail carriers, light trucks, and even heavy trucks have different demands and needs for charging. The demand for Electric fleet vehicles continues to grow, along with the demand for accessible chargers.
Project Description
The goal of this project is to develop a web application or report that highlights the optimal placement of EV charging stations for different types of vehicles, based on charging demand and existing road networks in the state of North Carolina. The objective of the underlying algorithm is to optimally site stations to best facilitate access to charging stations for different types of vehicles.
The result should be a web application that shows, based on the NC State Road System, the most optimal placement for EV chargers based on road usage statistics (https://ncdot.maps.arcgis.com/home/index.html) first for automobiles, and then (optionally depending upon time) for different classes of fleet vehicles. The application should be interactive so users can explore and understand how various parameters affect the placement such as road usage, type and storage capacity of vehicle, cost associated with siting charging stations, and other factors that are interesting and important that affect where the most optimal placement of charging stations should be.
The application should be interactive. The team can choose to write a custom web application in Javascript and React, or can explore using a reporting application such as SAS Visual Analytics or Tableau (all free for students) to provide a detailed report of your finding. The results should be displayed in a main map view and then any other information you want to present. Plan to make the application dynamic, so that users can adjust various parameters to explore the data and how varying different parameters affects the results of the placement.
The team’s work is important and has a lot of interest. The team will be making a positive difference in this project to help further the cause of electric vehicle adoption in our state. If the team chooses to use a reporting application, SAS may publish the report on its website; if the team uses Tableau, the team can place the report up on Tableau Public website to showcase the work. The State of North Carolina has also been interested in this research area, so the team may get an opportunity to present the application to NC State government teams that have an interest in the findings.
Technologies and Other Constraints
- This research paper can help with the algorithm for this shortest path problem. It is based on the road System in Sweden, but the underlying algorithm can be the same, just using the road system of North Carolina instead. https://www.researchgate.net/publication/254026778_Optimal_siting_and_sizing_of_electric_vehicle_charging_stations In particular, the algorithm is defined in II.C in this paper.
- Python should be used to develop the underlying code
- Storage - any preferred storage that the team can work with.
- UI can be a custom Javascript Web application in React, or a reporting application such as SAS Visual Analytics https://www.sas.com/en_us/software/viya-for-learners.html which is free for students, or Tableau which is also free for students.
The team will gain knowledge from this project of machine learning principles, how graphing map data works, and graphical map presentation software. Knowledge of Python will be helpful. The team may want to contribute its design into the open-source community.
Reference info, Data Sources, other examples, etc.
- https://www.geeksforgeeks.org/travelling-salesman-problem-set-1/
- NCDOT records research https://ncdot.maps.arcgis.com/home/index.html (mapping application for daily traffic volumes).
- This resource has a variety of different mapping applications about NC traffic volumes: https://connect.ncdot.gov/resources/State-Mapping/pages/traffic-volume-maps.aspx.
- NCDOT has a ZEV plan for accelerating electric vehicle adoption in NC: https://www.ncdot.gov/initiatives-policies/environmental/climate-change/Documents/nc-zev-plan.pdf They also have corresponding registration data that is downloadable: https://www.ncdot.gov/initiatives-policies/environmental/climate-change/Pages/zev-registration-data.aspx
- https://www.researchgate.net/publication/331963177 - Electric Vehicle Charger Placement in the State of Michigan
- North Carolina Road Network https://connect.ncdot.gov/resources/gis/pages/gis-data-layers.aspx (readable via Python)
- Regional Travel Demand Model. Piedmont Authority for Regional Transportation (PART). https://www.partnc.org/228/Regional-Travel-Demand-Model
- https://www.fhwa.dot.gov/policyinformation/travel_monitoring/tvt.cfm Traffic pattern trends
- https://fncdn.blob.core.windows.net/web/1/smart-transport-resources/charge-the-north-results-from-the-worlds-largest-electric-vehicle-charging-study.pdf EV charging study
Sponsor has additional files that can be shared with students related to various papers on charger costs and fleet vehicle types and energy requirements.
Students will be required to sign over IP to sponsors when the team is formed
Sponsor Background
Bandwidth provides APIs which enable companies to build software using voice, SMS, and emergency (911) services. For example, reminder text messages from the pharmacy about a prescription, or the interactive voice menus when you call a business.
The majority of Bandwidth’s tech stack is deployed on Amazon Web Services (AWS) to enable fast scale-up when customer use spikes. Bandwidth is building new services every day that are also intended to be deployed on the cloud.
Not all Bandwidth developers understand the ins-and-outs of how each AWS service needs to be configured to ensure security, optimize cost, and provide efficient scale-up. This project will help with those deployments.
Background and Problem Statement
What is AWS?
“Amazon Web Services (AWS) provides on-demand cloud computing platforms and APIs to individuals, companies, and governments, on a metered pay-as-you-go basis. These cloud computing web services provide distributed computing processing capacity and software tools via AWS server farms.”
In layman’s terms, AWS enables a developer to deploy applications on the cloud which helps developers focus more time on business logic (new features) and less time on worrying about deployment (number of servers, OS patches, etc).
Problem
AWS has evolved a lot and there are now hundreds of services available. There are certifications proving one’s familiarity with AWS and there are careers made by gaining expertise in how to use it effectively. For small to medium businesses, rapid prototyping is essential in gaining market share and keeping up with competitors. A developer may not know the best practices or strategies to deploy the kind of services they want to use on the AWS cloud.
Bandwidth has attempted to mitigate this by building ZEUS, a library of templates for common AWS services which can be composed into packages of complete services. It aims to shorten the time needed to ship production grade applications to AWS by cutting down on boilerplate infrastructure code using AWS CDK constructs (CDK is a configuration language which tells AWS which services to launch and how to connect them together). Zeus is a great library for a backend Bandwidth developer to adopt when building a new application.
Project Description
So, what is HERMES and how does it solve the problem?
According to Greek mythology, HERMES is the god of translators and interpreters.
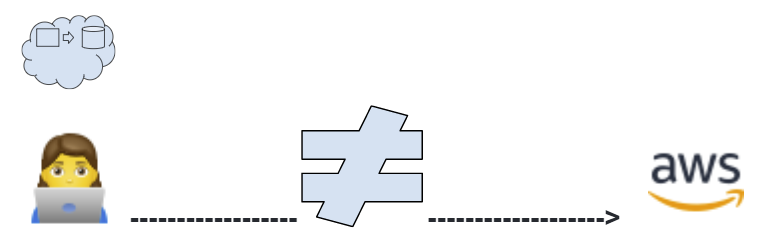
Zeus works great for developers who already know AWS and the details of backend developments. Unfortunately, for the many developers who don’t know AWS well, it is dangerously easy to deploy services which are insecure or scale poorly.
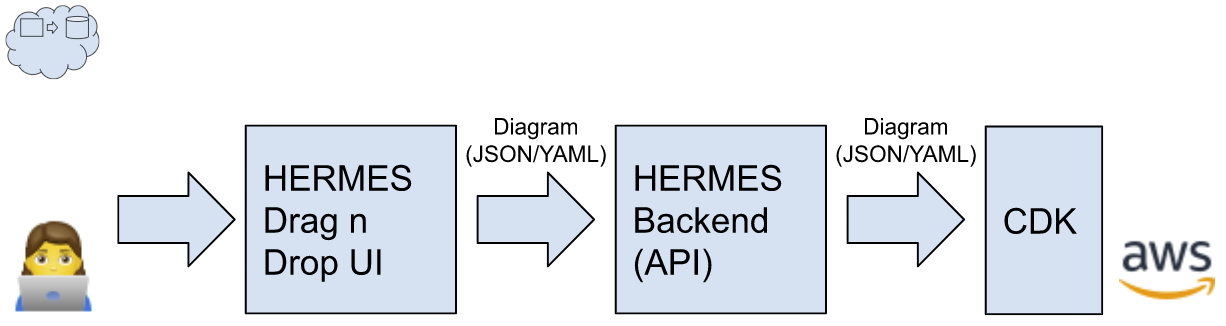
Enter HERMES - We envision a drag-and-drop GUI (web app) which allows developers to compose common AWS services together at the “conceptual boxes-and-arrows” level, without needing to understand the details of how these services are configured. Hermes would translate a developer’s architecture diagrams into CDK configuration files which can be deployed to AWS.
Hermes consists of three components:
- FRONT-END - a drag-and-drop GUI for composing diagrams of services
It should provide an intuitive interface to create services, connect them (using “boxes-and-arrows”), group them together in logical ways, and provide inputs for necessary configuration information - BACK-END - an API that interprets diagrams and generates CDK configuration files
It will check that each service has all required configuration values, check for common security or scalability issues, and prompt the user if there are any problems - DIAGRAM FILES - a text-based file format for storing diagrams-in-progress
In order to save & restore a diagram, and to pass a diagram to the back-end to proceed with the CDK generation, there must be a file format that stores the relevant information. We envision a simple JSON or YAML format providing structural representation of the diagram as well as layout information (location, size, color, label).
HERMES UI
A drag and drop interface that allows a developer to compose AWS services (represented as icons) together to form an architecture diagram. This UI needs to support “connecting” icons together with lines/arrows, as well as grouping sets of icons together inside another box.
Initially, we recommend supporting the following services:
- EC2
- Security Groups
- VPC
Time permitting, other services that would be nice to be supported are:
- ElasticBeanstalk
- Subnets
- Lambda (Function)
- DynamoDB
- API Gateway
- S3
- Route 53
HERMES Backend
The UI will send an API call to the backend once a diagram is complete. The backend will do some validations on the passed in data, store the data for later retrieval, then translate the diagram into CDK configuration files.
Diagram Format
Diagrams generated by the GUI should be serialized into a JSON or YAML format from which the diagram can be reconstructed at a later date. Additionally the diagram should be easily readable by the back-end to ease translation of the diagram into CDK configuration files.
Expected Outcome
- Create a drag ‘n’ drop webapp (we recommend using React + Typescript)
- Allow a user to construct a diagram of icons, arrows, and groups
- Allow user to label and color elements to improve readability
- GUI will check each edit to a diagram against a suite of rules
- Bandwidth developers will work with students to develop a reasonable list of rules for the allocated timeframe
- Ex: All boxes must have arrows pointing to them
- Ex: All compute instances must be in a security group
- Ex: All database instances must not be publicly visible
- Invalid connections (rule violations) will be highlighted or rejected by the GUI
- Example user session:
- User creates a security group (box containing other boxes)
- Add an EC2 instance to the security group
- GUI highlights the EC2 instance to show it has un-fulfilled requirements
- User clicks the EC2 instance to bring up its configuration pane
- Required configuration inputs are highlighted
- User enforces access to ports 443 and 8080 only
- Highlighting is removed to show EC2 instance is properly configured
- User presses button to generate the CDK files
- Create a Lambda function
- Create 2 database tables
- Link Lambda to database tables (to allow access)
- Create a DNS entry to access the EC2 instance
- Back-End API (we recommend using NodeJS + Typescript)
- POST request to the API contains the JSON or YAML formatted diagram
- API parses the diagram and checks it against the rules again
- Store the diagram as a file on disk
- Interpret the diagram into CDK configuration elements
- Compose the CDK elements into a final CDK deployment script
- Optionally: use the AWS command line program to deploy the CDK script
- Diagram Format
- JSON or YAML data format which contains enough information to reconstruct the GUI representation of the diagram drawn by the user
- Must allow:
- Type of entity (group, service, connection, etc)
- Label, icon, color, and size used for display
- Location of the entity in the GUI display
- Configuration data needed for this kind of entity
Technologies and Other Constraints
- We recommend using React+Typescript as the front-end framework.
- We recommend using NodeJS+Typescript for the back-end.
- We recommend using JSON for the data file format.
To test that the generated CDK files are valid and correctly configured, we recommend a “hello world” HTTP server as the deployment target. This is a static bundle that can be provided by Bandwidth developers. The generated CDK files (from the back-end) would be deployed to AWS, and their configuration verified using the AWS console or command-line program.
Picture Credits: https://icons8.com/
Sponsor Background
The Enterprise Infra Architecture team is a group of seasoned security professionals within Cisco who use our institutional knowledge, technical expertise, and threat landscape experience to engage with our internal business partners and stakeholders to create architectural solutions to secure their business. By understanding our partner’s goals, and then helping to apply our security policies and standards to their networks, devices, and infrastructure services, we help to keep Cisco secure.
OSQuery
“Osquery is an operating system instrumentation framework for Windows, OS X (macOS), and Linux. The tools make low-level operating system analytics and monitoring both performant and intuitive.
Osquery exposes an operating system as a high-performance relational database. This allows you to write SQL queries to explore operating system data. With osquery, SQL tables represent abstract concepts such as running processes, loaded kernel modules, open network connections, browser plugins, hardware events or file hashes.” [1]
OSQuery Packs are grouped queries for addressing use cases like Incidence Response monitoring, hardware monitoring, rootkit detection monitoring. OSQuery comes with these default packs plus more. New packs could be added based on the customer’s needs.
Center for Internet Security (CIS)
“The Center for Internet Security, Inc. (CIS®) makes the connected world a safer place for people, businesses, and governments through our core competencies of collaboration and innovation.
We are a community-driven nonprofit, responsible for the CIS Controls® and CIS Benchmarks™, globally recognized best practices for securing IT systems and data. We lead a global community of IT professionals to continuously evolve these standards and provide products and services to proactively safeguard against emerging threats.” [2]
CIS is a group of industry security experts who came together to create security guidelines for various systems (OSes, Cloud Platforms like AWS, GCP, Azure, etc.) https://www.cisecurity.org/cis-benchmarks/ CIS Benchmarks for different Operating Systems and their versions like CentOS, Mac, Windows, etc. are the industry benchmarks for security. One can download these benchmarks from the Internet with no costs.
Background and Problem Statement
We have different tools to monitor different things on a Host for ensuring Host Security. They are:
- Vulnerability Management tools like Qualys, Nessus
- Hardening monitoring tools like CISCAT, Serverspec, etc.
- Host activity monitoring tools like OSQuery.
All these tools either need either an agent, or host credentials to do their work. What if we can use one tool that we already mandate in our organization (Organization is referring to Cisco Systems Inc.), i.e., OSQuery, to do all the three things that we listed? It will reduce our tooling and make it easy for securing our OS footprint across our organization.
Project Description
Motivation:
One tool for OS Monitoring, CIS Benchmark Checking, and Deep Vulnerability Checking
As mentioned above about OSQuery, OSQuery is widely used as a host monitoring solution. Extending this to the following will provide more benefits to OSQuery users. They are:
- OSQuery to check the CIS Benchmark Compliance
- OSQuery to check the installed RPM Package Vulnerabilities
OSQuery to check for CIS Benchmark Compliance
OSQuery could be used to SQL query different settings on a host. The same could be done to check for settings that CIS Benchmark is looking for thereby we could find the CIS Benchmark compliance of a host.
There are compliance packs to get the data, but needs work on tying all these together, validating against the desired states, and creating a compliance report. Also, not all information required for CIS checks may be available at which point, OSQuery tool needs to be extended to get those data.
OSQuery to check for Vulnerabilities
There is a query pack to get all the package information from the host. One idea is to take this package information, and the host OS variant version, and feed it static code tools like Corona (Cisco Internal), synk.io, or similar tools like it (that take Bill of Material of software and give you a vulnerability report), to get the vulnerabilities on the host.
Visibility
Tie all this above data into a usable information for these kinds of Personas:
- Admin who manages these hosts
- Security Architect assigned to that team
- Security Auditors (Internal and External)
- InfoSec Operations team
- Team Management (Management views with metrics)
- Company Management (Overall metric views across BUs)
Access Control
Provide RBAC access control to the above information.
Technologies and Other Constraints
Here is suggested technology list:
- https://osquery.io/
- CIS Benchmark document for operating systems
- If using AWS stack, here is a possible suggestion stack
- S3
- Lambda, EC2, Load balancer
- Angular or any UI framework, Cloudfront
- AWS ELK, Splunk (Commercial), S3 Data lakes and querying of it
- QuickSight
- AWS Glue
- Python, Javascript, or any language of choice
- For Vulnerability Piece of the story. Some tool that could be researched and considered include:
- https://github.com/anchore/grype (Looks like you could submit a Software Bill of material SBOM – list of RPMs), and get vulnerabilities.
References
Sponsor Background
The Game2Learn lab focuses on developing next-generation learning experiences for students learning to program or think Computationally. Professors Barnes and Cateté with Postdoc Nicholas Lytle in the NCSU Computer Science department are working together to build tools and technologies to improve k12 learning in science, technology, engineering, and mathematics, especially when integrated with computer science and computational thinking.
Background and Problem Statement
According to Code.org, over 50% of the U.S. states classify computer science as a math course contributing toward graduation. Unfortunately, higher level AP computer science courses are offered in less than 50% of schools. Advances in technology, particularly around artificial intelligence, machine learning, and cyber security, have given rise to both 1) a need for students to have a firm grasp on computer science and computational thinking (CS/CT) in order to contribute to society, and 2) a need for rapid development of educational tools to support their learning.
Regarding the latter, computing educators are often teaching a brand new subject after only a few weeks of training and very little experience with scaffolding, grading, and providing formative feedback on computational thinking activities. Many research tools have been developed to help support these teachers, but they only focus on one of these issues (e.g, scaffolding, grading) and don’t always consider the context of a live classroom. There has also been less attention paid to integrating analytics and intelligence into these tools to help analyze the impacts on the educator and students. Furthermore, although many individual educational tools are beneficial to students, the complexity around interacting with a variety of systems can cause students to become confused and disengaged, which may inhibit their learning. If students cannot manage their work and interactions in a useful and intuitive way, they lose the educational benefit of the systems they are attempting to use. Therefore, it is critical for CS learning by novice students to be able to provide a complete package for teacher-centric and classroom support around block-based programming.
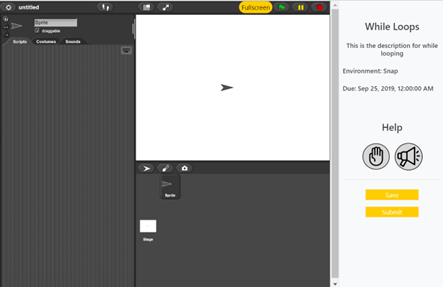 |
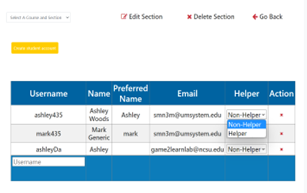 |
Figure 1: Student View of SnapClass with Snap (left) with teacher view (right).
In this project, we will build on a current beta tool called SnapClass. SnapClass will integrate multiple learning features into one environment for total classroom support. Our objectives as part of this project are to 1) develop new intelligent and data-driven supports to provide a teacher-centric hub for activity creation and student assessment, 2) develop an administrative dashboard for school staff to manage student accounts and activity and 3) collaborate with our K-12 school and teacher partners to beta-test, co-design and iteratively refine the new SnapClass system prior to release in the BJC and infusing-computing communities. While the different features are deployed into dozens of classrooms, with complete integration, SnapClass will become more accessible and desirable for a greater number of teachers, including the network of 500+ AP CS Principles teachers using the Snap!-based BJC curriculum and their 20,000 students annually.
Upon initial integration, SnapClass will be beta-tested with a core group of our partnering schools and teacher practitioners. This will include BJC Master Teachers (those who teach BJC and train new teachers) and our infusing computing teacher partners, including a research practice partnership where computing activities are integrated into the school’s classrooms. We have developed research and working relationships through our previous educational outreach efforts, so we can easily and quickly work with educators in these school systems to deploy and evaluate SnapClass. Once iteratively refined, we will release a larger deployment into our larger BJC and infusing computing network of nearly 1000 middle school and high school teachers.
Project Description
SnapClass is a learning hub used for account management and project sharing by both students and teachers for STEM+C assignments based on a prior version of a block-based programming data collection tool, Snaphub, developed at North Carolina State University. SnapClass facilitates low maintenance tools to establish intelligent and adaptive collaborative learning environments for students. This includes iSnap, an intelligent tutoring system tool developed for block-based programming assignments to be able to generate next-step hints and worked examples on problems., and learning management tools and support for teachers such as GradeSnap, with the scalability of data driven tutoring systems.
Features identified by teachers that we wish to include in the system include:
- Implementing an alert system for teachers (i.e., a 'hand raise feature') for students to signal to the teacher or to other students that they need help and for students and teachers to see this information and help others.
- Autosaving and means for students to easily "roll-back" to a previous version of the assignment if progress is lost.
- Implementing Self-reflection and peer feedback systems.
- Means to Connect data exported from SnapClass to other Learning Management Systems and software.
- Implementing a means for students to access Frequently asked questions about the assignment or about the block-based programming language while they are working.
- Means for teachers to search through a library of already developed lesson resources with the ability to select by assignment type, gradeband, topic, programming difficulty, and other relevant information.
- Implementing a rewards system to give students positive feedback for their work or effort during activities.
- An ability to develop and assign students to differentiated activities within the same classroom, potentially automatically by selecting students for easier versions based on their prior performance.
- Differentiated methods for navigating between assignment submissions.
Technologies and Other Constraints
- Desktop/Web-based/Mobile development - Requirement
- Snap
- Cellular
- JavaScript
- HTML
- SQL/phpMyAdmin
- Desktop Analysis & Dashboard development - Suggestion
- Python Programming
- HTML/JavaScript plug-in modules
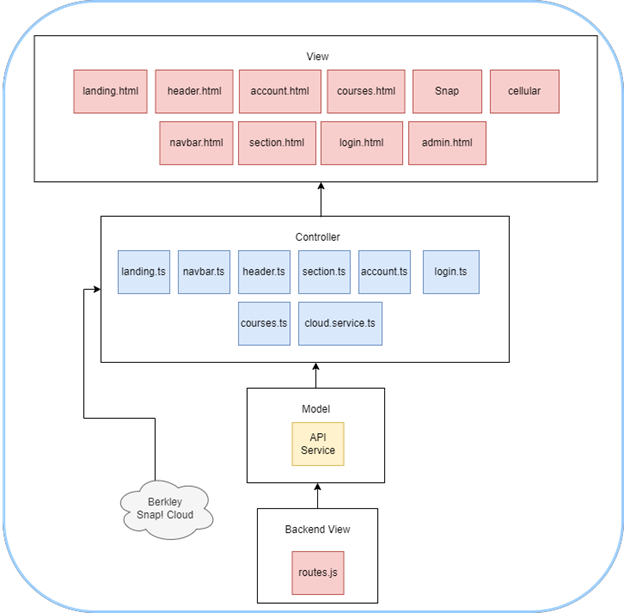
Figure 2: Architecture diagram developed by Previous Senior Design team.
Sponsor Background
NetApp is a cloud-led, data-centric software company dedicated to helping businesses run smoother, smarter and faster. To help our customers and partners achieve their business objectives, we help to ensure they get the most out of their cloud experiences -- whether private, public, or hybrid. We provide the ability to discover, integrate, automate, optimize, protect, and secure data and applications. At a technology level, NetApp is the home of ONTAP (our custom storage focused operating system); cloud, hybrid and all-flash physical solutions; unique apps and technology platforms for cloud-native apps; and an application-driven infrastructure which allows customers to optimize workloads in the cloud for performance and cost.
Background and Problem Statement
Real world network conditions have very significant impacts on the functionality and performance of commercial software and hardware systems. Network characteristics such as latency, drops and corruption must be part of the testing of these systems. However, it’s not always desired or even possible to create these conditions natively in test labs for practical reasons: lab space, cost, the need for reliable, automatable and repeatable test cases and basic physics (propagation + latency).
NetApp needs a high performance, reasonable cost option to enable distance testing in our labs. Past emulation solutions (based on Linux kernel stack using the “netem” module) are not ideal for high-performance networks up to 100 gigabit ethernet.
A newer and better alternative is the DPDK framework (https://www.dpdk.org/). We need 100G level performance now, and that will be increasing to 200G and 400G soon. A DPDK based approach is expected to be the best solution.
Why do this?
- Supporting distance for our DR solutions (DR referring to Disaster Recovery and meaning the same data will be present in two different geographical locations via an IP network ) is not easy. Latency (1mS/100km) and packet loss percentage
- latency and packet-loss are a functions of the DEMU package
- Expands our ability to test hybrid cloud use cases
- Reduces cloud testing costs by having cloud-like network characteristics on-premises for our internal engineering teams: - Dev and QA
- We need more teams to develop and test with real world network conditions to increase stability and quality to the field. Eliminate as many bugs as possible
- Commercial distance emulators are expensive. A, as an example,: a 100G Apposite Technologies single link emulator is $72k; we can build this solution for around $7k ($65k savings)
Project Description
The project requirement is to build a high-performance network emulator (NetEm) system that is placed in-between two network switches.
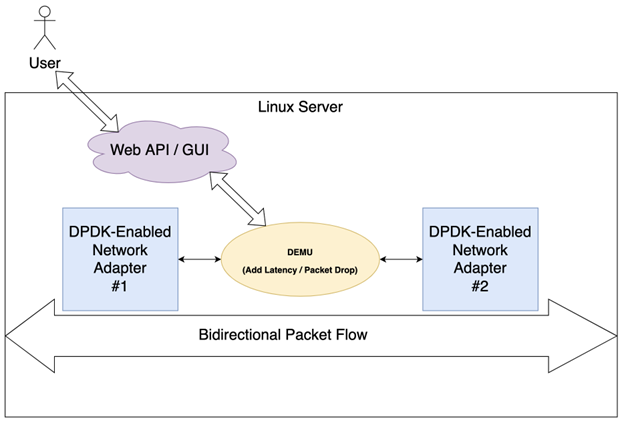
There is an existing open-source package DEMU that is a software-based network emulator implemented as a DPDK application(https://github.com/ryousei/demu). The objective of this project is to install the package on top of our existing hardware.
The hardware consists of Supermicro server (model: 2028TP-HTR) and a dual port Mellanox ConnectX-4 or ConnectX-5 100GbE network adapter. Since DPDK is an emerging technology, the difficult part is getting all of the components, including software libraries and hardware (Mellanox adapter) drivers, to work together. This project work will have a great impact on our ability to test real-world network conditions at high-performance network speeds of up to 100 gigabits per second.
Primary Feature
- Provide the ability to add distance with latency, packet loss and out-of-order delivery for user intervention and configuration during testing and development.
Project Goals
- Integration of the software modules to work with the network adapter
- DEMU - (DPDK-based network emulator) package: https://github.com/ryousei/demu
- DPDK guide for Mellanox adapters
- Improve performance of the distance emulator
- Use a newer 4.x kernel instead of the 2.32.x kernel in our current implementation
- The current implementation of the distance emulator used a 2.32.x kernel from the RHEL 6.x Linux distribution
NOTE: DEMU requires at least a 4.x or greater kernel. If a newer kernel version can be used such as a 5.x Kernel, that would be fine as well
- The current implementation of the distance emulator used a 2.32.x kernel from the RHEL 6.x Linux distribution
- Do performance tuning the Mellanox adapters and Linux system
- Use a newer 4.x kernel instead of the 2.32.x kernel in our current implementation
- Use a DPDK-based packet offload to bypass kernel packet processing overhead, combined with a package called "demu" to implement NetEm-like functions such as packet delay, jitter, and loss.
- NetEm is a widely used Linux kernel module used to emulate network impairments (latency and packet loss). NetEm does not scale well to handle high speed networks of 10 gigabit ethernet and higher. The DEMU package leverages the cutting edge DPDK packet processing framework to move past the bottleneck of the Linux kernel. It has been a major challenge to implement this on our internal systems, even with the how-to resources available for DPDK and DEMU. We are hoping that a team of advanced Computer Science students can research and experiment with this technology in order to unlock the potential for NetApp to use this to test our products with real-world customer network conditions
Bonus (Stretch Goals)
- Develop/design a Web GUI/ Web API to configure the settings
- Should provide the ability to set/get latency values, packet drop percentage and display real-time throughput counters
- The Web API should be able to configure the settings of DEMU (which by default utilizes a command line utility to configure settings).
- The API should also be able to fetch the current settings. A Web GUI can be running on the system, or perhaps in a container external to the emulator system itself, and can utilize the API to interact with the DEMU emulator.
Technologies and Other Constraints
Standard hardware (NetApp will provide this on loan for the duration of the project):
- Supermicro server (model: 2028TP-HTR)
- Dual port Mellanox ConnectX-4 or ConnectX-5 100GbE network adapters
Software:
- Linux 4.x or 5.x kernel
- DPDK
- DEMU (DPDK-based Network Emulator): https://github.com/ryousei/demu
- Little to no "kernel development" will be necessary. Some C development may be required to tweak the publicly available DEMU code (which is written in C) if it does not perform as intended (meaning alter code to make it do what the documentation says it can do).
- Web API programming used a lightweight web server, such as Nginx, and a backend web programming language, such as Python
- Web GUI frontend programming using HTML/CSS/Javascript, such as one of the many frontend web frameworks (React, Vue, Angular,jQuery)
Students will be required to sign over IP to sponsors when the team is formed
Sponsor Background
Pack Motorsports Formula is NC State’s Formula SAE team. This student lead club builds a car from the ground up annually to compete in the collegiate Formula series organized by the Society of Automotive Engineers (SAE). Founded in the early 2000s, Pack Motorsports (formerly Wolfpack Motorsports) has become one of the nation’s top teams with a second-place finish in Nevada’21 competition, fourth in Michigan’21, ninth in Michigan May’22, and sixth in Michigan June’22. As the team continues to advance, the importance of accurate and extensive data for design validation and driver feedback has become paramount. When you’re working on dropping tenths of seconds from a lap, every bit matters.
Background and Problem Statement
In the Summer of 2021, the team created its first iteration of a live telemetry module. This basic module collected data from the car’s engine control unit (ECU) via the controller area network (CAN) bus, packaged the values into an MQTT message, and sent them to an MQTT broker over a Wi-Fi network. This solution was quite effective, and a working prototype was up and running within 2 weeks. Furthermore, the decision to use an existing IoT protocol such as MQTT meant that there were several open-source dashboard projects that could be used to quickly make a visualization dashboard (Thingsboard, Node Red, etc). We soon realized that we wanted more than a generic dashboard implementation could provide. Ultimately, it was decided that we needed a custom dashboard to display live telemetry information that better suited our needs.
Project Description
We would like the student team to produce a full stack application to take in information from the MQTT broker, store this information in a time-series database for temporary display, and provide a customizable frontend for viewing this information. All of this must be done on a laptop completely offline.
Core components:
- MQTT broker to receive telemetry messages
- Automatic mechanism to subscribe to telemetry topics and store values from different sensor channels in a time-series database (only short-term persistence is needed as a separate application is used for full-run data analysis)
- Backend REST API
- Frontend application
- Multiple customizable graphical components:
- Numeric Gauge:
- Options: Position, height, width, color
- Bar Gauge
- Options: Position, height, width, color
- Time-series graph w/ ability to plot multiple channels
- Multiple signals
- Options: Position, height, width, color, threshold values
- Ability to save and export layout with a yaml file
- User’s layouts should be attached to the user’s account and applied on login.
- Users should also be able to import other user’s layouts.
Stretch goals:
- User system so users can make user-specific layouts
- A basic / relatively insecure login system is acceptable
- Map
- Need to show path
- Ability to change path based on another channel
- Options: Position, height, width, trail, show previous lap
- Need to show path
Technologies and Other Constraints
|
Technology |
Required |
Purpose |
|
MQTT |
Yes |
MQTT is the pub/sub application layer protocol we’ve selected for our telemetry solution. It’s a very popular IoT protocol with a lot of application support. It is also the protocol we are building the hardware around and will act as the bridge between the hardware side and the software side of the project. |
|
Yes |
Mosquito is a very popular open source MQTT broker managed by the Eclipse foundation. It’s a reliable and good performing broker that will work fine for the project. |
|
|
Docker Compose |
Yes |
Given the variety of technologies required for successful completion of this project and the need for portability between platforms, we would like students to use Docker Compose to simplify life cycle management and ensure cross-platform compatibility. |
|
Yes(ish)) |
A time series database is a natural choice for this application and InfluxDB is one of the industry leaders at the moment. Furthermore, we believe that learning a time-series query language such as Influx’s would be beneficial for students who have likely only been exposed to vanilla SQL. |
|
|
Telegraf |
Yes(ish) |
Telegraf is a metrics collection engine that is also part of InfluxDB’s (TICK) stack. This means that connecting these technologies is pretty straight forward and that good documentation exists for the process. |
|
Python |
No |
Python isn’t a hard requirement but it, along with Flask, represents a quick and easy way to build a REST API capable of performing business functions (like login, view displays, etc) |
|
Javascript |
No |
Given the heavy frontend component of this project, JS is the appropriate option for the visualization side of the project. A survey of existing visualization libraries such as D3 should be made to select ones that have the visualizations we need. This is where students will have the most freedom in technology choice as any suitable frontend framework is ok to use. Furthermore, the frontend represents what we expect to be the majority of the work in this project. Potential libraries include but are not limited to: |
Sponsor Background
Deutsche Bank is a German multinational investment bank and financial services company that ranks amongst the top banks in Europe. It spends multi-billion dollars on maintaining and updating its IT. Deutsche Bank and Google Cloud have recently signed a pioneering cloud and innovation partnership to modernize the IT.
NCSU’s Senior Design project is a perfect opportunity for our Cary-based IT teams to engage with the students and develop a tangible product that is useful in solving some of our software related needs.
Background and Problem Statement
This project focuses on using generic Natural Language Processing Solutions for Measurement of Semantic Similarity Given a new question, the system will use NLP techniques to identify most similar prior questions and answers from the data source (bank) of historic questions. The prior questions could be any set of questions/answers. The tool should be able to accept sets of generic Q/A type data. For example, the Q/A can be Know-Your-Customer (KYC) questions, RFP requests, job interview questions, etc.
Once the Q/A dataset is provided, the tool (bot) will process it using Natural Language Processing (NLP) and Artificial Intelligence (AI). When a user asks a question the tool would recollect the most similar previous questions and their answers. The long-term view is to act as an assistant to streamline human responses for commonly received similar questions.
The project will be implemented using Google Cloud Platform, which offers various Natural Language Processing techniques. We are interested in leveraging some of these technologies for developing an app/tool/bot/website that would assist a human support team member in providing such answers with ease.
Project Description
This will be a Greenfield project. Hence in the initial few days we will work with students and collectively evaluate the multitude of available options and decide on the most viable ones.
The goal is to develop an MVP (minimum viable product) wherein the tool could take a standard Q/A dataset, process it and be able to provide “most similar prior questions and answers” from the dataset.
We will then explore and develop interactive features for that product.
Technologies and Other Constraints
We would prefer to have the product usable over a website hosted in GCP.
Students will be required to sign over IP to sponsors when the team is formed
Sponsor Background
The Laboratory for Analytic Sciences is a research organization in support of the U.S. Government, working to develop new analytic tradecraft, techniques, and technology that help intelligence analysts better perform complex tasks. Processing large volumes of data is a foundational capability in support of many analysis tools and workflows. Any improvements to existing processes and procedures, whether they are measured in time, efficiency, or stability, can have significant and broad reaching impact on the intelligence community’s ability to supply decision-makers and operational stakeholders with accurate and timely information.
Background and Problem Statement
Training state-of-the-art machine learning models typically requires large datasets with high-quality annotations (i.e. data labels). For instance, DALL-E 2, a new image generation algorithm from OpenAI was trained on 650 million image pairs. Creating and annotating this amount of data takes an extensive amount of time and many human-resources.
In industry and academia, some researchers leverage crowdsourcing to help alleviate the labeling burden (e.g. Amazon Mechanical Turk). With proprietary, or classified, data this option is unavailable, and other options must be explored and utilized. In the computer vision space, often you may be able to leverage a pre-existing model (e.g. YOLO, Detectron2, ResNet, etc) to pre-annotate some of the objects of interest.
In this project, we seek to extend our internal data annotation system (called Infinitypool) with a separate machine-learning pre-annotation backend service. When configured on a project, this system will pre-populate tasks with machine-derived annotations (e.g. bounding boxes around vehicles in an image) to help speed up the annotation task. The examples below demonstrate what will be done for the image domain, yet our goal will be to extend this capability to also include the text, audio, and video data formats.
Project Description
The Fall 2022 Senior Design team is asked to create a prototype full-stack solution for adding machine learning pre-annotations to our current annotation application (Infinitypool). Previously, a 2019 NCSU CS Senior Design team prototyped a gamification system that has now been rolled into our production system. We envision the same implementation path to production for this year’s team.
The team will need to develop both frontend enhancements and backend integration code for Infinitypool to interact with a machine learning service.
Consider the scenario where a machine learning model is needed that identifies vehicles, people, flags, security cameras, and light poles in images. Figure 1 is presented to a human annotator to identify and mark each of these objects in the image. Starting from scratch, creating boxes around each of these objects is time consuming, and even minor efficiency costs add up tremendously when annotating hundreds or thousands of images.

Figure 1 - Example image that needs to have annotated labels for vehicles, people, flags, security cameras, and light poles.
Using a pre-annotation backend would allow a Machine Learning service to detect perhaps the vehicles and individuals, but not the flag, surveillance cameras, or light poles. See Figure 2. The pre-annotation will save time for the human annotator by allowing them to edit the labels that are presented and to focus on identifying those objects the initial model does not detect. As a result, this both saves human annotation time and will potentially improve the quality of annotations created.
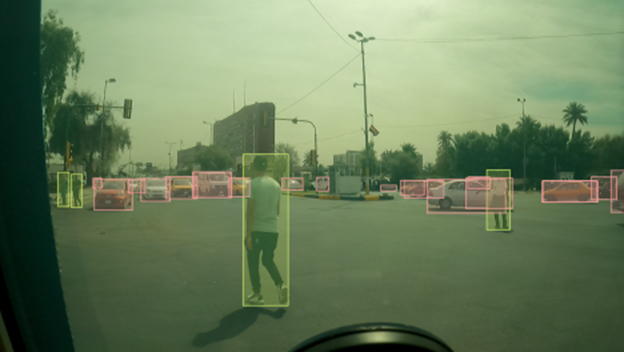
Figure 2 - Pre-annotated image using an open source model like YOLOv4. This model detects most vehicles and individuals but no flags, security cameras, or light poles.
Infinitypool will facilitate the interactions with a pre-loaded model so that, upon request, tasks for labeling will be sent to the pre-annotation service and the data object and the pre-annotation labels are displayed to the annotator for evaluation. Then, as in Figure 3, the annotator can adjust the vehicle and people boxes as necessary, and identify the flags, security cameras and light poles from scratch.
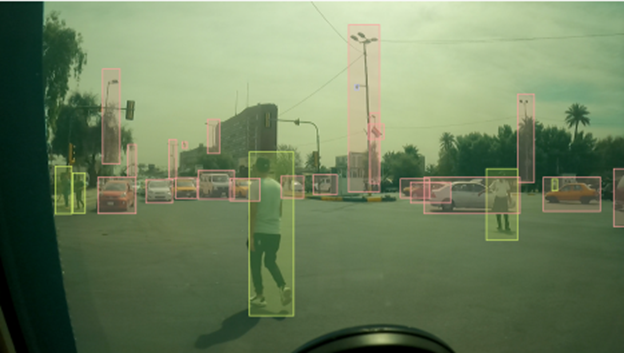
Figure 3 - Human annotated image that includes flags, security cameras, and light poles.
Current capability within Infinitypool allows for a user to manually load known annotations when loading an annotation task so that labelers can edit existing annotations within a task. Yet this feature requires users to load the labels in advance for every task and does not allow for near real-time model and labeling improvements that are needed to maximize the efficiency and effectiveness of the human-machine teaming. Building out an API driven pre-annotation service will improve annotation quality while reducing labeling time and enabling near real-time annotation improvements.
The team will need to develop new UI components within the current application (React and Node.js), and backend interactions between the application and an already deployed machine learning service. The backend interactions will be API driven and will include format converters so the pre-annotation service will work across the text, image, audio, and video domains.
Stretch Goals: Image and video labeling are areas where the pre-annotation will be especially useful due to the time it takes to annotate these media domains. In addition to pre-annotation, the Senior Design students can investigate ways to improve annotation performance and workflows through UI improvements and advanced, model driven annotation services, to include click-carving and object-tracking through video. These improvements will build on and extend the model pre-annotation service described above.
The LAS support team will provide all needed models to test and evaluate the pre-annotation service developed by the Senior Design Team.
Technologies and Other Constraints
In completing this project, the team will be expected to use the following technologies, possibly with some others selected during the semester.
- Git – required (to be provided by NCSU)
- Docker
- React and Node.js
- Typescript
- PSQL
ALSO NOTE: Public distributions of research performed in conjunction with USG persons or groups are subject to pre-publication review by the USG. In the case of the LAS, typically this review process is performed with great expediency, is transparent to research partners, and is of little to no consequence to the students.
Sponsor Background
LAS is a mission-oriented translational research lab focused on the development of new analytic technology and analysis tradecraft. The new technologies will help us understand the underlying scientific principles and analytics required to meet the complex and dynamic challenges presented by "Big Data." The new tradecraft will help us discover, understand, and enhance critical aspects of intelligence analysis. These new technologies and tradecraft will be brought together through the development of user experiences that allow engagement with the data, tools, and techniques to achieve mission outcomes
Background and Problem Statement
Over the past few years, LAS has developed a system, AWS Commander, to help manage our computing infrastructure within Amazon Web Services (AWS). The system tracks expenditures, provisions virtual machines (VMs), and manages user accounts on those VMs. The system also has capabilities to provide a standardized Linux desktop environment (along with data science tools), provision web proxies for authentication, increase VM storage, and schedule when virtual machines operate.
While in the past, LAS has used several different big data processing environments, we currently do not have any active projects in this space; nor do we make it particularly easy for users to process large amounts of data. By "big data", we refer to datasets that are too large to be processed on a single virtual machine or processing that would benefit through task parallelization.
AWS also offers a compelling environment in which compute and data resources can be scaled independently – Hadoop-based deployments tied these two factors together.
Project Description
Goal: Develop a new module with AWS Commander that allows users to provision an AWS Elastic Map Reduce (EMR) cluster. The cluster should be available either for a specific timeframe or to execute a specific job defined by the user. By allowing the cluster to be available for a specific timeframe, users can connect to the cluster in Jupyter notebooks (or other platforms/applications) to perform ad-hoc processing. By having the cluster available to process a specific job, resource expenditures are optimized. We also envision the project team providing sample notebooks and applications to use these dynamically deployed environments.
In terms of the EMR cluster, we would also ask the students to perform an analysis comparing the serverless versus EC2-based clusters. How do they compare in terms of cost, processing times, and usability?
Technologies and Other Constraints
We envision this application to be web-based utilizing a local database to track information essential to that application and then interfacing with AWS services through provided APIs. The current web application server has been developed using Java Servlets, JSPs, and some portions of the Spring Framework. The front-end has been developed using the Bootstrap templates as a starting point, but largely leveraging vanilla HTML, CSS, and JavaScript. JavaScript libraries such as jQuery have been utilized, but not a full-fledged environment such as Angular, React, or View. The current database system is PostgreSQL.
While we would prefer to continue to use the existing technology stack, we are open to other options – including building a separate tool for this. We strongly prefer the primary languages to either be Java or Python for the back-end application services. Samples should be in Python for Jupyter notebooks and then Python and Java for submitted jobs.
We do envision Spark to be the primary computing platform, leveraging S3 for storage.
Sponsor Background
LexisNexis® InterAction® is a flexible and uniquely designed CRM platform that drives business development, marketing, and increased client satisfaction for legal and professional services firms. InterAction provides features and functionality that dramatically improve the tracking and mapping of the firm’s key relationships – who knows whom, areas of expertise, up-to-date case work and litigation – and makes this information actionable through marketing automation, opportunity management, client meeting and activity management, matter and engagement tracking, referral management, and relationship-based business development
Background and Problem Statement
In today’s world, you are more likely to encounter a prospective client or business opportunity while online than in person. Rather than transcribe contact details between the browser and a CRM system (through re-typing or multiple cut-and-pastes), there needs to be a simple, streamlined method for capturing this information.
Project Description
Primary objective:
Create an add-in for Chrome, Edge and Safari browsers that will allow the user to highlight contact details on a web page and create a new InterAction contact record, parsing the relevant fields (e.g. name, address, phone number, email, etc.).
Potential additional objectives:
- Capture contact details from PDFs, viewed through the browser
- Learn to recognize potential contacts on a page and highlight suggestions (Machine Learning?)
- Any of the above capabilities, delivered on a mobile device (iOS/Android)
Technologies and Other Constraints
The bowser add-in will connect to an Azure service, and an InterAction API allowing for user authentication and the upload of new Contact records will be provided.
Preferred development technologies include Angular 12+, C#/.Net, SQL Server, but this should not be considered a constraint upon the development team.
Students will be required to sign over IP to sponsors when the team is formed
Sponsor Background
SAS provides technology that is used around the world to transform data into intelligence. This project is sponsored by Data Visualization Research and Development at SAS. We work on Data Visualization components, services, and applications for web, iOS, and Android.
Background and Problem Statement
An important piece of SAS’ continuous development lifecycle is doing "End to End" automated testing of our applications. By its nature, data visualization results in visual outputs, so an important fraction of these tests involve taking screen captures and comparing them to a "known good" benchmark image. These can be unit tests or integration tests and supplement the traditional tests that have expectations that can be expressed more easily in code. Using image captures and comparisons in tests is an imperfect science, and often needs human input to fully interpret the test results and accurately report on them. This is currently achieved through our test reporting application, "Gozer". Gozer is a set of services backed by a database with a web application that enables our developers and testers to review and interpret their end to end test results.
Comparing images
Here is an example of an image snapshot from a test, that test's benchmark image, and the computed difference.
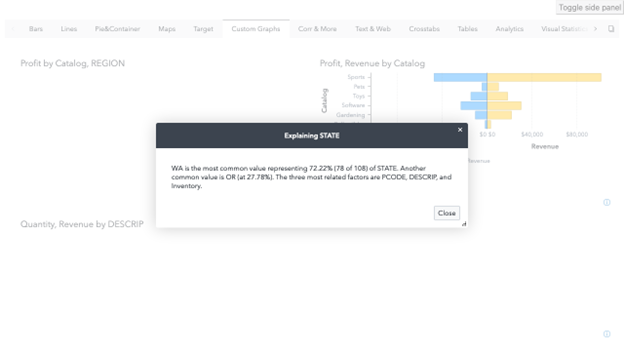
Test
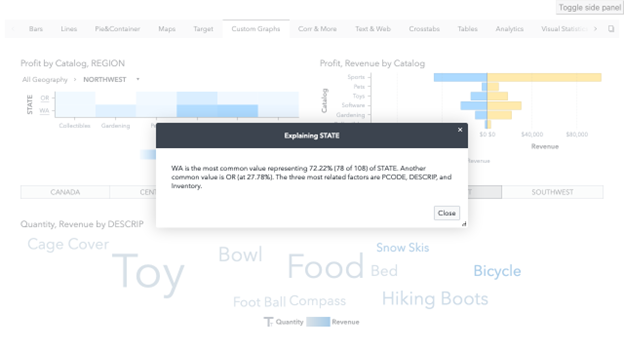
Benchmark
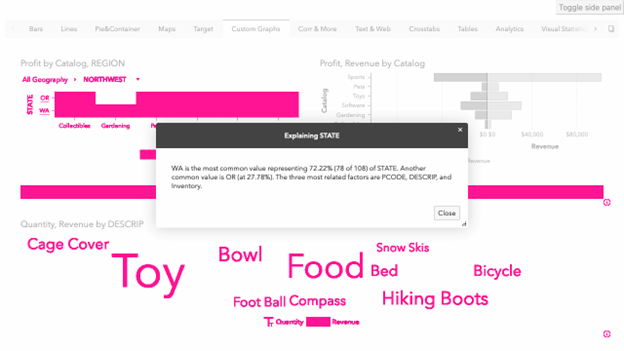
Difference
Project Description: Redesign the "Code Review Workflow"
The most critical workflow that Gozer supports is one that assists the developer in going from a test build to code review. The code review process provides assurances that new work has been properly vetted before being accepted. A new feature or a bug fix can have unintended consequences somewhere in the application, and the developer needs to confirm that all visual changes are as expected before submitting their work for review. The developer may iterate many times with a branch containing their work, using the test results as a guide before deciding that the work is ready for review. The reviewer independently may judge whether these assessments of the visual differences are reasonable in addition to their normal duties to examine the changes in code.
We want you to create a modern web application to provide the UI that developers and code reviewers would use to examine test results, and provide their assessments of the results. The emphasis in this project is on front-end development. You will not have access to a working back-end Gozer server, but instead will be using mock-data that will simulate what the Gozer server would have provided.
You get to exercise your judgment in the UI design, understanding that the primary features are:
- The user needs to know which tests have passed and failed.
- The user needs to be able to see the test image, the corresponding benchmark, and the visual difference image for every difference in the test. (One test may have many steps, and therefore many differences.)
- The user needs to be able to address each failure and perform an action, which could change the failed state to a passing state, if the user deems the change is acceptable. Actions include setting a new benchmark (either to replace the previous benchmark, or act as an alternate), associating a difference with a ticket in a bug tracker, or ignoring the difference as unimportant without otherwise making changes.
- The user needs to be able to see how issues have been resolved for a build and visit each in turn. In particular the reviewer will want to look over these choices and decide whether they agree with the developer. The UI should make it easy to tell which issues are unresolved, or have been benched, associated with bugs, or ignored.
- There ought to be a mechanism to clear the classification of an issue if a mistake was made or if, after a discussion, there is a decision to reclassify it.
You should consider that the list of issues for a build might potentially be large, and that the code review process happens over and over, so anything that streamlines the workflow is helpful. You will be provided a few example data sets representing different builds. For each of these that will constitute:
- A set of JSON documents describing the test results for a build. This includes structural information about all of the test cases run, all of the steps in each test case, test/bench/diff images for the test step, and a pass/fail grade for each test case.
- A set of images representing the test artifacts, one for every step of every test run for every test case in the build.
- A set of difference images, one for every test artifact and benchmark pair that differs. When a test artifact matches the benchmark, no difference image is generated.
- A set of images representing the benchmarks, one (or sometimes more, if there are alternates) for every step of every test case.
Technologies and Other Constraints
The project is expected to use the following technologies. Students will benefit from some prior knowledge and experience with these and with web development in general.
- JavaScript (TypeScript recommended)
- CSS
- Modern web framework (React recommended)
Reference info
Sponsor will provide multiple test data files to use as the backing data to drive the application UI.
Sponsor Background
With our corporate headquarters based in Raleigh, Vontier is a young company spun off from Fortive. We are well positioned in the transportation space with companies operating in several different spaces that impact your daily life. The lifecycle of the automobile revolves around everything that we do. We are looking to challenge the traditional understanding of data, capturing opportunities to develop a better experience in all that we do.
Our 6 Companies are:
Gilbarco Veeder Root – Equipment manufacturer for energy distribution (fuel pumps, tank monitoring)
Matco Tools – Mobile Tool Sales
Hennessy – Manufactures equipment for the auto industry such as tire mounting and wheel balancers
DRB – Car Wash Site Management
Teletrac Navman – Fleet Management Tracking
Global Traffic Technologies – Municipal Traffic Sensing Platform
Background and Problem Statement
With the opportunity to explore 6 different companies' activities, we have a broad range of opportunity within Vontier. As the company continues to grow, we believe development of dashboarding will be necessary to properly capture the inner workings of the parent corporation for financial reporting. The current process requires a lot of manual intervention, can be error prone, and utilizes too many touchpoints.
We are looking to develop automated reporting tools to help us identify our current state, highlight operational performance improvements, establish common data structures to standardize and build out more descriptive tools to better inform our leadership team.
Project Description
The opportunities within Vontier have the flexibility to touch several different aspects of the working world. This project will be focused on the creation of a data framework used to curate data sources and consume that output for the creation of new dashboards developed by the team that can be presented to the leadership team for reporting of key financial data. Data tables will already be identified and preliminary data cleaning has already been addressed. We are looking for individuals interested in developing their skill sets in database management, learning the process of developing common data frameworks, dashboard creation, and building out overall business execution knowledge. The team is not expected to make recommendations to the business based on the information being captured in the reports.
Business Intelligence dashboarding will be created to report activities within each Operating Company of the organization. Reporting activities will be focused on consolidation of financial reporting based on business centric categories such as product type, market location, and revenue segmentation by organization within the OpCo. The team will be responsible for presentation of the outputs to key stakeholders in the business and adapting the product based on feedback provided through the overall process.
These dashboards will require database shaping, pipeline development, and creating / publishing standardized reports to capture critical findings. New table development to join data from our various operating companies will be required. The team will get exposure to enterprise resource planning tools (ERP), learning how to extract data from disparate sources and combining them into a common source that can be evaluated for business insights. Depending on the progress of the team, additional work may also expand into predictive ML analytics to better identify organizational trends that are impacting the business.
Technologies and Other Constraints
Access to all tools that will be required to support our development will be provided by Vontier.
We follow an agile development process and would like to have the team develop documentation in the Atlassian Tool Chain. Familiarity with Confluence and Jira would be helpful but not required.
Our toolchain includes:
- Atlassian Components
- Modern Cloud Infrastructures: AWS and Azure
- Business Analytics Tools: Microsoft Power BI
- Database Management: Snowflake
- Other Toolchains (optional): Matillion
Students will be required to sign over IP to sponsors when the team is formed and all students who participate in this activity will be expected to sign a non-disclosure agreement.
Project Archives
| 2026 | Spring | Fall | |
| 2025 | Spring | Fall | |
| 2024 | Spring | Fall | |
| 2023 | Spring | Fall | |
| 2022 | Spring | Fall | |
| 2021 | Spring | Fall | |
| 2020 | Spring | Fall | |
| 2019 | Spring | Fall | |
| 2018 | Spring | Fall | |
| 2017 | Spring | Fall | |
| 2016 | Spring | Fall | |
| 2015 | Spring | Fall | |
| 2014 | Spring | Fall | |
| 2013 | Spring | Fall | |
| 2012 | Spring | Fall | |
| 2011 | Spring | Fall | |
| 2010 | Spring | Fall | |
| 2009 | Spring | Fall | |
| 2008 | Spring | Fall | |
| 2007 | Spring | Fall | Summer |
| 2006 | Spring | Fall | |
| 2005 | Spring | Fall | |
| 2004 | Spring | Fall | Summer |
| 2003 | Spring | Fall | |
| 2002 | Spring | Fall | |
| 2001 | Spring | Fall |